

Abstract
Many species classify images according to visual attributes. In pigeons, local features may disproportionately control classification, whereas in primates global features may exert greater control. In the absence of explicitly comparative studies, in which different species are tested with the same stimuli under similar conditions, it is not possible to determine how much of the variation in the control of classification is due to species differences and how much is due to differences in the stimuli, training, or testing conditions. We tested rhesus monkeys (Macaca mulatta) and orangutans (Pongo pygmaeus and Pongo abelii) in identical tests in which images were modified to determine which stimulus features controlled classification. Monkeys and orangutans were trained to classify full color images of birds, fish, flowers, and people; they were later given generalization tests in which images were novel, black and white, black and white line drawings, or scrambled. Classification in these primate species was controlled by multiple stimulus attributes, both global and local, and the species behaved similarly.
Keywords: rhesus monkey, orangutan, classification, vision
Many organisms generalize and discriminate in ways that at least approximate classification of images (Brown & Boysen, 2000; Close & Call, 2015; D’Amato & Van Sant, 1988; Herrnstein & Loveland, 1964; Koba & Izumi, 2006; Spencer, Quinn, Johnson, & Karmiloff‐Smith, 1997; Zentall, Wasserman, Lazareva, Thompson, & Rattermann, 2008). For example, several species successfully assign stimuli to groups by making specific responses when presented with images belonging to the groups (Basile & Hampton, 2013; Gazes, Brown, Basile, & Hampton, 2013; Hayes & Nissen, 1971; Schrier, Angarella, & Povar, 1984; Wasserman, Kiedinger, & Bhatt, 1988). In other paradigms subjects select the image belonging to a target category from among two images, for example selecting the cat image when presented with a car image as a distractor (Marsh & MacDonald, 2008; Roberts & Mazmanian, 1988; Vonk & MacDonald, 2002, 2004).
Performance in classification tests can be partly determined by memorization of specific stimuli, but generalization to novel images demonstrates that classification is also controlled by perceptual features shared by members of a category (e.g. Bhatt, Wasserman, Reynolds, & Knauss, 1988). Generalization of a classification rule to novel exemplars has been observed in many species (e.g. stumptailed macaques, Schrier et al., 1984; capuchin monkeys, D’Amato & Van Sant, 1988; orangutans, Vonk & MacDonald, 2004; gorillas, Vonk & MacDonald, 2002; chimpanzees, Close & Call, 2015; Vonk, Jett, Mosteller, & Galvan, 2013; pigeons, Aust & Huber, 2001; Bhatt, Wasserman, Reynolds, & Knauss, 1988; black bears, Vonk, Jett, & Mosteller, 2012; and sharks, Schluessel & Duengen, 2015). When control of classification by shared perceptual features has been directly contrasted with control by memorization, shared perceptual features exert stronger control. For example, pigeons more readily classify images into natural phylogenetic categories such as cats or people than into arbitrary pseudo-categories that include images of both cats and people (Wasserman et al., 1988).
Although accurate performance in classification tests is widespread, the perceptual features that control classification may differ among species and tests. For example, local features, such as textures and other small scale features that make up an image, may exert stronger control in pigeons, whereas global features that manifest over larger areas, such as broad contours, may drive classification in humans and nonhuman primates (Aust & Braunöder, 2015; Aust & Huber 2001; 2003; Cavoto & Cook 2001; Ghosh, Lea, & Noury, 2004; Jitsumori & Yoshihara, 1997; Martin-Malivel & Fagot, 2001; Schier & Brady, 1987; but see Fagot & Tomonaga, 1999; Lea, De Filippo, Dakin, & Meier, 2013; Wasserman & Biederman, 2012). Classification has been observed to be determined by single features, such as the color red (D’Amato & Van Sant, 1988) or longitudinal axis orientation (Cook, Wright, & Drachman, 2013). In other cases, classification appears to be determined by multiple features including shape, color, and texture, and eliminating one of those features attenuates, but does not eliminate classification performance. For example, classification by orangutans was attenuated when the global cue of color was modified (Marsh & MacDonald, 2008). Similarly, chimpanzees trained to discriminate full color images did not spontaneously transfer categorization to black and white line drawings in which fill pattern was eliminated, but did learn to correctly classify manipulated images (Close & Call, 2015).
Together, these studies indicate that classification performance is controlled by a variety of stimulus properties, and by both generalization and memorization. It is only with directly comparative studies in which different species are tested with the same stimuli under similar conditions, that it is possible to determine how much of this variation in the control of classification is due to species differences and how much is due to difference in the stimuli, training, or testing conditions (Jitsumori & Matsuzawa, 1991; Martin-Malivel, Mangini, Fagot, & Biederman, 2006; Parr, Winslow, Hopkins, & de Waal, 2000; Roberts & Mazmanian, 1988; Vonk & Galvan, 2014).
We used identical test stimuli and similar training and testing conditions to conduct an initial direct comparative assessment of which perceptual features control classification in primates from two genera: rhesus monkeys and orangutans. Evidence from complete mitochondrial genome sequencing indicates that macaques diverged from hominoids about 32 million years ago and orangutans diverged 15.2 million years ago (Finstermeier et al., 2013). The simplest evolutionary scenario for similarities in classification behavior among humans, orangutans, and rhesus monkeys would therefore be that the cognitive systems underlying performance evolved in a common ancestor that lived before these splits.
Monkeys and orangutans learned to classify images of birds, fish, flowers, and people. We determined the role of memorization by testing for generalization to novel images, and we evaluated control by different stimulus features by presenting probe images from which features had been removed or which had been scrambled to disrupt global structure. We hypothesized that if classification is controlled by global shape, then accuracy would be little affected by tests in which color and fill pattern were modified, but would be impaired by scrambling images. In contrast, to the extent that classification is controlled by local cues, performance should remain stable in the face of image scrambling, but be impaired when color or fill pattern is removed. If a combination of these global and local cues controls classification, then accuracy might decline following any one manipulation, but remain above chance across all test types.
Method
Subjects
Four rhesus monkeys (Macaca mulatta) and two orangutans (Pongo pygmaeus and Pongo abelii) were tested. The monkeys were females between 1.5 and 2 years old at the start of training, and lived in a large social group of about 80 animals at the Yerkes National Primate Research Center field station. Monkeys had an RFID microchip (Biomark, Boise ID) implanted in each forearm for automatic identification and individual data collection. Monkeys participated in testing ad libitum while in their social group (Gazes et al., 2013). Four monkeys had completed category training and were ready for tests with manipulated images at the time this study was conducted. Other monkeys in the group either chose not to participate in testing, had not reached criterion, or were not assigned to the classification experiment. One orangutan was a 29 year old Sumatran female; the other was a 9 year old Bornean male. Both lived in a social group at Zoo Atlanta and were tested while off exhibit. Both monkeys and orangutans had access to their regular diet throughout testing.
Apparatus
Monkey apparatus.
Monkeys had free access to an automated touchscreen computer apparatus composed of a 15-inch LCD color touchscreen monitor, desktop computer, speakers, automated reward dispensers (MedAssociates Inc. St. Albans, VT), and an RFID chip reader (Biomark, Boise, ID; Gazes et al., 2013). Four of these automated touchscreen systems were located within the animal enclosure.
Orangutan apparatus.
Orangutans used systems composed of a 15-inch LCD color touchscreen monitor, laptop computer, speakers, and automated reward dispenser (MedAssociates Inc. St. Albans, VT) in both their outdoor exhibit and indoor housing enclosures. The orangutans had access to the indoor computer apparatus for approximately 1 h in the morning 6 days a week before going on exhibit for the day. During training, food reinforcement was either given by hand or by an automated pellet dispenser. Some training trials were conducted outside on exhibit, but all testing occurred indoors, using the automated food dispenser.
Training
Stimuli.
Stimuli were 400 color photographs, 100 from each of four categories: fish, flowers, birds, and people. All images were gathered from the online photograph repository Flickr (Yahoo!, Sunnyvale, CA). Duplicates were eliminated using DupDetector (Prismatic Software, Anaheim, CA) and by visual inspection. Images were cropped to 400 × 300 pixels using Adobe Photoshop (Adobe, San Jose, CA). Each image contained at least one exemplar from a single category, and exemplars varied widely in perceptual features (e.g., fish included goldfish and sharks, presented alone and in schools, in the ocean and on a plate). Images were screened manually to ensure that they did not contain exemplars from more than one category (Gazes et al., 2013).
Procedure.
Trials began when subjects touched a green start square twice (FR2). One of the 400 training images then appeared in the center of the screen. Touching the image (FR2) caused the four (100 × 100 pixel) choice icons to appear in the four corners of the screen (Figure 1). The locations and identities of the choice icons were the same across trials. Correct choices extinguished all stimuli and were followed by a positive auditory signal, a food pellet (BioServ & TestDiet; monkeys: 95mg; orangutans: 190mg), and a 3-s intertrial interval during which the screen was black. In both training and test trials, incorrect choices also extinguished the stimuli, but were followed by a negative auditory signal, a 5-s time out period during which the screen was black, and no food reinforcement. Incorrect trials were repeated immediately after the time out. If subject erred again, then the cycle repeated except that after the subject touched the image, only the correct choice icon appeared. Only the first attempt with a given trial was included in accuracy calculations.
Figure 1.

Example classification test. Subjects initiated trials by touching the green square. They were then presented with an image to classify placed in the center of the screen. Touching the sample image caused the classification icons to appear in the four corners of the screen. Correct choices were rewarded with food, incorrect responses were followed by a brief time out.
The order of trials was pseudo-randomized such that two images from each category were presented in each block of eight trials. Trial sets were pre-generated to ensure randomization and counterbalancing. Trial sets were not typically completed in a single testing session. Instead, each testing day began where the last one had left off, until a trial set was complete, at which time a new trial set was generated.
Monkeys were trained until they reached 80% correct in a single 400-trial set. Chance is 25% in this four-choice task. The first orangutan we tested received nearly 20,000 training trials without reaching the 80% criterion. Her performance stabilized at 70%, so this criterion was adopted for the orangutans. The performance of the second orangutan had not improved from chance after 7,000 trials, so we instituted a remedial training procedure to facilitate learning. For this animal, response icons for all four categories were always available at test, but images from the different categories were introduced sequentially. Images from one category were used exclusively until the orangutan made at least 70% correct responses in a set of 100 trials. Each category was introduced alone in this way. He then received 200-trial sets with images from two categories: people and flowers. This procedure of incrementally adding images from additional categories continued until he reached criterion on a regular 400 trial training set with all four image types.
Transfer Tests
Novel image transfer.
To assess whether subjects had memorized specific stimuli and their associated responses during training, we administered generalization tests in which they were tested with 50 novel images belonging to each of the four groups of stimuli (Figure 2). These 200 novel images were intermixed with the 400 training images to create one 600 trial transfer set. Every 8 trials the subjects saw two images from each category, with all 150 images from each category randomly ordered. The rhesus monkeys in this experiment also participated in Gazes et al. (2013). In that study, the four individuals used in this study only completed the novel image transfer test. None of the other individuals included in that study completed the additional transfer tests reported here.
Figure 2.

Examples of images used in generalization tests. Images were either novel images that had not been manipulated (top left), or novel images that had been color desaturated (top right), reduced to line drawings (bottom left), or scrambled (bottom right). Generalization test trials were identical to regular trials in all other respects.
Black and white transfer.
To determine the extent to which color is critical for classification by orangutans and rhesus monkeys, subjects were presented with black and white transfer images. Fifty novel images belonging to each category were fully desaturated using Adobe Photoshop (Figure 2, Adobe Systems Incorporated, San Jose, CA) to eliminate all color (Basile & Hampton, 2013) and intermixed with the 400 training images in one 600-trial transfer set. Images were pseudo-randomized as before.
Line drawing transfer.
Classification of images belonging to some categories may be controlled by local features such as fill pattern. The scales and feathers of fish and birds, for example, may provide enough information for reliable classification without global features such as form and contours. To determine the extent to which fill pattern within the images controlled classification, subjects received a third transfer test in which they saw novel images from each category from which both color and fill cues had been removed, so the stimuli were line drawings. Photographs were digitally transformed using the Adobe Photoshop high pass filter and note-paper filter (Figure 2; Adobe Systems Incorporated, San Jose, CA). Fifty novel images belonging to each category were presented intermixed with the 400 training images in one 600 trial transfer set. Images were pseudo-randomized as before. Due to experimenter error, one orangutan did not complete the line drawing transfer test.
Scrambled image transfer.
To determine the extent to which global image structure controlled classification, subjects received a final transfer test in which 50 novel images from each category were scrambled and presented as probes. The scrambling was done trial-by-trial by the software that controlled the experiment. To ensure that smaller features and their distance from the center of the image were preserved while the arrangement of those features relative to one another was disrupted, images were scrambled with the restrictions that each 40 × 30 pixel segment remained upright, moved from the location it occupied in the original image, and remained the same distance from the center of the image (Figure 2; Basile & Hampton, 2013). To provide a direct comparison that controlled for the novelty of the images, subjects were tested with a second set of 50 novel unscrambled images from each category type (Novel 2). These 400 transfer tests were presented with the 400 familiar images in a single 800-trial set in which images were pseudo-randomized as before. Due to experimenter error, during the scrambled image trial set the monkeys did not receive correction trials when they made an error.
Data Analyses
Data from the 600- or 800-trial transfer sets were analyzed. We determined whether each subject performed above chance with each set of transfer images using binomial tests that compared the observed frequency of correct responses with transfer images to that expected by chance (50 correct responses out of 200 tests are expected by chance). An alpha level of 0.05 was used for all analyses. We assessed generalization from the familiar images shown in training to the transfer images using chi-square tests that compared the frequency of correct responses with familiar images presented in probe sets to that with probe images presented in the same set. To determine the extent to which decrements in performance in transfer with modified images was due to the image modifications rather than simply to the introduction of novel images, we also compared performance in the first transfer to new images to performance in transfer to new images that were modified, using paired t-tests that included the orangutan and monkey subjects as a group. For these tests, accuracy data were expressed as proportion correct and arcsine transformed (Aron & Aron, 1999) to better conform to the normality assumption. If the modifications made to the images per se affect the animal’s ability to classify them, then accuracy on such trials should be significantly lower than on transfer trials involving novel unmodified images.
Results and Discussion
The orangutans met the training criterion of 70% in 12,877 and 21,947 trials, including remedial trials. The monkeys met their training criterion of 80% in an average of 4,407.25 trials. Due to computer malfunctions, some 400-trial training sets were not completed. We included these irregular training sessions to accurately report the number of trials subjects took to reach criterion. All testing sessions were exactly 600 or 800 trials long and were completed in full.
Effects of Image Novelty and Image Manipulation
Novel image tests.
Each individual animal transferred their classification behavior to novel images, performing significantly more accurately than expected by chance (Table 1). All but one orangutan and one monkey performed significantly worse on transfer trials with novel images than on trials with familiar images (Table 2, first row for each individual). Thus, although repeated experience with the familiar images during training increased accuracy, all animals transferred classification to novel images. The pattern of incomplete transfer was generally observed for all transfer tests that follow (Table 2, Figure 3). The level of transfer observed in this first transfer test, which involved novel images that had not been modified, sets a baseline against which to compare performance in the subsequent transfer tests with images that were both novel and modified.
Table 1.
Binomial tests comparing accuracy to chance by subject and transfer type
| Subject | Test Type | Proportion Correct (chance = 0.25) | p-value (2-tailed binomial) |
|---|---|---|---|
| M (Ape) | Novel Images | 0.74 | <0.001 |
| Black and White | 0.53 | <0.001 | |
| Line | N/A | N/A | |
| Scrambled | 0.41 | <0.001 | |
| Novel 2 | 0.67 | <0.001 | |
| S (Ape) | Novel Images | 0.46 | <0.001 |
| Black and White | 0.55 | <0.001 | |
| Line | 0.34 | 0.006 | |
| Scrambled | 0.44 | <0.001 | |
| Novel 2 | 0.58 | <0.001 | |
| T (Monkey) | Novel Images | 0.80 | <0.001 |
| Black and White | 0.68 | <0.001 | |
| Line | 0.68 | <0.001 | |
| Scrambled | 0.62 | <0.001 | |
| Novel 2 | 0.87 | <0.001 | |
| W (Monkey) | Novel Images | 0.70 | <0.001 |
| Black and White | 0.77 | <0.001 | |
| Line | 0.51 | <0.001 | |
| Scrambled | 0.58 | <0.001 | |
| Novel 2 | 0.85 | <0.001 | |
| G (Monkey) | Novel Images | 0.77 | <0.001 |
| Black and White | 0.62 | <0.001 | |
| Line | 0.45 | <0.001 | |
| Scrambled | 0.55 | <0.001 | |
| Novel 2 | 0.72 | <0.001 | |
| B (Monkey) | Novel Images | 0.80 | <0.001 |
| Black and White | 0.62 | <0.001 | |
| Line | 0.49 | <0.001 | |
| Scrambled | 0.54 | <0.001 | |
| Novel 2 | 0.75 | <0.001 |
Table 2.
Chi-square tests comparing accuracy with modified images to that with familiar images for each transfer test
| Subject | Test Type | chi square, df =1 | p-value (2-tailed) |
|---|---|---|---|
| M (Ape) | Novel Images | 0.004 | n.s. |
| Black and White | 21.35 | <0.001 | |
| Line | N/A | N/A | |
| Scrambled | 43.21 | <0.001 | |
| Novel 2 | 0.267 | n.s. | |
| S (Ape) | Novel Images | 10.57 | 0.001 |
| Black and White | 23.77 | <0.000 | |
| Line | 52.58 | <0.001 | |
| Scrambled | 27.99 | <0.002 | |
| Novel 2 | 4.67 | 0.03 | |
| T (Monkey) | Novel Images | 5.75 | 0.02 |
| Black and White | 82.81 | <0.001 | |
| Line | 69.98 | <0.001 | |
| Scrambled | 127.79 | <0.001 | |
| Novel 2 | 22.60 | <0.001 | |
| W (Monkey) | Novel Images | 3.16 | n.s. |
| Black and White | 42.61 | <0.001 | |
| Line | 90.48 | <0.001 | |
| Scrambled | 109.92 | <0.001 | |
| Novel 2 | 9.77 | .003 | |
| G (Monkey) | Novel Images | 7.18 | 0.007 |
| Black and White | 25.45 | <0.001 | |
| Line | 92.09 | <0.001 | |
| Scrambled | 36.1 | <0.001 | |
| Novel 2 | 3.94 | n.s. | |
| B (Monkey) | Novel Images | 5.79 | 0.02 |
| Black and White | 46.1 | <0.001 | |
| Line | 79.32 | <0.001 | |
| Scrambled | 39.81 | <0.001 | |
| Novel 2 | 0.87 | n.s. |
Figure 3.
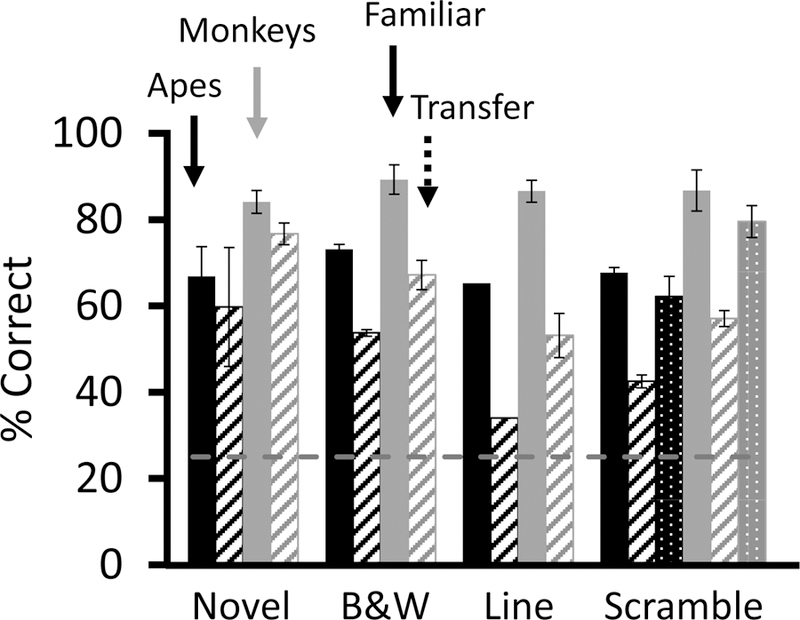
Average accuracy across test types. The black bars depict results from orangutans; the gray bars depict results from monkeys. The solid bars represent accuracy with familiar images presented in transfer sessions, and the striped bars represent accuracy with the novel transfer images. In Novel tests, animals classified novel images. In B&W tests, new novel images were color desaturated. In Line tests, animals classified novel images that had been converted to line drawings. In Scramble tests, animals classified both intact novel images and scrambled novel images. Accuracy with intact novel images are represented by dotted bars. Chance performance is indicated by the dashed line. Error bars represent the standard error of the mean.
Black and white image tests.
Each individual was significantly more accurate than expected by chance in transfer to black and white images (Table 1, second row for each subject). Accuracy with novel black and white images was lower than with familiar images (Table 2, second row for each subject; Figure 3). To determine the extent to which this decrement was due to the desaturation of the images or to the introduction of novel images, we compared accuracy in the initial transfer to novel images to that with novel desaturated images. Animals were not significantly less accurate with novel desaturated images than with novel intact images (t(5) = 1.64, p = 0.16), indicating that color is not critical for classification.
Line image tests.
All monkeys were significantly more accurate than expected by chance in transfer to line drawings (Table 1, third row for each subject). All monkeys were significantly less accurate with line drawings than with familiar images (Table 2, third row for each subject; Figure 3). The one orangutan tested also performed significantly above chance (Table 1), but significantly less well than with familiar images (Table 2). Subjects were significantly less accurate in the line drawing transfer test than in the novel transfer tests (t(4) = 4.8, p = 0.009), indicating that fill pattern is important for classification.
Scrambled image tests.
Each individual was significantly more accurate than expected by chance in transfer to scrambled images (Table 1, fourth row for each subject), but significantly lower on scrambled images than on familiar images (Table 2, fourth row for each subject; Figure 3). Animals were significantly less accurate in the scrambled transfer tests than in the novel transfer test (t(5) = 4.3, p = 0.008), indicating that the global structure of images is important for classification. In the scrambled image test, intact novel unmodified images were also embedded (Figure 3; Tables 1 and 2, fifth row for each subject). Performance on the first transfer set with novel images was not significantly different than performance with novel images in this final set of trials (t(5) = 0.7, p = 0.52). Because accuracy with novel images was stable across time, comparing all transfer tests to performance on the first novel image test is an appropriate control to subtract the contribution of novelty alone from that of both novelty and the manipulations of color, texture, and shape.
We also determined the five images most commonly classified incorrectly by each subject. Two images appeared in this set for all six subjects. Both were pictures of humans that were rotated 90 degrees from vertical. These images were most commonly classified as flowers. Additionally, one flower image was similarly rotated, and this image was most commonly mistaken in both orangutans and two monkeys as a fish. This finding suggests that one factor determining the classification response of subjects was the longitudinal axis of the stimuli (Cook, Wright, & Drachman, 2013). The fact that both monkeys and orangutans were subject to this error emphasizes the similarity in the control of their classification.
Monkeys and orangutans performed qualitatively similarly with all image manipulations, suggesting that similar image features control classification in monkeys and orangutans. Both successfully learned to classify birds, fish, flowers, and people. They generalized when the images were considerably manipulated, but showed performance decrements compared to the intact images with which they had prior experience. They also showed greater decrements in accuracy to the line drawings and scrambled images than to the unmodified novel images. This finding suggests that, in monkeys and apes, classification is controlled by at least two stimulus dimensions: the drop in accuracy on the line drawing transfer tests indicates that fill pattern or texture are features that contribute to classification; similarly, the drop in accuracy with scrambled images demonstrates that global features such as shape and contour contribute to classification. Local features seemed to control classification in the scrambled condition because subjects continued to perform significantly above chance.
It is important to note that scrambling did not eliminate all structural features of the stimuli, but it did result in the disruption of larger, and the preservation of smaller, structural features. It is commonly observed that face perception and identification depend on configural processing of the relations among facial features (Adachi, Chou, & Hampton, 2009; Parr et al., 2000; Rhodes, Brake, Taylor, & Tan, 1989). Expertise with other types of stimuli may also be associated with configural processing (Gauthier, Tarr, Anderson, Skudlarski, & Gore, 1999; Rhodes et al., 1989).
In this study, scrambling disrupted both the contours and the configuration of features in the images presented. It is possible that our subjects had sufficient experience with these types of images to be “experts” and therefore for their classification to be disrupted by manipulation of the configurations of features as well as contours. Further work, such as conducting tests with inverted images, would be required to assess this hypothesis. Although we cannot determine with certainty whether the performance of our subjects was disrupted mainly by changes in contours or by changes in configurations of features, the finding that both monkeys and orangutans were similarly affected reinforces the conclusions that they process the images similarly.
Because the order of testing with each type of manipulation was not counterbalanced across subjects, it is also possible that the drop in performance on line drawing tests and scrambled image tests was a result of an order effect. However, performance in the final novel image condition was not different from performance on the first novel image condition, suggesting that the image manipulations were driving the performance decrement rather than the order of task presentation. These findings indicate that monkeys and apes use both global and local features to classify images; when one feature is not available, they can use another feature to classify successfully.
It is possible that even though many different stimuli were used—for example, fish in the water and fish on a plate—cues like the blue water surrounding most fish images may have partly controlled responding. Both birds and fish might often be surrounded by blue, yet subjects were able to accurately classify both types of images. Additionally, we found that desaturation did not significantly affect classification performance, indicating that color was not a unique determinant of choice. This result is consistent with some previous work with orangutans (Vonk & MacDonald, 2004), but in contrast to other work with orangutans (Marsh & MacDonald, 2008). It is possible that the extent to which color controls classification depends on the specific stimuli used and the particular categories trained. Different samples of category exemplars may facilitate control by different stimulus dimensions. Here, we used a fairly large set of exemplars from four separate categories, and this factor may have contributed to control by global shape and texture. In other samples of images, color may exert stronger control (see D’Amato & Van Sant, 1988; Marsh & MacDonald, 2008), but in no case does color seem to be the only feature controlling classification. Of course, we can determine that some types of information do not control of classification, but that is not the same thing as determining precisely what information does control classification.
Our results suggest that classification is controlled similarly in monkeys and orangutans, but the qualitative similarity we observed does not rule out more subtle quantitative differences. Monkeys learned more readily than the orangutans, and were numerically more accurate in the transfer tests.
Unfortunately, several features of this study prevented us from conducting strong quantitative comparisons of the species. First, orangutans were not able to reach the 80% accuracy criterion set for monkeys. The relatively poor performance by orangutans on this task may have been due to different testing conditions or motivation. In accordance with the zoo husbandry schedule, orangutans were often fed immediately before testing. In contrast, monkeys had ad libitum access to food, but feeding times did not so directly correspond with testing time. Second, because they lived in a research colony, monkeys had continuous access to the task, whereas the orangutans experienced concentrated bouts of testing opportunities. Additionally, orangutans and monkeys used the same size touchscreens. Although it is possible that the relatively large hands and fingers of the orangutans resulted in registering more “accidental” touches by this species, this possibility is not likely because the choice stimuli were located on the far corners of the screen, well away from each other, plus we required two consecutive touches to a particular image to register as a choice.
It is also important to note that one of our orangutans was fully mature at 29 years old and the other was not yet fully mature at 9 years old. Their different developmental stages could have led to some of the observed individual differences. Additionally, all monkey subjects were juveniles and may perform this task differently than would adult rhesus monkeys. Nonetheless, we saw convergence of results across individuals. One ape and two monkeys did not show a significant decrement in performance on the second set of novel images, whereas two monkeys and one ape did show a decrement. Given these observations, it appears that the behavior of some individuals was controlled by different sources of information than others at this point in the study; but, on the whole, the performance of all animals was strikingly similar. Finally, we were not able to reliably test more than two orangutans, yielding insufficient power for strong quantitative comparisons. Ideally, these limitations can be addressed in future work.
These results suggest that classification of complex visual stimuli in nonhuman primates may be different than in pigeons, in that primate classification appears to be controlled by both local and global cues. Classification in pigeons seems to be more readily controlled by local features than by global form (Aust & Braunöder, 2015; Aust & Huber, 2001; Cavoto & Cook, 2001). Pigeons trained to discriminate images with people from images without people performed these discriminations accurately even when familiar images were highly scrambled at test (Aust & Huber, 2001), indicating control by local features that are not disrupted by scrambling. Pigeons failed to generalize discrimination when trained on blurred images that have global form information, but lack local information (Aust & Braunöder, 2015). However, under some circumstances, discrimination in pigeons can be controlled by global features (Goto, Wills, & Lea, 2004; Lea et al., 2013; Lea, Poser-Richet, & Meier, 2015; see Wasserman & Biederman, 2012 for a comprehensive review with line drawings and computer rendered stimuli) perhaps especially when these features are highly salient and the individual local features are presented closely together rather than spread out (Goto et al., 2004). Together these results suggest that global features may more readily control primate classification compared to avian classification. However, more direct comparisons between birds and primates are required to definitively make this determination.
To conclude, our research suggests that monkeys and orangutans classified visual images using at least two sources of information: global shape and more local texture. Reliable classification persisted when either of these features was degraded, albeit at lower levels of accuracy than with the original training images. These initial comparative findings indicate that classification in rhesus monkeys and orangutans is similarly controlled; yet, additional studies using larger samples and even closer matching of training and testing conditions will be required to definitely determine the extent to which monkeys and apes see the world the same way.
Acknowledgments
This work was supported by Zoo Atlanta and by National Science Foundation awards BCS-0745573 and IOS-1146316 to Robert R. Hampton. We thank Kimberly Burke and Meghan Sosnowski for help testing subjects, the Zoo Atlanta primate staff for their support.
References
- Adachi I, Chou DP, & Hampton RR (2009). Thatcher Effect in Monkeys Demonstrates Conservation of Face Perception across Primates. Current Biology, 19(15), 1270–1273. doi: DOI 10.1016/j.cub.2009.05.067 [DOI] [PMC free article] [PubMed] [Google Scholar]
- Aron A, & Aron E (1999). Statistics for psychology Upper Saddle River, NJ: Prentice Hall. [Google Scholar]
- Aust U, & Braunöder E (2015). Transfer between local and global processing levels by pigeons (Columba livia) and humans (Homo sapiens) in exemplar-and rule-based categorization tasks. Journal of Comparative Psychology, 129(1), 1. [DOI] [PubMed] [Google Scholar]
- Aust U, & Huber L (2001). The role of item- and category-specific information in the discrimination of people versus nonpeople images by pigeons. Animal Learning & Behavior, 29(2), 107–119. [Google Scholar]
- Basile BM, & Hampton RR (2013). Monkeys show recognition without priming in a classification task. Behavioural Processes, 93, 50–61. [DOI] [PMC free article] [PubMed] [Google Scholar]
- Bhatt RS, Wasserman EA, Reynolds WF, & Knauss KS (1988). Conceptual behavior in pigeons: Categorization of both familiar and novel examples from four classes of natural and artificial stimuli. Journal of Experimental Psychology: Animal Behavior Processes, 14(3), 219–234. [Google Scholar]
- Brown DA, & Boysen ST (2000). Spontaneous discrimination of natural stimuli by chimpanzees (Pan troglodytes). J Comp Psychol, 114(4), 392–400. [DOI] [PubMed] [Google Scholar]
- Cavoto KK, & Cook RG (2001). Cognitive precedence for local information in hierarchical stimulus processing by pigeons. Journal of Experimental Psychology: Animal Behavior Processes, 27(1), 3. [PubMed] [Google Scholar]
- Close J, & Call J (2015). From colour photographs to black-and-white line drawings: an assessment of chimpanzees’ (Pan troglodytes’) transfer behaviour. Animal Cognition, 18(2), 437–449. doi: 10.1007/s10071-014-0813-5 [DOI] [PubMed] [Google Scholar]
- Cook RG, Wright AA, & Drachman EE (2013). Categorization of birds, mammals, and chimeras by pigeons. Behavioural Processes, 93, 98–110. [DOI] [PMC free article] [PubMed] [Google Scholar]
- D’Amato MR, & Van Sant P (1988). The person concept in monkeys (Cebus apella). Journal of Experimental Psychology: Animal Behavior Processes, 14(1), 43–55. [DOI] [PubMed] [Google Scholar]
- Fagot J, & Tomonaga M (1999). Global and local processing in humans (Homo sapiens) and chimpanzees (Pan troglodytes): Use of a visual search task with compound stimuli. Journal of Comparative Psychology, 113(1), 3–12. doi: 10.1037/0735-7036.113.1.3 [DOI] [Google Scholar]
- Finstermeier K, Zinner D, Brameier M, Meyer M, Kreuz E, Hofreiter M, & Roos C (2013). A Mitogenomic Phylogeny of Living Primates. Plos One, 8(7), e69504. doi: 10.1371/journal.pone.0069504 [DOI] [PMC free article] [PubMed] [Google Scholar]
- Gauthier I, Tarr MJ, Anderson AW, Skudlarski P, & Gore JC (1999). Activation of the middle fusiform ‘face area’ increases with expertise in recognizing novel objects. Nature Neuroscience, 2(6), 568–573. doi: 10.1038/9224 [DOI] [PubMed] [Google Scholar]
- Gazes RP, Brown EK, Basile BM, & Hampton RR (2013). Automated cognitive testing of monkeys in social groups yields results comparable to individual laboratory-based testing. Animal Cognition, 16(3), 445–458. [DOI] [PMC free article] [PubMed] [Google Scholar]
- Ghosh N, Lea SE, & Noury M (2004). Transfer to intermediate forms following concept discrimination by pigeons: chimeras and morphs. Journal of the Experimental Analysis of Behavior, 82(2), 125–141. [DOI] [PMC free article] [PubMed] [Google Scholar]
- Goto K, Wills AJ, & Lea SE (2004). Global-feature classification can be acquired more rapidly than local-feature classification in both humans and pigeons. Animal Cognition, 7(2), 109–113. [DOI] [PubMed] [Google Scholar]
- Hayes KJ, & Nissen CH (1971). Higher mental functions of a home raised → chimpanzee. In Schrier AM & Stollnitz F (Eds.), Behavior of nonhuman →primates (Vol. 4, pp. 59–115). New York: Academic Press. [Google Scholar]
- Herrnstein RJ, & Loveland DH (1964). Complex visual concept in the pigeon. Science, 146(3643), 549–551. [DOI] [PubMed] [Google Scholar]
- Jitsumori M, & Matsuzawa T (1991). Picture perception in monkeys and pigeons: Transfer of rightside-up versus upside-down discrimination of photographic objects across conceptual categories. Primates, 32(4), 473–482. [Google Scholar]
- Jitsumori M, & Yoshihara M (1997). Categorical discrimination of human facial expressions by pigeons: A test of the linear feature model. The Quarterly Journal of Experimental Psychology: Section B, 50(3), 253–268. [Google Scholar]
- Koba R, & Izumi A (2006). Sex categorization of conspecific pictures in Japanese monkeys (Macaca fuscata). Animal Cognition, 9(3), 183–191. [DOI] [PubMed] [Google Scholar]
- Lea SEG, De Filippo G, Dakin R, & Meier C (2013). Pigeons use low rather than high spatial frequency information to make visual category discriminations. Journal of Experimental Psychology: Animal Behavior Processes, 39(4), 377–382. doi: 10.1037/a0033104 [DOI] [PubMed] [Google Scholar]
- Lea SEG, Poser-Richet V, & Meier C (2015). Pigeons can learn to make visual category discriminations using either low or high spatial frequency information. Behavioural Processes, 112(0), 81–87. doi: 10.1016/j.beproc.2014.11.012 [DOI] [PubMed] [Google Scholar]
- Marsh HL, & MacDonald SE (2008). The use of perceptual features in categorization by orangutans (Pongo abelli). Animal Cognition, 11(4), 569–585. [DOI] [PubMed] [Google Scholar]
- Martin-Malivel J, & Fagot J (2001). Perception of pictorial human faces by baboons: Effects of stimulus orientation on discrimination performance. Animal Learning & Behavior, 29(1), 10–20. [Google Scholar]
- Martin-Malivel J, Mangini MC, Fagot J, & Biederman I (2006). Do humans and baboons use the same information when categorizing human and baboon faces? Psychological Science, 17(7), 599–607. [DOI] [PubMed] [Google Scholar]
- Parr LA, Winslow JT, Hopkins WD, & de Waal F (2000). Recognizing facial cues: individual discrimination by chimpanzees (Pan troglodytes) and rhesus monkeys (Macaca mulatta). Journal of Comparative Psychology, 114(1), 47. [DOI] [PMC free article] [PubMed] [Google Scholar]
- Rhodes G, Brake S, Taylor K, & Tan S (1989). Expertise and configural coding in face recognition. British Journal of Psychology, 80(3), 313–331. [DOI] [PubMed] [Google Scholar]
- Roberts WA, & Mazmanian DS (1988). Concept learning at different levels of abstraction by pigeons, monkeys, and people. Journal of Experimental Psychology: Animal Behavior Processes, 14(3), 247. [Google Scholar]
- Schluessel V, & Duengen D (2015). Irrespective of size, scales, color or body shape, all fish are just fish: object categorization in the gray bamboo shark Chiloscyllium griseum. Animal Cognition, 18(2), 497–507. doi: 10.1007/s10071-014-0818-0 [DOI] [PubMed] [Google Scholar]
- Schrier AM, Angarella R, & Povar ML (1984). Studies of concept formation by stumptailed monkeys: Concepts humans, monkeys, and letter A. Journal of Experimental Psychology: Animal Behavior Processes, 10(4), 564–584. [Google Scholar]
- Schrier AM, & Brady PM (1987). Categorization of natural stimuli by monkeys (Macaca mulatta): Effects of stimulus set size and modification of exemplars. Journal of Experimental Psychology: Animal Behavior Processes, 13(2), 136–143. [PubMed] [Google Scholar]
- Spencer J, Quinn PC, Johnson MH, & Karmiloff‐Smith A (1997). Heads you win, tails you lose: Evidence for young infants categorizing mammals by head and facial attributes. Early Development and Parenting, 6(3‐4), 113–126. [Google Scholar]
- Vonk J, & Galvan M (2014). What do natural categorization studies tell us about apes and bears? Animal Behavior & Cognition, 1, 309–330. [Google Scholar]
- Vonk J, Jett SE, & Mosteller KW (2012). Concept formation in American black bears, Ursus americanus. Animal Behaviour, 84(4), 953–964. [Google Scholar]
- Vonk J, Jett SE, Mosteller KW, & Galvan M (2013). Natural category discrimination in chimpanzees (Pan troglodytes) at three levels of abstraction. Learning & Behavior, 41(3), 271–284. [DOI] [PubMed] [Google Scholar]
- Vonk J, & MacDonald SE (2002). Natural concepts in a juvenile gorilla (Gorilla gorilla gorilla) at three levels of abstraction. Journal of the Experimental Analysis of Behavior, 78(3), 315–332. [DOI] [PMC free article] [PubMed] [Google Scholar]
- Vonk J, & MacDonald SE (2004). Levels of abstraction in orangutan (Pongo abelii) categorization. Journal of Comparative Psychology, 118(1), 3–13. [DOI] [PubMed] [Google Scholar]
- Wasserman EA, & Biederman I (2012). Recognition by components: A bird’s eye view. In Lazareva OF, Shimizu T, & Wasserman EA (Eds.), How animals see the world New York: Oxford University Press. [Google Scholar]
- Wasserman EA, Kiedinger RE, & Bhatt RS (1988). Conceptual behavior in pigeons: Categories, subcategories, and pseudocategories. Journal of Experimental Psychology: Animal Behavior Processes, 14(3), 235. [Google Scholar]
- Zentall TR, Wasserman EA, Lazareva OF, Thompson RK, & Rattermann MJ (2008). Concept learning in animals. Comparative Cognition & Behavior Reviews, 3, 13–45. [Google Scholar]