

Abstract
The calcium pump of the sarcoplasmic reticulum (SERCA) is an ATP-driven active transporter of Ca2+ ions that functions via an “alternating-access” cycle mechanism. In each cycle, SERCA transports two Ca2+ ions toward the lumen of the sarcoplasmic reticulum, and 2–3 protons to the cytoplasm. How the latter conformational transition is coupled to cytoplasmic release of protons remains poorly understood. The present computational study shows how the mechanism of proton countertransport is coupled to the alternating access gating process in SERCA. Molecular dynamics simulation trajectories are generated starting from a series of configurations taken along the E2 to E1 transition pathway determined by the string method with swarms-of-trajectories. Simulations of different protonation configurations at the binding sites reveal how deprotonation events affect the opening of the cytoplasmic gate. The results show that there is a strong coupling between the chronological order of deprotonation, the entry of water molecules into the TM region, and the opening of the cytoplasmic gate. Deprotonation of E309 and E771 is sequential with E309 being the first to lose the proton. The deprotonation promotes the opening of the cytoplasmic gate, but leads to a productive gating transition only if it occurs after the transmembrane domain has reached an intermediate conformation. Deprotonation of E309 and E771 is unproductive when it occurs too early because it causes the re-opening of the luminal gate.
Keywords: SERCA, Ion Pumps, Proton Transport, Conformational Transition, Molecular Dynamics Simulation, String Method
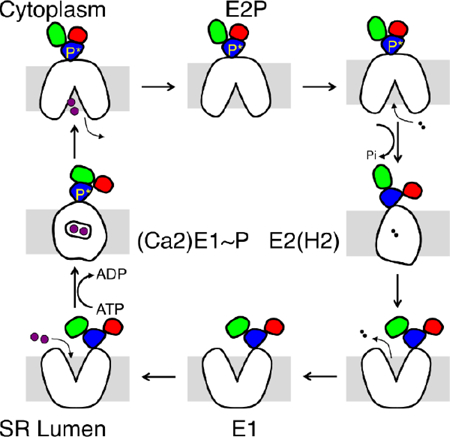
Graphical Abstract
INTRODUCTION
The calcium pump of the sarcoplasmic reticulum (SERCA) is an ATP-driven active transporter of Ca2+ ions. It functions via the Albers-Post “alternating-access” cycle mechanism [1, 2], iterating between two major conformations, E1 and E2 as shown in Figure 1A. SERCA has been extensively characterized structurally by X-ray crystallography. There are several high-resolution structures of SERCA, covering almost all the functional states along the pumping cycle [3–6]. As shown in Figure 1B, the structure comprises 994 amino acid residues organized in a transmembrane domain with ten transmembrane (TM) helices M1–M10 and three cytoplasmic domains including the nucleotide binding domain (N), the phosphorylation domain (P), and the actuator domain (A). The selective Ca2+ binding sites are located within the helix bundle formed by M4, M5, M6, and M8 (Figure 1B). The set of available X-ray structures essentially shows in broad strokes how phosphorylation and dephosphorylation of the protein mediate the large-scale motions required for active transport. Based on these high-resolution structures, considerable computational efforts have been carried out to further our understanding of SERCA’s transport mechanism [7–12].
Figure 1.
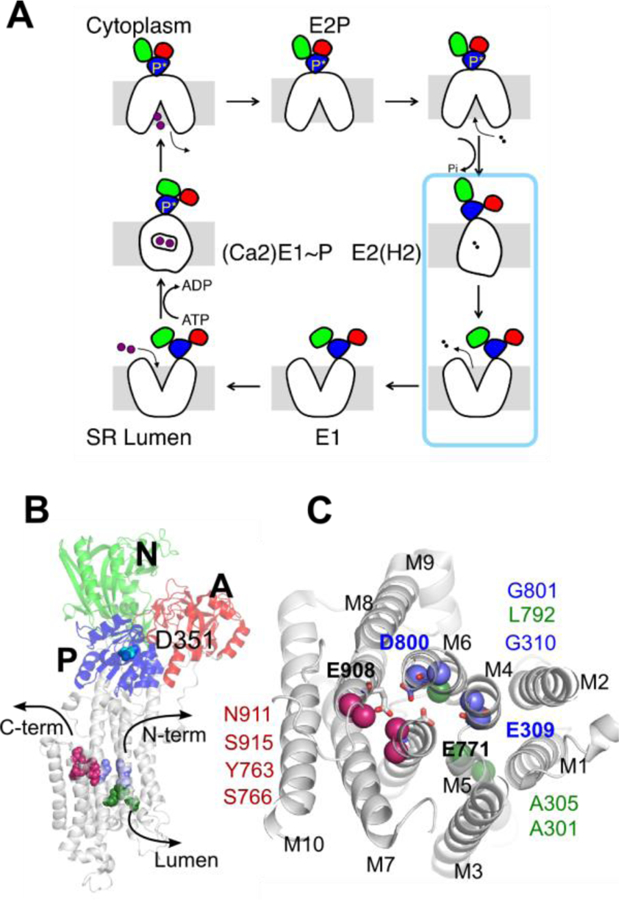
(A) “Alternating-access” pump cycle. The blue box indicates the transition of interest in the current study. (B) The structure of the SERCA pump in its E2P state shown in cartoon representation. The three cytoplasmic domains are labeled with different letters A (red), N (green), and P (blue). The N-terminal, C-terminal, and luminal water pathways are shown with arrows. The cytoplasmic side is on the top and the luminal side is on the bottom. (C) Cytoplasmic view of the water channels in the TM region. Residues used to define the water access channels are shown in spheres and their residues IDs are given. The binding site titratable residues are shown in stick presentation and the residue names are in bold. In the E2 state, the protonated residues include E309, E771, and E908. The residues that lose the proton during the E2 to E1 transition are E309 and E771.
In each cycle, SERCA binds two Ca2+ ions from the calcium-poor cytoplasm of the muscle cell and transports them to the calcium-rich lumen of the sarcoplasmic reticulum. Assuming the cycle starts at state E1, when the pump is in this state, both the ATP binding site in the N domain and the Ca2+ binding sites are accessible to the cytoplasm ready for substrate binding. Once ATP and Ca2+ are bound to the protein, the γ-phosphate of ATP is transferred to D351, a conserved residue located in the cytoplasmic P domain, triggering a large conformational change toward the state E2P. This opens up the luminal gate to allow the release of the two Ca2+ ions. Following the binding of 2 protons to the titratable residues at the binding sites, the luminal gate closes, leading to the dephosphorylation of the D351. This is followed by a structural rearrangement of the cytoplasmic domains and of the TM region, during which the protons leave the binding sites to go toward the cytoplasmic side. Afterwards, the pump returns to the state E1 with an open cytoplasmic gate, ready for the next cycle [13–17].
An important aspect of the final transition from the state E2 to the state E1 is the release of protons to the cytoplasm. In the early 1980’s, Inesi and Hill studied the pH dependence of SERCA activity in native sarcoplasmic reticulum vesicles [18, 19]. However, due to the passive permeation of protons across the SR membrane, it was difficult to obtain strong evidence regarding the proton transport mediated by SERCA. Later, it was demonstrated, from experiments based on reconstituted proteoliposomes monitoring the transmembrane electrical potential and the alkalinization of the lumen, that SERCA transports protons in the opposite direction of Ca2+ with an 1:1 ratio [20, 21]. Analyzing proteolytic digestion patterns under various conditions, Inesi et al [22] observed that raising the pH shifts the digestion pattern from the state E2 to the state E1 for the wild-type pump but not for the E309Q mutant, indicating that deprotonation of this residue is critical for the E2-E1 transition. On the basis of a crystallographic structure, Obara et al [7] suggested that titratable side chains in the binding sites were protonated in the E2 state, partly to compensate for the charge imbalance caused by the absence of bound Ca2+. Continuum electrostatic pKa computations based on the crystal structure has also predicted that residues E309, E771, D800, and E908 are protonated when the pump is in its occluded E2 state [7, 23]. However, only E908 out of the four titratable residues is supposed to be protonated when the pump is in the Ca2+-loaded E1 state [7, 8]. This implies that proton dissociation has to occur during the E2 to E1 transition. Previous studies, both experimental and computational, have also indicated that the deprotonation of E309 and E771 is sequential [22, 24–26], similar to that of cytoplasmic Ca2+ binding [27] and of luminal Ca2+ dissociation [28].
While these previous studies have provided great insight into the protonation of residues in the E2 state, many important questions remain unanswered regarding the mechanism of proton countertransport and how it is coupled to the conformational transition toward the E1 state. For instance, whether the structural rearrangements of the transmembrane helices actually proceed or follow the deprotonation events is unclear. At a more basic level, which of these conformational changes cause proton movements and which ones are actually caused by proton movements are unknown. To answer such question, it is necessary to gain knowledge of the system’s time-course during the conformational transition, i.e., literally “visualize” how the pump moves and changes its shape at the atomic level while it goes from the E2 to the E1 state, releasing protons to the cytoplasm. Only recently has the determination of detailed macromolecular conformational transition pathways in large biomolecular systems such as SERCA become possible thanks to computational advances combining the string method with all-atom molecular dynamics (MD) simulations [12]. The string method [29–31] represents the conformational transition pathway as a sequence of structural snapshots, or “chain-of-states”, connecting two end-point states corresponding to the known crystal structures. We have previously used this computational approach to determine detailed atomic pathways of key conformational transitions along the pump cycle of SERCA, revealing the chronological order of the microscopic events occurring along these transitions [12].
While our previous study of SERCA focused on several key macromolecular conformational transition pathways along the pump cycle, the E2-E1 transition was not analyzed in detail because the counter-transport of protons associated with this transition require special considerations. Fundamentally, protonation/deprotonation events involve the breaking and formation of chemical bonds, which is beyond the scope of MD simulations based on classical molecular mechanical force fields. Nonetheless, an approach based on the string method and classical MD simulations can still be exploited to determine the macromolecular conformational pathway for the E2-E1 transition for fixed protonation states. The latter can then be used to elucidate the timing and order of the deprotonation events along the E2-E1 transition by generating additional unbiased MD trajectories based on the assumption that the deprotonation events themselves occur suddenly, on a very fast timescale compared to the overall protein conformational transition. In practice, this is accomplished by picking instantaneous configurations taken along the string pathway of the E2-E1 transition [12], and then carrying out unbiased MD simulations assuming different protonation of the binding sites to examine how the changes affect the opening of the cytoplasmic gate. The present results obtained within this computational framework suggest that there is a strong coupling between the chronology of deprotonation, the entry of water molecules into the TM region, and the opening of the cytoplasmic gate. Deprotonation of E309 and E771 promotes the opening of the cytoplasmic gate, but leads to a productive gating transition only if it occurs after the transmembrane domain has reached an intermediate conformation. Deprotonation of E309 and E771, when occurring too early, is essentially unproductive as it causes the re-opening of the luminal gate.
RESULTS AND DISCUSSION
Protonation of the binding sites in E2
E2 is the starting state of the transition. There are several crystal structures of SERCA in the Ca2+-free E2 states available (Table 1). It is necessary to choose the best and most relevant structure for resolving the timing of deprotonation during the E2-E1 transition. Among the available crystal structures, only a few have resolution higher than 3.0 Å including 3W5C [32]. They are given priority. Many of these structures have exogenous ligands bound, for example, TG1 and BHG, both of which are known inhibitors of the pump and could be locking the pump structure into a state that is outside of the native transport cycle, even though no clear trend is observed in the pKa values of binding site residues upon the binding of these inhibitors. Interestingly, the binding of nucleotide or its mimetic at the phosphorylation site slightly elevates the pKa of D800 (Figure S1). Without any nucleotides, the pKa of D800 spans a range between 6.8 and 8.2 while this range becomes 7.2 to 11.1 when nucleotides are present. It is not clear, however, if this is due to the lack of meaningful statistics. Nevertheless, the only E2 structure without any ligands is 3W5C with a high resolution of 2.5 Å. It represents a dephosphorylated, occluded state of E2. Therefore, it was used in the E2-E1 transition pathway calculations, which are the basis of the current simulation study.
Table 1.
pKa values of binding site glutamates and aspartates. The numbers in the parentheses represent the pKa values from the other chain in the crystal structure unit cell. The program PROPKA3.1 [33] is used to compute the pKa values of the titratable residues.
| Resolution (Å) | Nucleotide | Ligand | E309 | E771 | D800 | E908 | |
|---|---|---|---|---|---|---|---|
| 1IWO | 3.1 | None | TG1 | 6.4(6.4) | 10.8(10.8) | 6.8(6.8) | 10.1(10.1) |
| 2AGV | 2.4 | None | TG1,BHQ | 9.0(9.0) | 10.9(10.9) | 8.2(8.2) | 9.7(9.8) |
| 2BY4 | 3.3 | AMPPCP | AD4 | 9.8 | 11.6 | 7.5 | 9.5 |
| 2C88 | 3.1 | AMPPCP | TG1 | 9.4 | 10.7 | 7.2 | 10.0 |
| 2C8K | 2.8 | AMPPCP | TG1 | 9.0 | 10.5 | 7.8 | 10.0 |
| 2C8L | 3.1 | None | TG1 | 9.2 | 10.7 | 7.9 | 10.0 |
| 2DQS | 2.5 | AMPPCP | TG1 | 8.6 | 9.7 | 8.2 | 10.3 |
| 2EAR | 3.1 | None | TG1 | 8.3 | 10.5 | 8.0 | 9.9 |
| 2EAT | 2.9 | None | TG1,CZA | 8.7 | 10.3 | 7.0 | 11.6 |
| 2EAU | 2.8 | None | CZA | 9.7 | 10.8 | 7.2 | 9.6 |
| 2YFY | 3.1 | None | 9TN | 9.4 | 11.4 | 7.6 | 9.6 |
| 3AR3 | 2.3 | ADP | TG1 | 9.1 | 10.9 | 7.8 | 9.8 |
| 3AR4 | 2.15 | ATP | TG1 | 9.0 | 10.9 | 8.3 | 9.9 |
| 3AR5 | 2.2 | TM1 | TG1 | 8.9 | 10.9 | 8.2 | 9.8 |
| 3AR6 | 2.2 | 12D | TG1 | 8.9 | 10.9 | 8.0 | 10.0 |
| 3AR7 | 2.15 | 128 | TG1 | 8.9 | 10.8 | 7.8 | 9.7 |
| 3FPS | 3.2 | ADP | CZA | 11.3 | 9.4 | 11.1 | 7.4 |
| 3NAL | 2.65 | None | DBK | 9.1 | 10.8 | 7.5 | 10.2 |
| 3NAM | 3.1 | None | OTK | 8.6 | 10.8 | 7.3 | 10.2 |
| 3NAN | 3.1 | None | HZ1 | 8.9 | 10.8 | 8.0 | 10.1 |
| 3W5C | 2.5 | None | None | 9.7 | 11.1 | 7.3 | 9.4 |
| 4UU0 | 2.5 | TBU,SO4 | TG1 | 9.3 | 11.2 | 7.9 | 9.7 |
| 4UU1 | 2.8 | AMPPCP | TG1 | 8.6 | 11.0 | 7.3 | 9.8 |
| 4YCL | 3.3 | None | CZA | 9.2 | 11.2 | 7.7 | 10.5 |
| 4YCM | 3.2 | None | 7BS | 9.3 | 11.4 | 7.9 | 10.0 |
| 4YCN | 3.5 | None | 7BL | 10.1 | 10.8 | 7.1 | 11.1 |
| 5XAB | 3.2 | None | TG1 | 9.1 | 11.2 | 7.9 | 10.0 |
Prior to any pathway calculation, the protonation state of the binding site residues in the starting conformation has to be determined. Here, we use the program PROPKA3.1 [33] to compute the pKa values of the titratable residues at the ion binding sites and assign their protonation states. Table 1 shows the pKa values of these residues. Based on the pKa values in 3W5C, all four of the residues are protonated. Caution though, should be given to the protonation state assignment of D800 because its estimated pKa is close to 7. As pointed out previously, in cases where empirical methods predicting a pKa value at ~7, additional calculations are needed for accurate protonation state prediction [34]. A pKa value of 7 also indicates that there is an equal partition between the protonated and deprotonated forms of the acid at neutral pH. Previous MD simulations of the E2P state suggested that protonation of D800 greatly accelerated the release of the two bound Ca2+ ions [12] Nonetheless, whether D800 remains deprotonated during these steps cannot strictly be ruled out. Simulations of the E2 state carried out with D800 either protonated (E2_SYS_E800p) or deprotonated (E2_SYS) show a stable binding pocket with the bulk of the hydrogen bond network preserved as in the crystal structures (Figure 2). The average RMSD of the transmembrane region backbone atoms is 1.33 ± 0.14 Å and 1.44 ± 0.13 Å and the average RMSD of the binding site non-hydrogen atoms are 1.15 ± 0.14 Å and 1.02 ± 0.11 Å in D800 protonated and deprotonated systems respectively. Figure 3A shows the time series and the histogram distribution of the binding site heavy atom RMSD in the two simulation systems. The pKa distributions of the four titratable residues (i.e., E300, E771, D800, and E908) at the binding sites in these two simulations are shown in Figure 3B. In the D800 deprotonated system, the pKa value distributions, especially for D800 and E809, are narrow, indicating the stability of the D800 deprotonated system. The distributions of pKa values extracted from the protonated D800 trajectory are wider for both D800 and E809. In the case of D800, there is a considerable portion of the simulation snapshots with a D800 pKa value less than 7, which strongly suggests that a deprotonated configuration is the predominant state in E2. This conclusion is supported by the general observation that the pKa values of an ionizable residue estimated by PROPKA3.1 from MD snapshots is expected to be internally consistent with the protonation state assumed for this residue when generating the MD trajectory. In contrast, large fluctuations in the estimated pKa values are indicative of internal inconsistencies, yielding more uncertainty about the protonation state. In considering this information, however, it is important to keep in mind that the estimated pKa from PROPKA3.1 tends to confirm the protonation states used when generating the MD trajectory. For example, if the MD system is generated with a protonated aspartic side chain, it may tend to remain buried in the protein interior and this will, in turn, confirm the assumed protonated state. As long as the environment of an ionizable residue does not change significantly then the pKa values estimated from PROPKA3.1 should not fluctuate widely. This is an argument that also applies for the pKa analysis in the following sections.
Figure 2.

The hydrogen bond interaction network of the E2 state. Shown are from the crystal structures (A) 2AGV and (B) 3W5C of SERCA in its E2 state as well as the last snapshots of the MD simulation of the E2 state with (C) D800 deprotonated and (D) D800 protonated. The hydrogen bonds are indicated by black dashed lines.
Figure 3.

Stability of the binding sites in the simulated system SYS_E2 with protonated E309, E771, and E908 and deprotonated D800 (red) and SYS_E2_D800p with protonated E309, E771, E908 and D800 (green). (A) The running average of the binding site heavy atom RMSD and the probability distributions. The running averages are computed using a 0.2 ns window. The horizontal bars indicate the time averaged RMSD. The binding site is defined by residues: V304, E309, N768, E771, N796, D800, and E908. (B) The time series and the probability distributions of the pKa for the binding site titratable residues from the SYS_E2 and SYS_E2_D800p simulations. The pKa values are evaluated for snapshots in the trajectories using PROPKA3.1 [33].
The structural difference between the D800 protonated and deprotonated binding sites in the simulations are subtle. As in the crystal structure, hydrogen bond interactions are seen between the protonated carboxyl group of E309 and the backbone carbonyl oxygen of V304 as well as between E771 and N796 [7]. The difference lies mostly in the hydrogen bonding network patterns of D800 and E908. When D800 is deprotonated, it forms hydrogen bond interactions with Y763, S767, and E908, but once it is protonated, the interactions with Y763 and E908 are lost, resulting in a configuration that is more reminiscent of that in the crystal structures. Even though the SERCA system with protonated D800 resembles slightly more closely the crystal structures, it produces binding sites that are less hydrated as compared to the deprotonated D800. It is known that the proton on D800 has to escape at some point, possibly through a water wire reaching to the cytoplasmic side; having D800 deprotonated with a more hydrated binding pocket favors subsequent deprotonation events of other ionizable residues. Mutagenesis studies have shown that at least E309 and E771 should be protonated in E2 [22]. Other studies have also suggested a deprotonated D800 when the pump is in its E2 state [11, 25, 35]. Based on all these considerations, D800 was kept deprotonated for the following pathway calculations.
Protonating the titratable residues forming the ion binding sites (E309p, E771p, and E908p) in the occluded state E2 is intuitively appealing, as protonation presumably helps neutralize the excess negative charge in the absence of bound Ca2+. In the Ca2+-bound-E1 state, only E908 is assumed to be protonated [7, 8]. Furthermore, countertransport of one H+ per one Ca2+ was explicitly demonstrated in reconstituted systems [21]. This indicates that the stoichiometry of the Ca2+-proton transport is at least 2:2 Ca2+ to proton. However, the current study cannot rule out the possibility of 3 protons being transported, as the extra proton might involve D800, a residue that is assumed to be deprotonated even before the E2-E1 transition occurs. Even though different initial binding pocket protonation configurations could lead to slightly different conformational transition patterns, the present choice is plausible on the basis of what is mechanistically known [13, 25, 26, 35]. As shown below, the resulting sequence of events during the transition is both clear and reasonable.
Conformational transition from E2 and E1
As in our previous study of the conformational transitions along the transport cycle of SERCA [12], we used the string method with swarms-of-trajectories [30] to determine the pathway between the E2 and E1 state with the aforementioned protonation state at the binding sites. The method determines the most probable path between two metastable end states with the protein embedded in membrane with explicit solvent. The string computational pathway is represented as a sequence of snapshots or “images” connecting the E2 and E1 conformations of SERCA, allowing the visualization of this molecular process. The transition occurs after the dephosphorylation of D351. This chemical reaction essentially sends a signal to the cytoplasmic domain causing its rearrangement. From the RMSD of different structural components, it is clear that the domain motions are not homogeneous (Figure 4). Early on (image 0 to image 13), dephosphorylation of D351 leads to the rearrangements of the A and P domains. The latter also affects the placement of the transmembrane helix M2, as it is directly connected to the A domain along the sequence. From image 13 to image 21, the rearrangement of the cytoplasmic domains is temporarily paused, almost as if they were waiting for the TM to respond. During this stage, helices M1, M3, M4, and M6 begin to rearrange, but the rearrangement of M1 stops at image 21, while the other helices keep moving. At this point, the reorientation of M3–M4 probably is sufficient to cause the three cytoplasmic domains to move along as shown by the concerted RMSD of M3, M4, and the A, N, P-domains (see Figure 4 after image 21). Figure 5 and Supplementary Movies S1–S5 summarize the main structural rearrangements required for the E2-E1 transition to happen. At the end of the transition, the E1 state is reached. This structure is simulated for 50 ns, however, no cytoplasmic K+ binding was observed, likely due to the protonated binding sites.
Figure 4.

The RMSD along the computed E2 to E1 conformational transition pathway with different structural components aligned. The colors indicate different structural elements the RMSD is calculated for.
Figure 5.

Main conformational changes occurring in TM region and cytoplasmic domains during the E2-E1 transition. The dominant motions in the TM (top left), the P domain (top right), the A domain (bottom left), and the N domain (bottom right) are shown. In all four panels, the view is from the cytoplasmic side. In the top panel, the TM and P domain were aligned with respect to the M7–M10 helices. In the bottom panel, the A and N domains were aligned with respect to the P domain. The sequence of colors indicates the ordered progression of the structure for four representative image snapshots along the transition pathway: 0 (white), 13 (yellow), 21 (orange), and 31 (red). The aligned structural elements (dark grey) are indicated in bold on top of each panel. Residue Cα atoms that serve as reference points are shown in sphere presentation. The dominant motion during the E2 to E1 transition is indicated by black arrows. Supplementary Movies S1-S4 are included to display these motions more clearly; Supplementary Movie S1 displays the transition for the TM (top left); Supplementary Movie S2 displays the transition for the P domain (top right); Supplementary Movie S3 displays the transition for the A domain (bottom left); Supplementary Movie S4 displays the transition for the N domain (bottom right).
It is of interest to exploit the information from the computational transition pathway to help explain the impact of known mutations on the E2-E1 transition. This is particularly true of the mutations of residues in the neighborhood of the Ca2+ and proton binding sites, e.g., E309 [22], E771 [22], and N796 [36]. Using digestion pattern analysis, Inesi and coworkers [22] showed that the E309Q mutant abolished the E2-E1 transition, indicating that the ability to protonate/deprotonate of E309 is crucial for this transition. The computed pathway shows that the sidechain of E309, here protonated throughout the transition, undergoes large conformational changes. In the first half of the transition, it resides inside helix-bundle formed by M4, M5, and M6, coordinated by the backbone carbonyl of V304 and the sidechain of N796. As the N-terminal water channel opens, it reorients and moves away from the interior of the helix-bundle to the membrane water interface (Figure 6 and Movie S2). The exposure to water could lead to the deprotonation of the E309, therefore stabilizing the final state E1. Deprotonation of E309 during the E2-E1 transition has been suggested by other computational studies as well [23, 26]. The pKa of analysis of the MD trajectories below also shows that the proton on the protonated E309 sidechain leaves at a certain point during the structural transition and it coincides with the opening of the N-terminal water channel, facilitating the complete transition to E1. In the same digestion study, the E771Q mutant showed an E1 digestion pattern at neutral pH as compared to the wildtype, whereas one needs to raise the pH to 8 to observe the E1 pattern. The implication of this observation is that changing the carboxyl group in E771 to an amide group destabilizes the E2 conformation, shifting the equilibrium to E1. Structurally, this can be explained by the involvement of E771 in the hydrogen bonding network during the E2 to E1 transition as shown in Figure 7. In E2, the binding pocket is filled by the sidechain of N796 hydrogen boned to E309 and E771. Both oxygen atoms on the E771 sidechain participate in the E771-N796 hydrogen bonding interactions. This hydrogen bonding network is disrupted during the E2 to E1 transition. Assuming that the E to Q mutation at position 771 retains the same hydrogen bond network, the O…H-N interactions between N796 and Q771 is most likely weaker than the wildtype O…H-O given the higher electronegativity of oxygen. The weakened interaction network in E771Q could be the culprit of the observed E1 pattern at neutral pH. This hydrogen bonding network seems to play an important role in the proton countertransport in SERCA. This may also explain why the N796A mutant failed to dephosphorylate and essentially go to E1 [36].
Figure 6.

The water access channels at different stages during the E2 to E1 transition in the string pathway calculations shown from the side. The cytoplasmic side is on the top and the luminal side is on the bottom. 10 snapshots are taken from the last 10 ns simulation trajectory for each image. The water in these 10 structures are overlaid and shown as surface representation. The water surfaces in N-terminal, C-terminal and luminal water access channels are color coded differently in light blue, red, and light green, respectively.
Figure 7.

The hydrogen-bonding network involving E771 and E771Q during the E2 to E1 transition. (A) E771 and (B) E771Q participate in hydrogen bonding interactions with N796 in the beginning of the E2 to E1 transition in image 0. (C) The breaking of the E771 hydrogen bond at the later stage of the E2 to E1 transition in image 28. The binding sites are shown from the cytoplasmic side and the key residues are shown in green sticks.
There are additional mutations, away from the Ca2+/H+ binding sites, that affect the E2-E1 transition. For example, K758I [37] and R762I [38] are known to decrease the E2-E1 transition rate. Both residues are on the helix connecting M5 and the P domain, which during the transition moves towards the C-terminus of the protein. At the tail end of this transition, K758 comes into close contact with E918 located near the C-terminus, stabilizing the final E1 form of the enzyme. A neutralized sidechain in this case would not be able to do so, possibly explaining the retarding effect in K758I as shown in Figure 8. The E2-E1 rate retarding mechanism of the R762I is perhaps different than K758I, even though they are on the same structural element. R762 is involved in a complex hydrogen bonding network at the cytoplasmic entrance of the C-terminal water channel, surrounded by Q759, Y837, E918, and D981 (Figure 8). It serves as the gatekeeper of the C-terminal water channel. In the middle of the transition between images 16 and 17, the sidechain of R762 moves towards the luminal side, blocking the cytoplasmic water access to the ion binding sites via the C-terminal water channel. This move is accompanied by a reorganization of the hydrogen bonding network near the Ca2+ binding sites: the sidechains of S766 and S767 instead of forming hydrogen bonding interactions with water and D800 at the Ca2+ binding sites now are hydrogen bonded with the backbone carbonyl groups from R762 and Y763 in the same helical segment probably due to the drying effect imposed by R762 blocking the C-terminal water channel (Figure 8A and 8B). This releases the sidechain of D800, which then switches to coordinate water molecules from the N-terminal water channel (Figure 8B). This new rotameric state of D800 is also more similar to that in the E1 Ca2+ binding sites. The R762I mutation could affect this process, therefore inhibiting the E2-E1 transition.
Figure 8.

The hydrogen bonding network at the C-terminal region highlighting residues K758 and R762 shown from the side. The cytoplasmic side is on the top and the luminal side is on the bottom. Three images (A) 0, (B) 17, and (C) 31 are shown to represent different stages during the E2 to E1 transition. The important residues are highlighted in color with stick representations.
Deprotonation and gate opening
The computational transition pathway determined with a fixed protonation state of the binding site residues provides a plausible initial look into the structural rearrangements underlying the E2-E1 transition (Figure 5 and Supplementary Movies S1–S5). The string pathway, however, does not offer information about the timing and the mechanism for the release of protons. These events are necessary for the return of the pump to the E1 state, with the binding sites accessible from the cytoplasmic side to bind Ca2+. The two glutamic acids, E309 and E771, which carry and transport two protons to the cytoplasmic side, were both protonated when refining the computational transition pathway. Ultimately, these two protons must exit the binding sites to the cytoplasm during the E2-E1 transition.
Deprotonation of E309 or E771 is likely to happen only if the glutamate side chains are solvent-accessible from the cytoplasm. There are three solvent-accessible channels reaching into the binding sites (Figures 1B and 1C). Two of them are near the N- and C-termini of the protein, connecting the binding sites to the cytoplasm. A similar N-terminal water-wire forming from the cytoplasmic side was also observed in previous MD simulations [26]. The other water channel opens to the luminal side of the membrane, allowing luminal water access. The water accessibility of these distinct aqueous channels leading to the binding sites can be characterized quantitatively using MD simulations. The numbers of water molecules inside these aqueous channels can be extracted from the MD simulation trajectories. A channel is deemed closed when the hydration number is less than 3 (see Figure 9 for an example). In the computed E2-E1 transition pathway with both E309 and E771 protonated, the luminal access water channel is always closed (Figures 6 and 10). The starting point of this transition is the protonated, luminally-occluded E2. Opening of the luminal gate would mean disruption of the pump cycle. The N-terminal water channel is closed in the beginning of the transition but starts to open at image 15 (Figure 6B and 6C), allowing water to infiltrate into the binding sites. Interestingly, the C-terminal water channel is open during the first half of the transition, but closes when the N-terminal water channel starts to allow water to come in to the binding sites (Figures 6B, 6C, and 10). The function of a fully hydrated C-terminal water channel is not clear but it is possible that it provides an escape route for the proton on E771. The C-terminal water channel was previous discussed in SERCA [13] and in the Na+/K+ pump [39]. The simultaneous closure of the C-terminal water channel upon the opening of the N-terminal water channel is an interesting observation. It may serve to prevent the back protonation of E309 and E771, which would inhibit the full transition towards E1.
Figure 9.
Side view of the hydrated water channels in the SERCA pump. Two structures from the MD simulations are shown to highlight the structural correlation of the hydration number (Nwater) and channel opening. The N-terminal (light blue), C-terminal (red), and the luminal (pale green) water channels are shown in different colors. Water molecules within the water channels are shown in spheres. In (A) both the N-terminal and the luminal channels are closed with hydration numbers of 3 and 1, respectively. The C-terminal water channel is open with Nwater = 10. In (B) The N-terminal and the luminal channels are open with hydration numbers of 12 and 9, respectively, and the C-terminal water channel is closed with Nwater = 2. The cytoplasmic side is on the top and the luminal side is on the bottom.
Figure 10.

Water channels and hydration numbers along the transition pathway. (A) The hydration number of the N- (blue), C-terminal (green), and luminal (red) channels along the computed conformational transition pathway. (B) The averaged hydration number and its standard error of the N- (top), C-terminal (middle), and luminal channels (bottom) for the selected images simulated with different E309/E771 protonation configurations. The downward triangles in the bottom panel mark systems where K+ entered into the binding sites from the luminal side. To calculate the hydration numbers, we first define three sets of residues that line the water channels. For the N-terminal water channel, the residues are E309, G310, D800, and G801. For the C-terminal water channel, the residues are Y763, S766, N911, and S915. For the luminal channel, the residues are A301, A305, and L792. For a given simulation snapshot, a volume corresponding to 4 Å around the heavy atoms of these residues is created and the water molecules found within the volume are selected. Then, each water molecule is ascribed to a given residue based on a minimum-distance criterion. Finally, the water molecules are filed into three categories corresponding to the three water channels. The average hydration numbers and standard errors shown in (B). In Image 4, 9, and 21 where a single long trajectory is generated, the standard errors were calculated by dividing the last 800 ns of each simulation into 10 sequential blocks, 80 ns each. In Image 13, 15, and 17, the standard errors were computed from the three replica simulations.
To determine the point along the E2-E1 transition at which deprotonation of E309 and E771 might occur, we selected a few intermediate configurations along the string pathway and determined the structural impact of deprotonating these two glutamates using unbiased MD simulations. The results from these simulations indicate that deprotonation must be a sequential process starting with E309. According to Figures 4 and 10A, deprotonation of E309 is likely to occur at images 15–17 along the E2-E1 transition because the side chain of E309 is not solvent accessible until the TM domain starts to rearrange at image 15. Importantly, deprotonation of E309 at this point also does not disrupt the closed luminal gate (Figure 10B). Conversely, the simulations also suggest that deprotonation cannot start with E771, as this would cause the luminal channel to open up allowing the entry of water and/or ions (Figure 10B). Such an opening on the luminal side would disrupt the transport cycle by preventing the pump from returning to the cytoplasmic facing E1 state. A similar water-wire between E309 and the cytoplasmic side observed during previous MD simulations also supports the notion that the deprotonation of this residue occurs first [26].
Further insight can be obtained from the pKa of snapshots taken from MD trajectories using PROPKA3.1. As explained earlier, the fluctuations of the pKa values of an ionizable residue reflect the quality of its assigned protonation state. By cautiously monitoring the instantaneous pKa values from MD, the trends associated with various conformational changes along the transport cycle can be clarified. As shown in the left panels of Figure 11, there is a wide scatter in the instantaneous pKa values of E309 and E771 computed from the trajectories generated with the “E309p, E771-“ ionization state. The implication from this observation is that deprotonation of E771 prior to E309 is inconsistent with the protein conformation. In contrast, the right panels of Figure 11 show that the instantaneous pKa values of E309 and E771 are comparatively well focused when the trajectories are generated with the ionization state “E309-, E771p”. Thus, deprotonation of E309 prior to E771 is consistent with the protein conformation. Interestingly, the bottom right panel in Figure 11 also shows that E771 is likely to lose its proton at around image 17, for which there are clear occurrences of down shifted pKa values (because the TM region begins to open up and increase solvent accessibility). Once E309 and E771 are both deprotonated, the E2-E1 transition can reach completion.
Figure 11.

Distribution of instantaneous pKa for residue E309 and E771 calculated from MD simulations of selected images with either E309 or E771 deprotonated. The images included here are 4 (red), 9 (green), 13 (blue), 15 (magenta), 17 (cyan), and 21 (orange).
An intriguing issue is whether the binding of Ca2+ has a role in activating/accelerating changes in the pKa of E771 and D800. The N-terminal water channel opens up fully, and the ion binding sites could be accessible to the cytoplasmic side and ready to accept Ca2+. Indeed, it is observed in the present simulations that K+ ions can access the binding site from the cytoplasmic side after both E309 and E771 lose their protons. Figure 12 shows the configuration of the K+ bound ion binding sites and its comparison to the Ca2+ bound E1 state structure. The differences between K+ and Ca2+ notwithstanding, the observation clearly illustrates that the negatively charged binding sites arising from the dissociation of protons from E309 and E771 should favor metal binding. Further computational studies will be needed to fully address the nature of the coupling between deprotonation, Ca2+ binding, and the E2-E1 transition.
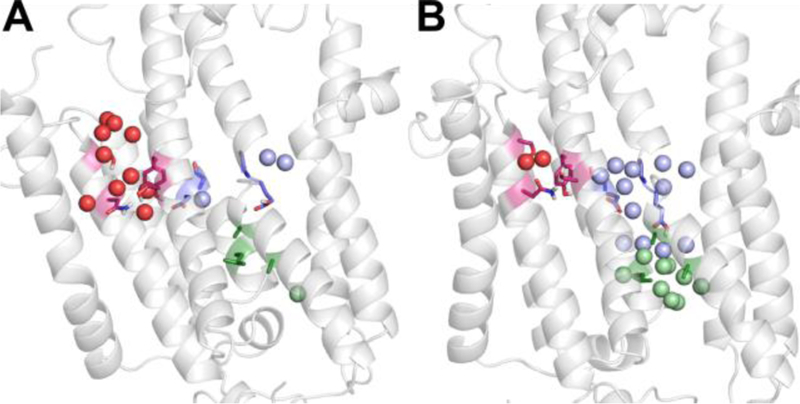
Figure 12.

Comparison between the K+ bound SERCA structure (white) from the image 21 simulation with both E309 and E771 deprotonated and the Ca2+ bound E1 structure from PDBID 3AR2 (yellow). (A) The side view of the ion binding sites with the cytoplasmic side on the top and the luminal side on the bottom. (B) The cytoplasmic view of the binding sites. The binding site residues are shown in stick representation.
The current simulation study strongly suggest that deprotonation of E309 and E771 in SERCA is sequential. A sequential process has also been suggested from previous experiments [22, 24–26]. The MD trajectories allow the visualization of a detailed sequential deprotonation process. In this process, the loss of proton from E309 opens up the N-terminal water channel, which, in turn, allows cytoplasmic water access to E771, promoting its deprotonation. The proposed sequential deprotonation of the binding site residues upon proton counter transport mirrors the consecutive and cooperative binding/release of the two Ca2+ at the E1 binding sites [40]. Similar ion binding cooperativity both from the cytoplasmic and the extracellular sides has also been observed for the Na+/K+ pump, another P-type ATPase [41–46]. On a speculative note, it is possible that such a sequential mechanism is functionally advantageous because it gives rise to a sequence of small free energy barriers, in contrast to the large unfavorable free energy barrier that might be associated with a highly concerted transition mechanism involving the simultaneous binding/release of multiple charged species. A sequential mechanism also ensures efficient coupling and the cooperative binding of the two Ca2+ in a narrow concentration range, which is required for the physiological need of removing Ca2+ from the cytoplasm to evoke muscle relaxation. Thus, SERCA appears to be beautifully optimized for carrying out its physiological role.
CONCLUSION
The current study is a natural extension of the previous transition pathway calculations on the pump cycle. It provides a more complete and clear description of the conformational transition from the E2 state toward the E1 state along the transport cycle of SERCA. From a functional point of view, the chronology of the deprotonation process described here helps explain how the transporter maintains strict coupling at physiological pH by controlling solvent accessibility to the binding sites. While previous crystallographic work by Toyoshima et al [32] provided a solid structural foundation for understanding this key mechanistic aspect of the E1-E2 pump, the present analysis goes further by revealing the underlying dynamics and physicochemical interactions giving rise to the strict coupling. More broadly, the study also provides novel insight on the mechanism of P-type ATPases such as the Na+/K+-pump, which is known to have altered protonation states at the binding site upon the transition from the state E2 to the state E1[34].
METHODS
The crystal structure 3W5C [32] was used to construct the all-atom E2 protein-membrane system. The CHARMM-GUI membrane builder module[47–50] was used to facilitate the system building process. The final simulation system contained the protein, 480 POPC lipids, 70,328 TIP3P water molecules, and was solvated with 0.15 M KCl. The system registers a size of ~290,000 atoms and is ~120 × 130 × 170 Å3. Protonated residues at the binding site included E309, E771, and E908. D800 was left deprotonated. This system was named SYS_E2. An additional system (SYS_E2_D800p) with all four titratable residues protonated was also generated. SYS_E2 was simulated for 50 ns and SYS_E2_D800p was simulated for 25 ns restraints free to fully equilibrate all the uncorrelated components within. The purpose of these initial simulations of moderate length is mainly to relax the high-resolution X-ray structures (longer simulations would be required if the purpose was to achieve sampling conformational space). The simulations were performed using the simulation package NAMD2.12 [51].
The conformational transition pathway between E2 and E1 was determined using the string method with swarms-of-trajectories[12, 29–31]. The crystal structures 3W5C and 3W5A were used as the end-point E2 and E1 structures[32]. First, a coarse-grained, Cα-only transition pathway was obtained, using the ANMPathway method [52]. It contained a sequence of Cα-only structures illustrating the structural transition between E2 and E1. The sequence of Cα coordinates was then used to guide the initial transition pathway generation through piece-wise targeted MD simulations. The starting point of the targeted MD simulations was the all-atom E2 system (SYS_E2, in which E309, E771, and E908 are protonated and D800 is deprotonated). To generate the initial pathway, forces were exerted on the Cα atoms to gradually steer the pump to reach an E1 state in the presence of a native-like environment. Then, the initial pathway was iteratively refined using the string-method with swarms-of-trajectories approach until reaching convergence (more than 300 iterations). The pathway contained 32 images. During each iteration 32 swarms of trajectories, 10 ps each, were generated per image. The total simulation time of the string calculations amounts to 3.07 μs. The details of this approach can be found in our earlier study illustrating the entire transition pathway of the SERCA pump cycle [12]. The convergence of the string calculation was ascertained as in the reference our previous study [12]. The Cα RMSD relative to the initial pathway for each image taken from the last 10 iterations of the string calculations are plotted in Figure S2 in the Supplementary Information. The lack of change in the RMSD of the individual images demonstrates that the string optimization is fully converged and that additional iterations will not improve the accuracy of the computed pathway.
K+ is used in the buffer solution during the string pathway calculations instead of Mg2+ even though the latter is known to stabilize the open E1 conformation [53] and may facilitate the transition. The reason for not using Mg2+ in the simulations is twofold. First, the string pathway is determined using the X-ray structures as stable end-points E1 and E2 for the transition. In that sense, the stability of the E1 state with the binding sites accessible to the cytoplasm simply reflects the X-ray structure used in the calculation. Secondly, the force field for a small divalent cation such as Mg2+ is not likely to accurately capture the specific binding to SERCA. Therefore, instead of Mg2+, K+ is the cation species in the simulations.
The converged pathway covered the structural transition between E2 and E1 in 32 structural snapshots called images. Six out of these 32 images were taken out for additional simulations in the hope of determining the time course of proton release to the cytoplasmic side. These images included image 4, 9, 13, 15, 17, and 21. These images were chosen because they present the key events during the E2 to E1 transition. In these images, the TM helices start to deviate significantly from the starting E2 structure (the top panel in Figure 4) and the hydration states of the binding sites start to undergo change (Figure 10A). For each of the chosen image, we set up four MD simulations, with different E309 and E771 protonation configurations, ranging from them both deprotonated to both protonated. The systems were equilibrated using the simulation package OpenMM6.2[54]. Afterwards, each system was simulated for another 960 ns restraints-free using Anton2[55]. For each of the key images 13, 15, and 17, where the binding sites experience a large change in hydration, two additional 300 ns simulations were carried out for all four protonation states. They were performed with the same equilibration and production protocols described above. The properties calculated for these images are from all three replicas. The simulation time breakdown is shown in Table S1 with a total simulation time of 28.05 μs.
In the NAMD simulations, the NPT ensemble with constant particle number, pressure (1 atm along the Z-axis), and temperature (300 K) was used for all the simulations. The pressure of the system was controlled by the hybrid Nosé-Hoover Langevin piston method. During the equilibration stage particle velocity reassignment was performed every 500 steps to ensure a constant temperature, while the Langevin Dynamics thermostat with a 1 ps−1 damping coefficient was employed in the initial production. The van der Waals interactions were smoothly switched off at 10–12 Å by a switching function and the electrostatic interactions were calculated using the particle-mesh Ewald method with a mesh size of ~1 Å.
The OpenMM simulations were performed on GeForce GTX 780 Ti GPU processors. They contain two steps. In the first step, positional restraints were applied to the heavy atoms in the protein. Additional planar restraints were also applied to the lipid headgroups to maintain their position along the Z-axis, which is parallel to the membrane normal. The first step of equilibration lasts 675 ps. During this time, the restraints were gradually released until the system is restraint-free. This was followed by a 10-ns equilibration simulation without any restraints on the system to make sure the systems are fully equilibrated. The input files for the OpenMM equilibration simulations were taken from the CHARMM-GUI membrane builder module. These simulations were performed in an NPT ensemble with the temperature set to 300 K and the pressure along the membrane normal set to 1 atm. The Langevin thermostats with a damping coefficient of 1 ps−1 were used to keep the temperature constant. The OpenMM package uses a Monte Carlo algorithm to adjust the size of the periodic box, therefore simulating the effect of constant pressure. The van der Waals interactions were smoothly switched off at 10–12 Å by a force switching function[56] and the electrostatic interactions were calculated using the particle-mesh Ewald method with a mesh size of ~1 Å[57].
All the Anton2 simulations were performed in the NPT ensemble as well. The Nosé-Hoover thermostat[58] was used to maintain the system temperature at 300 K. The lengths of all bonds involving hydrogen atoms were constrained using M-SHAKE[59]. The cutoff of the van der Waals and short-range electrostatic interactions was set to ~12 Å as suggested by the guesser script. Long-range electrostatic interactions were evaluated using the k-space Gaussian split Ewald method[60] with a 64 × 64 × 64 mesh. The r-RESPA integration method[61] was employed and long-range electrostatics were evaluated every 6 fs. The additive C36 force field was used in all the simulations performed here[62–65].
Supplementary Material
Supplementary Movie S1. The main conformational changes for the TM during the E2-E1 transition (see also Figure 5, top left panel). The TM and P domain were aligned with respect to the M7–M10 helices. The sequence of colors indicates the ordered progression of the structure for four representative image snapshots along the transition pathway: 0 (white), 13 (yellow), 21 (orange), and 31 (red). The aligned structural elements (dark grey) are indicated in bold on top of each panel. Residue Cα atoms that serve as reference points are shown in sphere presentation.
Supplementary Movie S2. The main conformational changes for the TM during the E2-E1 transition viewed from the side with the cytoplasmic side on the top and the luminal side on the bottom. (see also Figure 5, top left panel). The TM and P domain were aligned with respect to the M7–M10 helices. The sequence of colors indicates the ordered progression of the structure for four representative image snapshots along the transition pathway: 0 (white), 13 (yellow), 21 (orange), and 31 (red). The aligned structural elements (dark grey) are indicated in bold on top of each panel. The water filled access channels are shown by the surface of the water molecules within. Important residues are highlighted with stick representation.
Supplementary Movie S3. The main conformational changes for the P domain during the E2-E1 transition (see also Figure 5, top right panel). The TM and P domain were aligned with respect to the M7–M10 helices. The sequence of colors indicates the ordered progression of the structure for four representative image snapshots along the transition pathway: 0 (white), 13 (yellow), 21 (orange), and 31 (red). The aligned structural elements (dark grey) are indicated in bold on top of each panel. Residue Cα atoms that serve as reference points are shown in sphere presentation.
Supplementary Movie S4. The main conformational changes for the A domain during the E2-E1 transition (see also Figure 5, bottom left panel). The A and N domains were aligned with respect to the P domain. The sequence of colors indicates the ordered progression of the structure for four representative image snapshots along the transition pathway: 0 (white), 13 (yellow), 21 (orange), and 31 (red). The aligned structural elements (dark grey) are indicated in bold on top of each panel. Residue Cα atoms that serve as reference points are shown in sphere presentation.
Supplementary Movie S5. The main conformational changes for the N domain during the E2-E1 transition (see also Figure 5, bottom right panel). The A and N domains were aligned with respect to the P domain. The sequence of colors indicates the ordered progression of the structure for four representative image snapshots along the transition pathway: 0 (white), 13 (yellow), 21 (orange), and 31 (red). The aligned structural elements (dark grey) are indicated in bold on top of each panel. Residue Cα atoms that serve as reference points are shown in sphere presentation.
Highlights.
Molecular dynamics simulation show how the mechanism of proton countertransport is coupled to the E2 to E1 transition in the sarcoplasmic reticulum ATP-driven calcium pump SERCA
Strong coupling between the chronological order of deprotonation, the entry of water molecules into the transmembran region, and the opening of the cytoplasmic gate
Deprotonation of E309 and E771 is sequential with E309 being the first to lose the proton
Deprotonation of E309 and E771 promotes the opening of the cytoplasmic gate, but it is unproductive when it occurs too early because it causes the re-opening of the luminal gate
Acknowledgements
This work was supported by the Membrane Protein Structural Dynamics Consortium funded by NIH/NIGMS through grant U54-GM087519. An award of computer time was provided by the Innovative and Novel Computational Impact on Theory and Experiment (INCITE) program from the Department of Energy (DOE) of the United States of America. This research used resources of the Argonne Leadership Computing Facility (ALCF), which is a DOE Office of Science User Facility supported under Contract DE-AC02–06CH11357. Additional computational resources were provided by the Great Lake Consortium for Petascale Computing and the XSEDE program of the National Science Foundation of the United States of America. Anton computer time was provided by the National Center for Multiscale Modeling of Biological Systems (MMBioS) through Grant P41GM103712-S1 from the National Institutes of Health and the Pittsburgh Supercomputing Center (PSC). The Anton2 machine at PSC was generously made available by D.E. Shaw Research.
Footnotes
Publisher's Disclaimer: This is a PDF file of an unedited manuscript that has been accepted for publication. As a service to our customers we are providing this early version of the manuscript. The manuscript will undergo copyediting, typesetting, and review of the resulting proof before it is published in its final citable form. Please note that during the production process errors may be discovered which could affect the content, and all legal disclaimers that apply to the journal pertain.
REFERENCES
- [1].Albers RW. Biochemical aspects of active transport. Annu Rev Biochem 1967;36:727–56. [DOI] [PubMed] [Google Scholar]
- [2].Post RL, Hegyvary C, Kume S. Activation by Adenosine Triphosphate in the Phosphorylation Kinetics of Sodium and Potassium Ion Transport Adenosine Triphosphatase. J Biol Chem 1972;247:6530–40. [PubMed] [Google Scholar]
- [3].de Meis L, Vianna AL. Energy interconversion by the Ca2+-dependent ATPase of the sarcoplasmic reticulum. Annu Rev Biochem 1979;48:275–92. [DOI] [PubMed] [Google Scholar]
- [4].MacLennan DH, Brandl CJ, Korczak B, Green NM. Amino-acid sequence of a Ca2+ + Mg2+-dependent ATPase from rabbit muscle sarcoplasmic reticulum, deduced from its complementary DNA sequence. Nature 1985;316:696–700. [DOI] [PubMed] [Google Scholar]
- [5].Palmgren MG, Nissen P. P-type ATPases. Annu Rev Biophys 2011;40:243–66. [DOI] [PubMed] [Google Scholar]
- [6].Toyoshima C, Inesi G. Structural basis of ion pumping by Ca2+-ATPase of the sarcoplasmic reticulum. Annu Rev Biochem 2004;73:269–92. [DOI] [PubMed] [Google Scholar]
- [7].Obara K, Miyashita N, Xu C, Toyoshima I, Sugita Y, Inesi G, et al. Structural role of countertransport revealed in Ca(2+) pump crystal structure in the absence of Ca(2+). Proc Natl Acad Sci U S A 2005;102:14489–96. [DOI] [PMC free article] [PubMed] [Google Scholar]
- [8].Sugita Y, Miyashita N, Ikeguchi M, Kidera A, Toyoshima C. Protonation of the acidic residues in the transmembrane cation-binding sites of the ca(2+) pump. J Am Chem Soc 2005;127:6150–1. [DOI] [PubMed] [Google Scholar]
- [9].Sugita Y, Ikeguchi M, Toyoshima C. Relationship between Ca2+-affinity and shielding of bulk water in the Ca2+-pump from molecular dynamics simulations. Proc Natl Acad Sci U S A 2010;107:21465–9. [DOI] [PMC free article] [PubMed] [Google Scholar]
- [10].Espinoza-Fonseca LM, Autry JM, Thomas DD. Microsecond molecular dynamics simulations of Mg(2)(+)- and K(+)-bound E1 intermediate states of the calcium pump. Plos One 2014;9:e95979. [DOI] [PMC free article] [PubMed] [Google Scholar]
- [11].Smolin N, Robia SL. A structural mechanism for calcium transporter headpiece closure. J Phys Chem B 2015;119:1407–15. [DOI] [PMC free article] [PubMed] [Google Scholar]
- [12].Das A, Rui H, Nakamoto R, Roux B. Conformational Transitions and Alternating-Access Mechanism in the Sarcoplasmic Reticulum Calcium Pump. J Mol Biol 2017;429:647–66. [DOI] [PMC free article] [PubMed] [Google Scholar]
- [13].Bublitz M, Musgaard M, Poulsen H, Thogersen L, Olesen C, Schiott B, et al. Ion pathways in the sarcoplasmic reticulum Ca2+-ATPase. J Biol Chem 2013;288:10759–65. [DOI] [PMC free article] [PubMed] [Google Scholar]
- [14].Jencks WP. How does a calcium pump pump calcium? J Biol Chem 1989;264:18855. [PubMed] [Google Scholar]
- [15].Olesen C, Picard M, Winther AM, Gyrup C, Morth JP, Oxvig C, et al. The structural basis of calcium transport by the calcium pump. Nature 2007;450:1036–42. [DOI] [PubMed] [Google Scholar]
- [16].Olesen C, Sorensen TL, Nielsen RC, Moller JV, Nissen P. Dephosphorylation of the calcium pump coupled to counterion occlusion. Science 2004;306:2251–5. [DOI] [PubMed] [Google Scholar]
- [17].Sorensen TL, Moller JV, Nissen P. Phosphoryl transfer and calcium ion occlusion in the calcium pump. Science 2004;304:1672–5. [DOI] [PubMed] [Google Scholar]
- [18].Hill TL, Inesi G. Equilibrium cooperative binding of calcium and protons by sarcoplasmic reticulum ATPase. Proc Natl Acad Sci U S A 1982;79:3978–82. [DOI] [PMC free article] [PubMed] [Google Scholar]
- [19].Inesi G, Hill TL. Calcium and proton dependence of sarcoplasmic reticulum ATPase. Biophys J 1983;44:271–80. [DOI] [PMC free article] [PubMed] [Google Scholar]
- [20].Yu X, Hao L, Inesi G. A pK change of acidic residues contributes to cation countertransport in the Ca-ATPase of sarcoplasmic reticulum. Role of H+ in Ca(2+)-ATPase countertransport. J Biol Chem 1994;269:16656–61. [PubMed] [Google Scholar]
- [21].Yu X, Carroll S, Rigaud JL, Inesi G. H+ countertransport and electrogenicity of the sarcoplasmic reticulum Ca2+ pump in reconstituted proteoliposomes. Biophys J 1993;64:1232–42. [DOI] [PMC free article] [PubMed] [Google Scholar]
- [22].Inesi G, Lewis D, Toyoshima C, Hirata A, de Meis L. Conformational fluctuations of the Ca2+-ATPase in the native membrane environment. Effects of pH, temperature, catalytic substrates, and thapsigargin. J Biol Chem 2008;283:1189–96. [DOI] [PubMed] [Google Scholar]
- [23].Hauser K, Barth A. Side-chain protonation and mobility in the sarcoplasmic reticulum Ca2+-ATPase: implications for proton countertransport and Ca2+ release. Biophys J 2007;93:3259–70. [DOI] [PMC free article] [PubMed] [Google Scholar]
- [24].Liu Y, Pilankatta R, Lewis D, Inesi G, Tadini-Buoninsegni F, Bartolommei G, et al. High-yield heterologous expression of wild type and mutant Ca(2+) ATPase: Characterization of Ca(2+) binding sites by charge transfer. J Mol Biol 2009;391:858–71. [DOI] [PMC free article] [PubMed] [Google Scholar]
- [25].Espinoza-Fonseca LM, Autry JM, Ramirez-Salinas GL, Thomas DD. Atomic-level mechanisms for phospholamban regulation of the calcium pump. Biophys J 2015;108:1697–708. [DOI] [PMC free article] [PubMed] [Google Scholar]
- [26].Ramirez-Salinas GL, Espinoza-Fonseca LM. Atomistic Characterization of the First Step of Calcium Pump Activation Associated with Proton Countertransport. Biochemistry 2015;54:5235–41. [DOI] [PubMed] [Google Scholar]
- [27].Inesi G Sequential mechanism of calcium binding and translocation in sarcoplasmic reticulum adenosine triphosphatase. J Biol Chem 1987;262:16338–42. [PubMed] [Google Scholar]
- [28].Forge V, Mintz E, Canet D, Guillain F. Lumenal Ca2+ dissociation from the phosphorylated Ca(2+)-ATPase of the sarcoplasmic reticulum is sequential. J Biol Chem 1995;270:18271–6. [DOI] [PubMed] [Google Scholar]
- [29].Maragliano L, Fischer A, Vanden-Eijnden E, Ciccotti G. String method in collective variables: minimum free energy paths and isocommittor surfaces. J Chem Phys 2006;125:24106. [DOI] [PubMed] [Google Scholar]
- [30].Pan AC, Sezer D, Roux B. Finding transition pathways using the string method with swarms of trajectories. J Phys Chem B 2008;112:3432–40. [DOI] [PMC free article] [PubMed] [Google Scholar]
- [31].Weinan E, Ren W, Eijnden E. String method for the study of rare events. Phys Rev B 2002;66:052301. [Google Scholar]
- [32].Toyoshima C, Iwasawa S, Ogawa H, Hirata A, Tsueda J, Inesi G. Crystal structures of the calcium pump and sarcolipin in the Mg2+-bound E1 state. Nature 2013;495:260–4. [DOI] [PubMed] [Google Scholar]
- [33].Olsson MHM, Sondergaard CR, Rostkowski M, Jensen JH. PROPKA3: Consistent Treatment of Internal and Surface Residues in Empirical pK(a) Predictions. J Chem Theory Comput 2011;7:525–37. [DOI] [PubMed] [Google Scholar]
- [34].Rui H, Artigas P, Roux B. The selectivity of the Na(+)/K(+)-pump is controlled by binding site protonation and self-correcting occlusion. Elife 2016;5. [DOI] [PMC free article] [PubMed]
- [35].Musgaard M, Thogersen L, Schiott B. Protonation states of important acidic residues in the central Ca(2)(+) ion binding sites of the Ca(2)(+)-ATPase: a molecular modeling study. Biochemistry 2011;50:11109–20. [DOI] [PubMed] [Google Scholar]
- [36].Andersen JP, Vilsen B. Amino acids Asn796 and Thr799 of the Ca(2+)-ATPase of sarcoplasmic reticulum bind Ca2+ at different sites. Journal of Biological Chemistry 1994;269:15931–6. [PubMed] [Google Scholar]
- [37].Sørensen T, Vilsen B, Andersen JP. Mutation Lys758 → Ile of the Sarcoplasmic Reticulum Ca2+-ATPase Enhances Dephosphorylation ofE 2 P and Inhibits theE 2 to E 1Ca2Transition. Journal of Biological Chemistry 1997;272:30244–53. [DOI] [PubMed] [Google Scholar]
- [38].Sørensen TL-M, Andersen JP. Importance of Stalk Segment S5 for Intramolecular Communication in the Sarcoplasmic Reticulum Ca2+-ATPase. Journal of Biological Chemistry 2000;275:28954–61. [DOI] [PubMed] [Google Scholar]
- [39].Poulsen H, Khandelia H, Morth JP, Bublitz M, Mouritsen OG, Egebjerg J, et al. Neurological disease mutations compromise a C-terminal ion pathway in the Na(+)/K(+)-ATPase. Nature 2010;467:99–102. [DOI] [PubMed] [Google Scholar]
- [40].Champeil P, Gingold MP, Guillain F, Inesi G. Effect of magnesium on the calcium-dependent transient kinetics of sarcoplasmic reticulum ATPase, studied by stopped flow fluorescence and phosphorylation. J Biol Chem 1983;258:4453–8. [PubMed] [Google Scholar]
- [41].Cornelius F, Skou JC. The sided action of Na+ on reconstituted shark Na+/K+-ATPase engaged in Na+-Na+ exchange accompanied by ATP hydrolysis. II. Transmembrane allosteric effects on Na+ affinity. Biochim Biophys Acta 1988;944:223–32. [DOI] [PubMed] [Google Scholar]
- [42].Kanai R, Ogawa H, Vilsen B, Cornelius F, Toyoshima C. Crystal structure of a Na+-bound Na+,K+-ATPase preceding the E1P state. Nature 2013;502:201–6. [DOI] [PubMed] [Google Scholar]
- [43].Schneeberger A, Apell HJ. Ion selectivity of the cytoplasmic binding sites of the Na,K-ATPase: II. Competition of various cations. J Membr Biol 2001;179:263–73. [DOI] [PubMed] [Google Scholar]
- [44].Schulz S, Apell HJ. Investigation of ion binding to the cytoplasmic binding sites of the Na,K-pump. Eur Biophys J 1995;23:413–21. [DOI] [PubMed] [Google Scholar]
- [45].Gadsby DC, Bezanilla F, Rakowski RF, De Weer P, Holmgren M. The dynamic relationships between the three events that release individual Na(+) ions from the Na(+)/K(+)-ATPase. Nat Commun 2012;3:669. [DOI] [PMC free article] [PubMed] [Google Scholar]
- [46].Castillo JP, Rui H, Basilio D, Das A, Roux B, Latorre R, et al. Mechanism of potassium ion uptake by the Na(+)/K(+)-ATPase. Nat Commun 2015;6:7622. [DOI] [PMC free article] [PubMed] [Google Scholar]
- [47].Jo S, Kim T, Im W. Automated Builder and Database of Protein/Membrane Complexes for Molecular Dynamics Simulations. Plos One 2007;2. [DOI] [PMC free article] [PubMed]
- [48].Jo S, Kim T, Iyer VG, Im W. Software news and updates - CHARNIM-GUI: A web-based grraphical user interface for CHARMM. J Comput Chem 2008;29:1859–65. [DOI] [PubMed] [Google Scholar]
- [49].Jo S, Lim JB, Klauda JB, Im W. CHARMM-GUI Membrane Builder for Mixed Bilayers and Its Application to Yeast Membranes. Biophys J 2009;97:50–8. [DOI] [PMC free article] [PubMed] [Google Scholar]
- [50].Wu EL, Cheng X, Jo S, Rui H, Song KC, Davila-Contreras EM, et al. CHARMM-GUI Membrane Builder toward realistic biological membrane simulations. J Comput Chem 2014;35:1997–2004. [DOI] [PMC free article] [PubMed] [Google Scholar]
- [51].Phillips JC, Braun R, Wang W, Gumbart J, Tajkhorshid E, Villa E, et al. Scalable molecular dynamics with NAMD. J Comput Chem 2005;26:1781–802. [DOI] [PMC free article] [PubMed] [Google Scholar]
- [52].Das A, Gur M, Cheng MH, Jo S, Bahar I, Roux B. Exploring the Conformational Transitions of Biomolecular Systems Using a Simple Two-State Anisotropic Network Model. PLoS Comput Biol 2014;10:e1003521. [DOI] [PMC free article] [PubMed] [Google Scholar]
- [53].Winther AM, Bublitz M, Karlsen JL, Moller JV, Hansen JB, Nissen P, et al. The sarcolipin-bound calcium pump stabilizes calcium sites exposed to the cytoplasm. Nature 2013;495:265–9. [DOI] [PubMed] [Google Scholar]
- [54].Eastman P, Friedrichs MS, Chodera JD, Radmer RJ, Bruns CM, Ku JP, et al. OpenMM 4: A Reusable, Extensible, Hardware Independent Library for High Performance Molecular Simulation. J Chem Theory Comput 2013;9:461–9. [DOI] [PMC free article] [PubMed] [Google Scholar]
- [55].Shaw DE, Dror RO, Salmon JK, Grossman J, Mackenzie KM, Bank JA, et al. Millisecond-scale molecular dynamics simulations on Anton. Proceedings of the Conference on High Performance Computing Networking, Storage and Analysis: ACM; 2009. p. 39. [Google Scholar]
- [56].Steinbach PJ, Brooks BR. New spherical-cutoff methods for long-range forces in macromolecular simulation. J Comput Chem 1994;15:667–83. [Google Scholar]
- [57].Essmann U, Perera L, Berkowitz ML, Darden T, Lee H, Pedersen LG. A smooth particle mesh Ewald potential. J Chem Phys 1995;103:8577–92. [Google Scholar]
- [58].Martyna GJ, Klein ML, Tuckerman M. Nose-Hoover Chains - the Canonical Ensemble Via Continuous Dynamics. J Chem Phys 1992;97:2635–43. [Google Scholar]
- [59].Krautler V, Van Gunsteren WF, Hunenberger PH. A fast SHAKE: Algorithm to solve distance constraint equations for small molecules in molecular dynamics simulations. J Comput Chem 2001;22:501–8. [Google Scholar]
- [60].Shan Y, Klepeis JL, Eastwood MP, Dror RO, Shaw DE. Gaussian split Ewald: A fast Ewald mesh method for molecular simulation. J Chem Phys 2005;122:054101. [DOI] [PubMed] [Google Scholar]
- [61].Tuckerman M, Berne BJ, Martyna GJ. Reversible multiple time scale molecular dynamics. J Chem Phys 1992;97:1990–2001. [Google Scholar]
- [62].Best RB, Zhu X, Shim J, Lopes PE, Mittal J, Feig M, et al. Optimization of the additive CHARMM all-atom protein force field targeting improved sampling of the backbone phi, psi and side-chain chi(1) and chi(2) dihedral angles. J Chem Theory Comput 2012;8:3257–73. [DOI] [PMC free article] [PubMed] [Google Scholar]
- [63].Jorgensen WL, Chandrasekhar J, Madura JD, Impey RW, Klein ML. Comparison of simple potential functions for simulating liquid water. J Chem Phys 1983;79:926–35. [Google Scholar]
- [64].Klauda JB, Venable RM, Freites JA, O’Connor JW, Tobias DJ, Mondragon-Ramirez C, et al. Update of the CHARMM All-Atom Additive Force Field for Lipids: Validation on Six Lipid Types. J Phys Chem B 2010;114:7830–43. [DOI] [PMC free article] [PubMed] [Google Scholar]
- [65].Mackerell AD Jr., Bashford D, Bellott M, Dunbrack RL, Evanseck JD, Field MJ, et al. All-atom empirical potential for molecular modeling and dynamics studies of proteins. J Phys Chem B 1998;102:3586–616. [DOI] [PubMed] [Google Scholar]
Associated Data
This section collects any data citations, data availability statements, or supplementary materials included in this article.
Supplementary Materials
Supplementary Movie S1. The main conformational changes for the TM during the E2-E1 transition (see also Figure 5, top left panel). The TM and P domain were aligned with respect to the M7–M10 helices. The sequence of colors indicates the ordered progression of the structure for four representative image snapshots along the transition pathway: 0 (white), 13 (yellow), 21 (orange), and 31 (red). The aligned structural elements (dark grey) are indicated in bold on top of each panel. Residue Cα atoms that serve as reference points are shown in sphere presentation.
Supplementary Movie S2. The main conformational changes for the TM during the E2-E1 transition viewed from the side with the cytoplasmic side on the top and the luminal side on the bottom. (see also Figure 5, top left panel). The TM and P domain were aligned with respect to the M7–M10 helices. The sequence of colors indicates the ordered progression of the structure for four representative image snapshots along the transition pathway: 0 (white), 13 (yellow), 21 (orange), and 31 (red). The aligned structural elements (dark grey) are indicated in bold on top of each panel. The water filled access channels are shown by the surface of the water molecules within. Important residues are highlighted with stick representation.
Supplementary Movie S3. The main conformational changes for the P domain during the E2-E1 transition (see also Figure 5, top right panel). The TM and P domain were aligned with respect to the M7–M10 helices. The sequence of colors indicates the ordered progression of the structure for four representative image snapshots along the transition pathway: 0 (white), 13 (yellow), 21 (orange), and 31 (red). The aligned structural elements (dark grey) are indicated in bold on top of each panel. Residue Cα atoms that serve as reference points are shown in sphere presentation.
Supplementary Movie S4. The main conformational changes for the A domain during the E2-E1 transition (see also Figure 5, bottom left panel). The A and N domains were aligned with respect to the P domain. The sequence of colors indicates the ordered progression of the structure for four representative image snapshots along the transition pathway: 0 (white), 13 (yellow), 21 (orange), and 31 (red). The aligned structural elements (dark grey) are indicated in bold on top of each panel. Residue Cα atoms that serve as reference points are shown in sphere presentation.
Supplementary Movie S5. The main conformational changes for the N domain during the E2-E1 transition (see also Figure 5, bottom right panel). The A and N domains were aligned with respect to the P domain. The sequence of colors indicates the ordered progression of the structure for four representative image snapshots along the transition pathway: 0 (white), 13 (yellow), 21 (orange), and 31 (red). The aligned structural elements (dark grey) are indicated in bold on top of each panel. Residue Cα atoms that serve as reference points are shown in sphere presentation.