

Abstract
Despite progress in defining genetic risk for psychiatric disorders, their molecular mechanisms remain elusive. Addressing this, the PsychENCODE Consortium has generated a comprehensive online resource for the adult brain across 1866 individuals. The PsychENCODE resource contains ~79,000 brain-active enhancers, sets of Hi-C linkages, and topologically associating domains; single-cell expression profiles for many cell types; expression quantitative-trait loci (QTLs); and further QTLs associated with chromatin, splicing, and cell-type proportions. Integration shows that varying cell-type proportions largely account for the cross-population variation in expression (with >88% reconstruction accuracy). It also allows building of a gene regulatory network, linking genome-wide association study variants to genes (e.g., 321 for schizophrenia). We embed this network into an interpretable deep-learning model, which improves disease prediction by ~6-fold versus polygenic risk scores and identifies key genes and pathways in psychiatric disorders.
Graphical Abstarct
INTRODUCTION:
Strong genetic associations have been found for a number of psychiatric disorders. However, understanding the underlying molecular mechanisms remains challenging.
RATIONALE:
To address this challenge, the PsychENCODEConsortiumhasdevelopedacomprehensiveonlineresourceandintegrative models for the functional genomics of the human brain.
RESULTS:
The base of the pyramidal resource is the datasets generated by PsychENCODE, including bulk transcriptome, chromatin, genotype, and Hi-C datasets and single-cell transcriptomic data from ~32,000 cells for major brain regions. We have merged these with data from Genotype-Tissue Expression (GTEx), ENCODE, Roadmap Epigenomics, and single-cell analyses. Via uniform processing, we created a harmonized resource, allowing us to survey functional genomics data on the brain over a sample size of 1866 individuals.
From this uniformly processed dataset, we created derived data products. These include lists of brain-expressed genes, coexpression modules, and single-cell expression profiles for many brain cell types; ~79,000 brain-active enhancers with associated Hi-C loops and topologically associating domains; and ~2.5 million expression quantitative-trait loci (QTLs) comprising ~238,000 linkage-disequilibrium–independent single-nucleotide polymorphisms and of other types of QTLs associated with splice isoforms, cell fractions, and chromatin activity. By using these, we found that >88% of the cross-population variation in brain gene expression can be accounted for by cell fraction changes. Furthermore, a number of disorders and aging are associated with changes in cell-type proportions. The derived data also enable comparison between the brain and other tissues. In particular, by using spectral analyses, we found that the brain has distinct expression and epigenetic patterns, including a greater extent of noncoding transcription than other tissues.
The top level of the resource consists of integrative networks for regulation and machine-learning models for disease prediction. The networks include a full gene regulatory network (GRN) for the brain, linking transcription factors, enhancers, and target genes from merging of the QTLs, generalized element-activity correlations, and Hi-C data. By using this network, we link disease genes to genome-wide association study (GWAS) variants for psychiatric disorders. For schizophrenia, we linked 321 genes to the 142 reported GWAS loci. We then embedded the regulatory network into a deep-learning model to predict psychiatric phenotypes from genotype and expression. Our model gives a ~6-fold improvement in prediction over additive polygenic risk scores. Moreover, it achieves a ~3-fold improvement over additive models, even when the gene expression data are imputed, highlighting the value of having just a small amount of transcriptome data for disease prediction. Lastly, it highlights key genes and pathways associated with disorder prediction, including immunological, synaptic, and metabolic pathways, recapitulating de novo results from more targeted analyses.
CONCLUSION:
Our resource and integrative analyses have uncovered genomic elements and networks in the brain, which in turn have provided insight into the molecular mechanisms underlying psychiatric disorders. Our deep-learning model improves disease risk prediction over traditional approaches and can be extended with additional data types (e.g., microRNA and neuroimaging). ▪
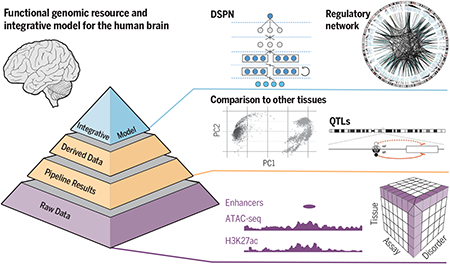
A comprehensive functional genomic resource for the adult human brain. The resource forms a three-layer pyramid. The bottom layer includes sequencing datasets for traits, such as schizophrenia. The middle layer represents derived datasets, including functional genomic elements and QTLs. The top layer contains integrated models, which link genotypes to phenotypes. DSPN, Deep Structured Phenotype Network; PC1 and PC2, principal components 1 and 2; ref, reference; alt, alternate; H3K27ac, histone H3 acetylation at lysine 27.
Disorders of the brain affect nearly one-fifth of the world’s population (1). Decades of research have led to little progress in our understanding of the molecular causes of psychiatric disorders. This contrasts with cardiac disease, for which lifestyle and pharmacological modification of environmental risk factors has had profound effects on morbidity, or cancer, which is now understood to be a direct disorder of the genome (2–5). Although genome-wide association studies (GWAS) have identified many genomic variants strongly associated with neuropsychiatric disease risk—for instance, the Psychiatric Genomics Consortium (PGC) has identified 142 GWAS loci associated with schizophrenia (SCZ) (6)—for most of these variants, we have little understanding of the molecular mechanisms affecting the brain (7).
Many of these variants lie in noncoding regions, and large-scale studies have begun to elucidate the changes in genetic and epigenetic activity associated with these genomic alterations, suggesting potential molecular mechanisms. In particular, the Genotype-Tissue Expression (GTEx) project has associated many noncoding variants with expression quantitative-trait loci (eQTLs), and the ENCODE and Roadmap Epigenomics (Roadmap) projects have identified noncoding regions acting as enhancers and promoters (8–10). However, none of these projects have focused their efforts on the human brain. Initial work focusing on brain-specific functional genomics has provided greater insight but could be enhanced with larger sample sizes (11, 12). Moreover, new methodologies, such as Hi-C and single-cell sequencing, have yet to be fully integrated at scale with brain genomics data (13–16).
Hence, the PsychENCODE Consortium has generated large-scale data to provide insight into the brain and psychiatric disorders, including data derived through genotyping, bulk and single-cell RNA sequencing (RNA-seq), chromatin immunoprecipitation with sequencing (ChIP-seq), assay for transposase-accessible chromatin using sequencing (ATAC-seq), and Hi-C (17). All data have been placed into a central, publicly available resource that also integrates relevant reprocessed data from related projects, including ENCODE, the CommonMind Consortium (CMC), GTEx, and Roadmap. By using this resource, we identified functional elements, quantitative-trait loci (QTLs), and regulatory-network linkages specific to the adult brain. Moreover, we combined these elements and networks to build an integrated deep-learning model that predicts high-level traits from genotype via intermediate molecular phenotypes. By “intermediate phenotypes,” we mean the readouts of functional genomic information on genomic elements (e.g., gene expression and chromatin activity). In some contexts, these are also referred to as “molecular endophenotypes” (18). However, we include additional low-level “phenotypes,” such as cell fractions, so we use the more general term “intermediate phenotype.” We also refer to the high-level traits as “observed phenotypes,” which include both classical clinical variables and characteristics of healthy individuals, such as gender and age.
Resource construction
The PsychENCODE resource (19) is the central website for this paper. It organizes data hierarchically, with a base of raw data files, a middle layer of uniformly processed and easily shareable results (such as open chromatin regions and gene expression quantifications), and a top-level “cap” of an integrative, deep-learning model, based on regulatory networks and QTLs. To build the base layer, we included all adult brain data from PsychENCODE and merged these with relevant data from ENCODE, CMC, GTEx, Roadmap, and recent single-cell studies (table S1 and Fig. 1). In total, the resource contains 3810 genotype, transcriptome, chromatin, and Hi-C datasets from PsychENCODE and 1662 datasets obtained by using similar bulk assays merged from outside the consortium. Overall, the datasets from the prefrontal cortex (PFC) involve sampling from 1866 individuals. The resource also has single-cell RNA-seq data for 18,025 cells from PsychENCODE and 14,012 cells from outside sources (20). These data represent a range of psychiatric disorders, including SCZ, bipolar disorder (BPD), and autism spectrum disorder (ASD). The individual genotyping and raw next-generation sequencing of transcriptomics and epigenomics are restricted for privacy protection, but access can be obtained upon approval. The protocols for all associated data are readily available (fig. S1). Finally, PsychENCODE has developed a reference brain project on the PFC by using matched assays on the same set of brain tissues, which we used to develop an anchoring annotation (21).
Fig. 1. Comprehensive data resource for functional genomics of the human brain.

The functional genomics data generated by the PsychENCODE Consortium (PEC) constitute a multidimensional exploration across tissue, developmental stage, disorder, species, assay, and sex. The central data cube represents the results of our data integration for the three dimensions of disorder, assay, and tissue, where the numbers of datasets in the analysis are depicted. Projections of the data onto each of these three parameters are shown as graphs for assay and disorder and as a schematic for the primary brain regions of interest. Assay: Dataset numbers for a subset of assays are shown, including RNA-seq (2040 PsychENCODE samples and 1632 GTEx samples, used in multiple downstream analyses), genotypes (1362 PsychENCODE and 25 GTEx individuals for a total of 1387 individuals matched to RNA-seq samples for QTL analysis after quality control filtering), and H3K27ac ChIP-seq (408 PsychENCODE and 5 Roadmap samples). The number of cells assayed by small conditional RNA sequencing (scRNA-seq) (right-hand y axis) is 18,025 for PsychENCODE and 14,012 for external (ext.) datasets. Disorder: Across all assays, there are 113 GTEx and 926 PsychENCODE control individuals and 558 SCZ, 217 BPD, 44 ASD, and 8 affective disorder (AFF) individuals from PsychENCODE, resulting in 1866 individuals. Tissue: Three brain regions are considered—the PFC (n = 26,769 samples), TC (n = 2153 samples), and CB (n = 348 samples). See table S11 and (19) for more details. HBCC, Human Brain Collection Core.
Transcriptome analysis: Bulk and single cell
To identify the genomic elements exhibiting transcriptional activities specific to the brain, we took a conservative approach and used the standardized and established ENCODE pipeline to uniformly process RNA-seq data from PsychENCODE, GTEx, and Roadmap (figs. S2 and S3). This consistency makes our expression data and subsequent results (including eQTLs and single-cell analyses) comparable with previous work. Using these data, we identified noncoding regions of transcription and sets of differentially expressed and coexpressed genes (21, 22).
Brain tissue is composed of a variety of basic cell types. Gene expression changes observed at the tissue level may be due to changes in the proportions of basic cell types (23–28). However, it is unclear how these changes in cell proportions can contribute to the variation in tissue-level gene expression observed across a population of individuals. To address this question, we used two complementary strategies across our cohort of 1866 individuals.
First, we used standard pipelines to uniformly process single-cell RNA-seq data from PsychENCODE, in conjunction with other single-cell studies on the brain (14, 16, 20). Then we assembled profiles of brain cell types, including both excitatory and inhibitory neurons (denoted as Ex1 to Ex9 and In1 to In8, respectively, according to previous conventions), major nonneuronal types (e.g., microglia and astrocytes), and additional cell types associated with development (21). Depending on the underlying sequencing and quantification, our profiles were of two fundamentally different formats, transcripts per kilobase million (TPM) and unique molecular identifier (UMI) counts. The former (TPM profiles) includes the uniformly processed PsychENCODE developmental single-cell data merged with published adult and developmental data (fig. S4 and table S2) (14, 16). By contrast, the UMI profiles are built by merging PsychENCODE adult single-cell profiles with other recently published data-sets (14). Both formats share common neuronal and major nonneuronal cell types and are used interchangeably in various analyses in this study (fig. S5 and tables S3 and S4). Moreover, the expression values of biomarker genes for the same cell type were correlated between two formats (figs. S6 and S7). However, our TPM profiles have additional development-specific cell types, such as quiescent and replicating.
From both sets of profiles, we can generate a matrix C of expression signatures, comprising marker genes and their expression levels across various cells (fig. S8). In this matrix, a number of genes (e.g., the gene for dopamine receptor DRD3) had expression levels that varied more across cell types than they did in bulk tissue measurements across individuals in a population (Fig. 2A). This suggests that cell-type changes across individuals could contribute substantially to variation in individual bulk expression levels.
Fig. 2. Deconvolution analysis of bulk and single-cell transcriptomics reveals cell fraction changes across the population.

(A) Genes had significantly higher expression variability across single cells sampled from different types of brain cells than across equivalent tissue samples taken from a population of individuals. (Left) Dopamine gene DRD3. (B) The heatmap shows the Pearson correlation coefficients of gene expression between the NMF-TCs and single-cell signatures (for n = 457 biomarker genes) (15). Micro, microglia; OPC, oligodendrocyte progenitor cells; endo, endothelial cells; astro, astrocytes; oligo, oligodendrocytes; peri, pericytes; quies, quiescent cells; repl, replicating cells. (C) (Top) The bulk tissue gene expression matrix (B, genes by individuals) can be decomposed by NMF (see fig. S52). (Bottom) The bulk tissue gene expression matrix B can be also deconvolved by the single-cell gene expression matrix (C, genes by cell types) to estimate the cell fractions across individuals (the matrix W); i.e., B ≈ CW. The three major cell types analyzed are depicted with neuronal cells in red, nonneuronal cells in blue, and developmental cells in green, as highlighted by column groups in matrix C (also row groups in W). frac, fraction. (D) The estimated cell fractions can account for >88% of the bulk tissue expression variation across the population. (E) Cell fraction changes across genders and brain disorders. **Differences from control samples are significant (via a Kolmogorov-Smirnov test) after accounting for age distributions. See table S12 for more detail. CTL, control. (F) Changing cell fractions (for Ex3), gene expression (for SST), and promoter methylation level (median level, for SST) across age groups are shown. With increasing age, the fractions of Ex3 and Ex4 significantly increase, and some nonneuronal types decrease (Ex3 trend analysis, P < 6.3 × 10⁻¹⁰).
Second, we used an unsupervised analysis to identify the primary components of bulk expression variation. We decomposed the bulk gene expression matrix by using nonnegative matrix factorization (NMF) (B ≈ VH, where B, V, and H represent matrices) and determined whether the top components (NMF-TCs), capturing the majority of covariance (columns of V) (Fig. 2B), were consistently associated with the single-cell signatures (Fig. 2C) (21). A number of NMF-TCs were, in fact, highly correlated with cell types from matrix C for both TPM and UMI data—e.g., component NMF-17 is correlated with the Ex2 cell type (correlation coefficient r = 0.63) (Fig. 2C and fig. S9). This demonstrates that an unsupervised analysis derived solely from bulk data can roughly recapitulate the single-cell signatures, partially corroborating them.
We then examined how variation in the proportions of basic cell types contributes to variation in bulk expression. To this end, we estimated the relative proportions of various cell types (“cell fractions”) for each tissue sample. In particular, we deconvolved the bulk tissue-level expression matrix by using the single-cell signatures to estimate cell fractions across individuals (matrix W), solving B ≈ CW (Fig. 2B) (21). As a validation, our estimated fractions of NEU+/− cells matched the experimentally determined fractions from reference brain samples (median difference = 0.04) (fig. S10). Overall, our analyses demonstrated that variation in cell types contributed substantially to bulk variation. That is, weighted combinations of single-cell signatures could account for most of the population-level expression variation, with an accuracy of >88% (Fig. 2D) (1 − ||B − CW||2/||B||2 > 88%), and when calculated on a per-person basis, this quantity varies ±4% over the 1866 individuals in our cohort (figs. S11 and S12). Also, our results explained more variation than previous deconvolution approaches (fig. S13) (21).
We identified cell fraction changes associated with different traits (Fig. 2E and figs. S14 to S17). For example, particular types of excitatory and inhibitory neurons (such as In6) are present different fractions in male and female samples (Fig. 2E). Also, in individuals with ASD, the fraction of Ex5 was higher and that of oligodendrocytes, lower, with some commensurate increase for microglia and astrocytes (Fig. 2E and fig. S18) (24, 29).
Lastly, we observed an association with age. In particular, with increasing age, the fractions Ex3 and Ex4 significantly increased and the fractions of some nonneuronal types decreased (Fig. 2F and fig. S19). These changes may be associated with differential expression of specific genes, e.g., the gene for somatostatin (SST), known to be associated with aging and neurotransmission (Fig. 2F) (30). Also, SST exhibits increasing promoter methylation with age, perhaps explaining its decreasing expression. Other genes known to be associated with brain aging, such as those for EGR1 (early growth response) and CP (ceruloplasmin), exhibit different trends (Fig. 2F and figs. S20 and S21) (21, 31).
Enhancers
To annotate brain-active enhancers, we used chromatin modification data from the reference brain, supplemented by deoxyribonuclease sequencing (DNase-seq) and ChIP-seq data from Roadmap PFC samples. All data were processed by standard ENCODE ChIP-seq pipelines to ensure maximal compatibility of our results (fig. S22). Consistent with ENCODE, we define active enhancers as open chromatin regions enriched in H3K27ac (histone H3 acetylation at lysine 27) and depleted in H3K4me3 (histone H3 trimethylation at lysine 4) (Fig. 3A and fig. S23) (21). Overall, we annotated a reference set of 79,056 enhancers in the PFC. [We also provide a filtered subset (21).]
Fig. 3. Comparative analysis of transcriptomics and epigenomics between the brain and other tissues.

(A) Epigenetics signals of the reference brain (purple) were used to identify active enhancers with the ENCODE enhancer pipeline. The H3K27ac signal tracks at the corresponding enhancer region from each individual in the cohort are shown in green, with the gradient showing the normalized signal value for each H3K27ac peak. (B) The overlap of the H3K27ac peaks from an individual in the population with the reference brain enhancers is shown as a Venn diagram. The histogram shows the varying percentages of overlapped H3K27ac peaks across individuals. (C) The tissue clusters of RCA coefficients [principal component 1 (PC1) versus PC2] for chromatin data of any potential regulatory elements are shown. Clusters of PsychENCODE samples (dark green ellipses), external brain samples (light green ellipses), and other non-brain tissues (magenta ellipses) are plotted. (D) The extent of transcription for coding (arrowhead) and noncoding (diamond) regions. The average transcription extent (x axis) is shown compared with the cumulative extent of transcription across a cohort of individuals (y axis) for select tissue types, including the CB, cortex, lung, skin, and testis, by using polyadenylate RNA-seq data. (E and F) Similar to (C), but now for transcription rather than epigenetics. (E) RCA coefficients for gene expression data from PsychENCODE, GTEx brains, and other tissue samples are shown in dark green, light green, and magenta, respectively. (F) The center (cross) and ranges of different tissue clusters (dashed ellipses) are shown on an RCA scatterplot of (E).
Assessing the variability across individuals and tissues is more difficult for enhancers than for gene expression (32). Not only is the variability in chromatin-mark level at enhancers across different individuals and tissues high, but the boundaries of enhancers can grow and shrink, sometimes disappearing altogether (e.g., for H3K27ac) (Fig. 3A). To investigate this in more detail, we uniformly processed the H3K27ac data from the PFC, temporal cortex (TC), and cerebellum (CB) on a cohort of 50 individuals, primarily of European descent and sequenced to similar depths (21) (fig. S24). Aggregating data across the cohort resulted in a total of 37,761 H3K27ac “peaks” (enriched regions) in the PFC, 42,683 in the TC, and 26,631 in the CB—where each peak is present in more than half of the individuals surveyed. In a comparison of aggregated sets for these three brain regions, the PFC was more similar to the TC than the CB (~90% versus 34% overlap in peaks). This difference is consistent with previous reports and suggests potentially different cell-type composition in the CB and the cortex (33, 34).
We also examined how many of the enhancers in the reference brain are active (i.e., have enriched H3K27ac) in each of the individuals in our cohort. As expected, not every reference enhancer was active in each individual. On average, only ~70% ± 15% (~54,000) of the enhancers in the reference brain were active in an individual in the cohort, and a similar fraction of the reference enhancers was active in more than half the cohort (68%) (Fig. 3B). To estimate the total number of enhancers in the PFC, we calculated the cumulative number of active regions across the cohort (fig. S25). This increased for the first 20 individuals sampled but saturated at the 30th. Thus, we hypothesize that pooling PFC enhancers from ~30 individuals is sufficient to cover nearly all possible PFC enhancer regions, estimated at ~120,000.
Consistent comparison: Transcriptome and epigenome
As we uniformly processed the transcriptomic and epigenomic data across the PsychENCODE, ENCODE, GTEx, and Roadmap datasets, we could compare the brain with other organs in a consistent fashion and also compare transcriptome variation with that of the epigenome (Fig. 3, C to F). Several approaches, including principal components anaylsis (PCA), t-distributed stochastic neighbor embedding (t-SNE), and reference component analysis (RCA), were tested to determine the best method for comparison. We found that, although popular and interpretable, PCA deemphasizes local structure and is overly influenced by outliers; by contrast, t-SNE preserves local relationships but “shatters” global structure. RCA is a compromise (21): It captures local structure while maintaining meaningful distances globally. We used RCA to project gene expression from PsychENCODE samples against a reference panel of gene expression for different tissues derived from GTEx and then reduced the dimensionality of the projections with PCA. RCA thus allowed us to represent high-dimensional expression data in a simple two-coordinate diagram.
For gene expression, RCA revealed that the brain separates from the other tissues in the first component (Fig. 3E and fig. S26). In particular, for the brain, intertissue comparisons exhibit more differences than intratissue ones (figs. S27 to S30). A different picture emerged for chromatin. The H3K27ac chromatin levels at all regulatory positions were, overall, less distinguishable between the brain and other tissues (Fig. 3C) (21). At first glance, this is surprising, as one expects great differences in enhancer usage between tissues. However, our analysis compares chromatin signals over all regulatory elements from ENCODE (including enhancers and promoters), which is logically consistent with our expression comparison across all protein-coding genes (Fig. 3, F versus C, and tables S5 to S7). As the total number of human regulatory elements is much larger than the number of brain-active enhancers (~1.3 million versus ~79,000), our results likely reflect the fact that there are proportionately fewer brain-active regulatory elements than protein-coding genes (6% versus 60%).
Up to this point, our analysis has focused on annotated regions (genes, promoters, and enhancers). However, in addition to the canonical expression differences in protein-coding genes, we also found differences in unannotated noncoding and intergenic regions (fig. S30). In particular, testes and lung have the largest extent of transcription overall (the most genes transcribed) for protein-coding genes (Fig. 3D). However, when we shift to unannotated regions, the ordering changes: Brain tissues, such as the cortex and CB, now have a greater extent of transcription than any other tissue.
QTL analysis
We used the data in the brain resource to identify QTLs affecting gene expression and chromatin activity. We calculated expression, splicing-isoform, chromatin, and cell fraction QTLs (eQTLs, isoQTLs, cQTLs, and fQTLs, respectively). For eQTLs, we adopted a standard approach, closely adhering to the GTEx pipeline for maximal compatibility (figs. S31 to S33) (35). (However, for maximal utility of the resource, we also provide alternate lists, filtered more conservatively.) In the PFC, we identified ~2.5 million cis-eQTLs involving ~33,000 eGenes (expressed genes) [~17,000 noncoding and ~16,000 coding, with a false discovery rate of <0.05] (Fig. 4A). We found 1,341,182 eQTL single-nucleotide polymorphisms (SNPs) from ~5.3 million total SNPs tested in 1-Mb windows around genes, constituting 238,194 independent SNPs after linkage-disequilibrium (LD) pruning. This estimate identified substantially more eQTLs and associated eGenes than previous studies, reflecting our large sample size (8, 11, 21). The number of eGenes, in fact, approaches the total number of genes estimated to be expressed in the brain. That said, a very large fraction of the smaller GTEx and CMC brain eQTL sets was contained within our set (as evident from overlap testing with the π1 statistic) (Fig. 4A) (36). Moreover, as expected, our brain eQTL set showed higher π1 similarity to and SNP-eGene overlap with GTEx brain eQTLs than with those from other tissues (Fig. 4B and fig. S31). Lastly, we applied the QTL pipeline to isoform levels to calculate a set of isoQTLs. We performed filtering in a variety of different ways, generating a number of different lists (21).
Fig. 4. QTLs in the adult brain.

(A) The frequency of genes with at least one eQTL (eGenes) is shown across different studies. The number of eGenes increased as the sample size increased. PsychENCODE eGenes are close to saturation for protein-coding genes. The estimated replication π1 values for GTEx and CMC eQTLs versus PsychENCODE are shown (36). (B) The similarity between PsychENCODE brain dorsolateral PFC (DLPFC) eQTLs and GTEx eQTLs of other tissues are evaluated by π1 values and SNP-eGene overlap rates. Both π1 values and SNP-eGene overlap rates are higher for brain DLPFC than for the other tissues. (C) An example of an H3K27ac signal across individuals in a representative genomic region, showing largely congruent identification of regions of open chromatin. The region within the dashed rectangle represents a cQTL; the signal magnitudes for individuals with a G/G or G/Tgenotype were lower than those for individuals with a T/Tgenotype. chr1, chromosome 1; rs, reference SNP. (D) An example of the mechanism by which an fQTL may affect phenotype. This fQTL overlaps with an eQTL for FZD9, a gene located in the 7q11.23 region that is deleted in Williams syndrome. The fQTL may affect the fraction of Ex3 by regulating FZD9 expression. Only Ex3 constitutes a statistically significant fQTL with this SNP (as designated by the asterisk). ref, reference; alt, alternate. (E) The enrichment of QTLs in different genomic annotations is shown. Pink circles indicate highly significant enrichment (P < 1 × 10⁻²⁵ and OR > 2.5). OR, odds ratio; TFBS, TF binding site; UTR, untranslated region. (F) Numbers of identified QTL-associated elements (eGenes, enhancers, and cell types) and QTL SNPs are shown in the bottom left table. Asterisks indicate that, for cQTLs, we show only the number of top SNPs for each enhancer. Overlaps of all QTL SNPs are shown in heatmaps (square rows). The linked circles show the overlap of QTL types. The intersections of other QTLs with eQTLs are evaluated by using π1 values in the orange bar plot. The greatest intersection is between cQTLs and eQTLs. An example is displayed on the right: the intersection of eQTL SNPs (for the MTOR gene) and cQTL SNPs (for the H3K27ac signal on an enhancer ~50 kb upstream of the gene). Hi-C interactions (bottom) indicate that the enhancer interacts with the promoter of MTOR, suggesting that the cQTL SNPs potentially mediate the expression modulation manifest by the eQTL SNPs.
For cQTLs, no established methods exist for large-scale data, although there have been previous efforts (37, 38). To identify cQTLs, we focused on our reference set of enhancers and examined how H3K27ac activity varied at these loci across 292 individuals (Fig. 4C) (21). Overall, we identified ~2000 cQTLs in addition to 6200 identified from individuals within the CMC cohort (39).
We next identified SNPs associated with changes in the relative abundances of specific cell types. We refer to such relationships with the term fQTLs. In total, we identified 1672 distinct SNPs constituting 4199 fQTLs (fig. S34). The excitatory neurons Ex4 and Ex5 were associated with the most fQTLs (1060 and 896, respectively). The biological mechanism governing an fQTL may involve other QTL types, such as eQTLs. An illustrative example is the FZD9 gene (Fig. 4D): We found that the expression levels of this gene were associated with a neighboring noncoding SNP via an eQTL, and this same SNP was associated with the proportion of Ex3 cells via an fQTL. Perhaps connected to this, deletion variants upstream of FZD9 had previously been associated with cell fraction changes related to Williams syndrome (40).
Next, we attempted to recalibrate the observed gene expression variation by considering fQTLs. In particular, our scheme described above for approximately deconvolving gene expression from heterogeneous bulk tissue (matrix B) into single-cell signatures (matrix C) and estimated cell fractions (matrix W) enables us to calculate the residual gene expression (Δ) remaining after accounting for cell fraction changes (Fig. 2). Specifically, it is the component of the bulk tissue expression variation that cannot be explained by the changing cell fractions alone: Δ = B − CW. We can subsequently use this quantity to determine “residual QTLs” by directly correlating it with genotype. In total, this results in 202,940 SNPs involved in residual eQTLs. Potentially, one can elaborate on this further by allowing the correlations to be done in a cell-type–specific fashion (fig. S35).
To further dissect the associations between genomic elements and QTLs, we compared all of the different types of QTLs with one another and with genomic annotations (Fig. 4E). As expected, eQTLs tended to be enriched at promoters, and cQTLs, at enhancers and transcription factor (TF)–binding sites; fQTLs were spread over many different elements. Also, an appreciable number of eQTLs were enriched on the promoter of a different gene from the one regulated, suggesting the activity of an Epromoter, a regulatory element with dual promoter and enhancer functions (41). For the overlap among different QTLs, we expected that most cQTLs and fQTLs would be a subset of the much larger number of eQTLs; somewhat surprisingly, an appreciable number of these did not overlap (Fig. 4F). To evaluate this precisely, we calculated π1 statistics and found that the cQTL overlap was larger than the fQTL overlap (0.89 versus 0.11). Moreover, eQTL-cQTL overlaps often suggested that the expression-modulating function of an eQTL derived from chromatin changes (e.g., for MTOR) (Fig. 4F). Overall, the total number of overlapping QTLs was 2477 (which we dub multi-QTLs) (Fig. 4F).
Regulatory networks
We next integrated the genomic elements described above into a regulatory network. We first processed a Hi-C dataset for adult brain in the same reference samples used for enhancer identification, providing a physical basis for interactions between enhancers and promoters (Fig. 5A and table S8) (13, 21). In total, we identified 2735 topologically associating domains (TADs) and ~90,000 enhancer-promoter interactions (fig. S36). As expected, ~75% of enhancer-promoter interactions occurred within the same TAD, and genes with more enhancers tended to have higher expression (Fig. 5B and fig. S36). We integrated the Hi-C data with QTLs; surprisingly, QTLs involving SNPs distal to eGenes but linked by Hi-C interactions showed significantly stronger associations (as indicated by the QTL P value) than those with SNPs directly in the eGene promoter or exons (Fig. 5C and fig. S37).
Fig. 5. Building a gene regulatory network (GRN) from Hi-C and data integration.

(A) A full Hi-C dataset from adult brain reveals the higher-order structure of the genome, ranging from contact maps (top) to TADs and promoter-based interactions. (Bottom) A schematic of how we leveraged gene regulatory linkages involving TADs, TFs, enhancers (Enh), and target genes (TG) to build a full GRN (fig. S42) and a high-confidence subnetwork consisting of 43,181 TF–to–target gene promoter and 42,681 enhancer–to–target gene promoter linkages (21). (B) We compared the number of genes (left y axis, dotted line) and the normalized gene expression levels (right y axis, boxes) with the number of enhancers that interact with the gene promoters. Boxes show means and SDs. (C) QTLs that were supported by Hi-C evidence (174,719) showed more significant P values than those that were not (promoter or exonic QTLs, 130,155; nonsupported QTLs, 1,065,311). (D) Cross-tissue comparison of chromatin architecture indicates that adult brains in PsychENCODE and Roadmap (e.g., DLPFC and hippocampus tissues) share chromatin architecture more than nonrelated tissue types. Fetal brain shows chromatin architecture distinct from that in adult brain, indicating extensive rewiring of chromatin structures during brain development. ES, embryonic stem cell. (E) Genes assigned to fetal active elements are prenatally enriched, whereas genes assigned to adult active elements are postnatally enriched. (F) Genes assigned to fetal active elements are relatively more enriched in neurons in the adult brain and fetal (developmental) brain, whereas genes assigned to adult active elements are relatively more enriched in glia (adult astrocytes, endothelial cells, and oligodendrocytes). Ex. N, excitatory neuron; Int. N, inhibitory neuron; IPC, intermediate progenitor cells; NEP, neuroepithelial cells; trans, transient cell type. (G) The circos plots show the linkages from the full regulatory network targeting the cell-type–specific biomarker genes. The biomarker genes for excitatory or inhibitory neuronal type are the biomarker genes shared by at least five excitatory or inhibitory subtypes (20). Selected TFs for particular cell types are highlighted.
To gain insights into the brain chromatin, we compared the adult PsychENCODE Hi-C dataset with those from other tissues in a similar fashion to the transcriptomic and epigenomic comparisons described above. In particular, we selected a set of tissues and cell types from ENCODE and Roadmap, consistently processed their associated Hi-C data at a low resolution, and compared them with our reference-brain Hi-C data. As expected, we found that all the samples for adult brain regions tend to separate markedly from the other tissues in terms of A-B compartment similarity and other metrics (Fig. 5D and fig. S38).
In addition to data for the adult brain, we also added PsychENCODE Hi-C data for the fetal brain into the comparison, assessing the degree to which the chromatin differences between developmental stages relate to those between tissues (Fig. 5D). We found that whereas Hi-C datasets for the adult brain clustered together, the Hi-C dataset for the fetal brain was distinct (Fig. 5D and fig. S39). Only ~31% of the interactions in our adult Hi-C data were detected in the fetal dataset (figs. S39 and S40) (13). Though hard to exactly quantify, this difference appears to be larger than that seen from cross-tissue transcriptome comparison, with fetal samples included (fig. S41). We did a number of other comparisons between fetal and adult brain Hi-C datasets, analyzing the regulatory elements and genes linked by each. As expected, we found fetus-linked genes to be more highly expressed prenatally and adult-linked ones postnatally (Fig. 5E). In addition, the fetus-linked genes were preferentially expressed in developmental cell types (Fig. 5F). They were also highly expressed in adult neurons, whereas the adult-linked ones were preferentially expressed in glia, reflecting known cell-type composition (Fig. 5, D and F) (42).
In addition to Hi-C linkages, we tried to find further regulatory connections by relating the activity of TFs to target genes (Fig. 5A). In particular, for each potential target of a TF, we created a linkage if it had a “good binding site” (matching the TF’s motif) in gene-proximal open chromatin regions (either promoters or brain-active enhancers) and if it had a high coefficient in a regularized, elastic net regression, relating TF activity to target expression (fig. S42) (21). Elastic net regression assumes that target gene expression is determined by a linear combination of the expression levels of its regulating TFs, via regression coefficients (using sparsified L1 and L2 regularization). Overall, we found that a subset of regulatory connections could predict the expression of 8930 genes with a mean square error (MSE) of <0.05 (fig. S43). For example, we could predict the expression of the ASD-associated gene CHD8 with MSE = 0.034 (equivalent to coefficient of determination R2 = 0.77 over the population) (21). Lastly, the enhancer-binding TFs with high regression coefficients—implying a high chance for TF regulation of the target genes via particular bound enhancers—provide a third set of putative enhancer-to-gene links.
Collectively, we generated a full regulatory network, linking enhancers, TFs, and target genes (fig. S42). This includes 43,181 proximal and 42,681 distal linkages involving 11,573 protein-encoding target genes (TF–to–target gene via promoter for proximal versus via enhancer–target gene connection for distal) (Fig. 5A) (15, 21). As functioning regulatory connections reflect cell type, we also generated potential cell-type–specific regulatory networks (Fig. 5, F and G, and fig. S44). In these, we found a number of well-known TFs associated with brain development—e.g., NEUROG1, DLGAP2, and MEF2A for excitatory neurons and GAD1, GAD2, and LHX6 for inhibitory neurons (Fig. 5G) (43–46). Lastly, for broad utility on the resource website, we also provide an expanded regulatory network with slightly different parameterization (fig. S42).
Linking GWAS variants to genes
We used our regulatory network based on Hi-C, QTLs, and activity relationships to connect non-coding GWAS loci to potential disease genes. In particular, for the 142 SCZ GWAS loci, we identified a set of 1111 putative SCZ-associated genes, covering 119 loci (the SCZ genes) (Fig. 6A) (47). Of these, 321 constitute a “high-confidence” set supported by more than two evidence sources (e.g., QTLs and Hi-C) (Fig. 6, A and B, and fig. S45); examples include the CHRNA2 and CACNA1C genes (Fig. 6, B and C). Overall, the SCZ genes represent an increase from the 22 genes reported in an earlier QTL study and a larger number than can be linked simply by genomic proximity (176) (Fig. 6A) (11, 47). The majority of SCZ genes were not even in LD with the index SNPs (~67%, or 748 of 1111 genes with r2 < 0.6) (fig. S45), consistent with the fact that regulatory relationships often do not follow linear genome organization (13).
Fig. 6. GRNs assign genes to GWAS loci for psychiatric disorders.

(A) A schematic depicting how SCZ GWAS loci were assigned to putative genes. The number of SCZ GWAS loci and their putative target genes (SCZ genes) annotated by each assignment strategy is indicated (top). The overlap between SCZ genes defined by QTL associations (QTL), chromatin interactions (Hi-C), and activity relationships (activity) is depicted in a Venn diagram (bottom). SCZ genes with more than two evidence sources were defined as high-confidence (high conf.) genes. (B) A GRN of TFs, enhancers, and 321 SCZ high-confidence genes, on the basis of TF activity linkages. A subnetwork for CACNA1C is highlighted on the right. (C) An example of the evidence indicating that GWAS SNPs that overlap with CHRNA2 eQTLs also have chromatin interactions and activity correlations with the same gene. Orange dots refer to SNPs that overlap between eQTLs and GWAS plots. (D) TFs that are significantly enriched in enhancers (left) and promoters (right) of SCZ genes. FDR, false discovery rate. (E) SCZ genes show higher expression levels in neurons (particularly excitatory neurons) than in other cell types. (F) Brain disorder GWAS show stronger heritability enrichment in brain regulatory variants (eQTLs) and elements (enhancers) than non–brain disorder GWAS. ADHD, attention-deficit/hyperactivity disorder; T2D, type 2 diabetes; CAD, coronary artery disease; IBD, inflammatory bowel disease.
We then looked at the characteristics of the 1111 SCZ genes (and the high-confidence subset of 321). As expected, they shared many characteristics with known SCZ-associated genes, being enriched in translational regulators, cholinergic receptors, calcium channels, synaptic genes, SCZ differentially expressed genes, and loss-of-function-intolerant genes (fig. S45) (47). Next, we identified the TFs regulating the SCZ genes (on the basis of our regulatory network, either directly or via an enhancer) (Fig. 6D). These include LHX9 and SOX7, TFs critical for early cortical specification and neuronal apoptosis, respectively (48, 49). Lastly, we integrated the SCZ genes with single-cell profiles and found that they are highly expressed in neurons, particularly excitatory ones, consistent with the recent findings (Fig. 6E) (47).
In addition to SCZ, we also looked at other diseases linked by our regulatory network. In particular, we found aggregate associations between our brain eQTLs and enhancers and many brain disorder GWAS variants, much more so than for GWAS variants for non-brain diseases (Fig. 6F and table S9).
Integrative deep-learning model
The full interaction between genotype and phenotype involves many levels, beyond those encapsulated by the regulatory network. We addressed this by embedding our regulatory network into a larger multilevel model. In particular, we developed an interpretable deep-learning framework, the Deep Structured Phenotype Network (DSPN) (21). This model combines a Deep Boltzmann Machine architecture with conditional and lateral connections derived from the regulatory network (50). Traditional classification methods such as logistic regression predict phenotype directly from genotype, without using intermediates such as the transcriptome (Fig. 7A). In contrast, the DSPN is constructed via a series of intermediate models that add layers of structure. We included layers for intermediate molecular phenotypes associated with specific genes (i.e., their gene expression and chromatin state) and predefined gene groupings (cell-type marker genes and coexpression modules), multiple higher layers for inferred groupings (hidden nodes), and a top layer for observed traits (psychiatric disorders and other brain phenotypes). Finally, we used sparse inter- and intralevel connectivity to integrate our knowledge of QTLs, regulatory networks, and coexpression modules from the sections above (Fig. 7B). By using a generative architecture, we ensure that the model is able to impute intermediate phenotypes, as well as provide forward predictions from genotypes to traits.
Fig. 7. DSPN deep-learning model links genetic variation to psychiatric disorders and other traits.

(A) The schematic outlines the structure of the following models: logistic regression (LR), conditional Restricted Boltzmann Machine (cRBM), conditional Deep Boltzmann Machine (cDBM), and DSPN. Nodes are partitioned into four layers (L0 to L3) and colored according to their status as visible, visible or imputed (depending on whether nodes were observed or not at test time), or hidden. (B) DSPN structure is shown in further detail, with the biological interpretation of layers L0, L1, and L3 highlighted. The GRN structure learned previously (Fig. 5A) is embedded in layers L0 and L1, with different types of regulatory linkages and functional elements shown. Co-expr. mods., coexpression modules. (C) The performance of different models is summarized, with comparisons of performance across models of different complexity and of transcriptome versus genome predictors, corresponding to being with or without imputation for the DSPN (colors highlight relevant models for each comparison). Performance accuracy is shown first, with variance explained on the liability scale in brackets. All models were tested on identical data splits, which were balanced for predicted trait and covariates (including gender, ethnicity, age, and assay). RNA-seq, cell fraction, and H3K27ac data were binarized by thresholding at median values (per gene, cell type, and enhancer, respectively), as was age (median, 51 years) when predicted. LR-gene and LR-trans are logistic models using genetic and transcriptomic predictors, respectively; DSPN-impute and DSPN-full are models with imputed intermediate phenotypes (genotype predictors only) and fully observed intermediate phenotypes (transcriptome predictors), respectively. Differential performance is shown in terms of improvement above chance, with liability variance score increases in brackets. GEN, gender; ETH, ethnicity; AOD, age of individual at death.
Using the full model with the genome and transcriptome data provided, we demonstrated that the extra layers of structure in the DSPN allowed us to achieve substantially better trait prediction than traditional additive models (Fig. 7C). For instance, a logistic predictor was able to gain a 2.4-fold improvement when including the transcriptome versus using the genome alone (+9.3% for the transcriptome versus +3.8% for the genome, above a 50% random baseline). By contrast, the DSPN was able to gain a larger, 6-fold improvement (+22.9% versus +3.8%), which may reflect its ability to incorporate nonlinear interactions. This result clearly manifests that the transcriptome carries additional information, which the DSPN is able to extract. Moreover, the DSPN allows us to perform joint inference and imputation of intermediate phenotypes (i.e., transcriptome and epigenome) and observed traits from just the genotype alone, achieving a ~3.1-fold improvement over a logistic predictor in this context (Fig. 7C and fig. S46). Overall, these results demonstrate the usefulness of even a limited amount of functional genomic information for unraveling gene-disease relationships and show that the structure learned from such data can be used to make more accurate predictions of observed traits, even on samples for which intermediate phenotypes are imputed.
We transformed our results to the liability scale for comparison with narrow-sense heritability estimates (Fig. 7C) (21). Prior studies have estimated that common SNPs explain 25.6, 20.5, and 19% of the genetic variance for SCZ, BPD, and ASD, respectively (51). These may be taken as theoretical upper bounds for additive models, given unlimited common-variant data. By contrast, nonlinear predictors can exceed these limits. Our best liability scores (from just the genotype at QTL-associated variants) are substantially below these bounds, implying that additional data would be beneficial. By contrast, the variance explained by the full DSPN model exceeds that explained by common SNPs in SCZ and BPD, possibly reflecting the influence of rare variants and epistatic interactions (32.8 and 37.4% respectively—the variance of 11.3% for ASD is slightly lower). However, these estimates may be confounded by trait-associated variation that is environmental in origin (fig. S47).
A key aspect of the DSPN is its interpretability. In particular, we examined the specific connections learned by the DSPN between intermediate and high-level phenotypes. Here, we included coexpression modules in the model, referring to this modification as “DSPN-mod” (fig. S48). Using it, we determined which modules were prioritized, as well as the sets of genes associated with latent nodes that were found at each hidden layer (Fig. 8A and table S10) (15, 21). Broadly, we take an unbiased view of all 5024 modules and higher-order groupings constructed from these and then prioritize a subset of ~180 modules and groupings for each psychiatric disorder, showing these to be enriched in specific functional categories and to intersect substantially with the modules from more disease-focused analyses (Fig. 8, B and C, and fig. S49) (22). [For completeness, we provide a full table showing the prioritization and functional categories for all possible modules associated with various traits (fig. S50).] In particular, we found that cross-disorder prioritized modules are associated with functional categories such as “immune processes,” “synaptic activity,” and “splicing,” consistent with the findings from more disease-focused analyses (Fig. 8C) (22). Also, we showed that prioritized SCZ and BPD modules are enriched for known GWAS SNPs (fig. S51) (for ASD, the lack of GWAS SNPs precludes similar analyses). For SCZ, which is the best characterized of the three disorders, we find enrichments for pathways and genes known to be associated with the disease, including glutamatergic-synapse pathway genes, such as GRIN1; calcium-signaling pathway and astrocyte-marker genes; and complement cascade pathway genes such as C4A, C4B, and CLU (Fig. 8D) (22). Other prioritized modules include well-characterized genes such as MIAT, RBFOX1, and ANK2 (SCZ); RELA, NFkB2, and NIPBL (ASD); and HOMER1 (BPD), consistent with the results of (22). Finally, we identify modules associated with aging, finding that they are enriched in Ex4 neuronal cell-type genes, synaptic and longevity functions, and the gene NRGN—all consistent with differential expression analysis (Fig. 8D and fig. S20).
Fig. 8. Interpretation of the DSPN model highlights functional associations and shared disease mechanisms.

(A) The schematic illustrates the module (MOD) and higher-order grouping (HOG) prioritization schemes. Red and blue lines represent positive and negative weights, respectively, and full and dotted lines represent first and second ranks by absolute value [creating a directed acyclic graph (DAG) with branching factor 4, rooted at L3]. Highlighted nodes (gray) in L1d show positive prioritized MODs, for which a positive path (containing an even number of negative links) exists connecting the module to the SCZ node. a1/a2 and b1/b2 highlight “best positive paths” from a and b, respectively, to SCZ in terms of absolute rank score. Associated HOGs are defined for a1/a2, containing all nodes in L1d having a path in the DAG to a1 (respectively a2), which is identically signed to the best path from a to a1 (respectively a2) (21). Positive prioritized HOGs are associated with nodes on best paths from all positive prioritized MODs; negative prioritized MODs and HOGs are calculated similarly. (B) Summary of the functional annotation scheme. (i) A total of 5024 weighted gene coexpression network analysis (WGCNA) MODs (modules and submodules) are derived from multiple data splits. (ii) MODs are prioritized as in (A) for each disorder, and (iii) associated HOGs are calculated. (iv) Gene set enrichment analysis associates functional terms with all MODs and HOGs. (v) Terms are ranked per disorder by counting the number of prioritized MODs or HOGs they associate with, and broad functional categories are defined; (vi) prioritized MODs and HOGs are linked to potentially interesting genes, enhancers, and SNPs by using GRN connectivity. proc., processing. (C) Upper segment of cross-disorder ranking of Gene Ontology (GO) and Kyoto Encyclopedia of Genes and Genomes (KEGG) functional terms, where cross-disorder ranks are assigned by using the average per-disorder rank ordering. Ranking score levels and functional categories are as in the key in (B). Highlighted ranks and terms correspond to examples shown in (D). See fig. S49 for extended ranking. sig., signaling; staph., staphylococcus; inf., infection; dop., dopamine; cGMP-PKG, guanosine 3′,5′-monophosphate–cGMP-dependent protein kinase; int., interaction. (D) Examples of associations between prioritized MODs or HOGs and genes, enhancers, and SNPs for each disorder and age model. Associated functional terms and categories are as in (B). A table providing coordinates of eQTLs and cQTLs for all examples shown is provided in table S13. Chem. syn. trans., chemical synaptic transmission.
Conclusions
We have developed a comprehensive resource for functional genomics of the adult brain by integrating PsychENCODE data with a broad range of publicly available datasets. In closing, we review our main findings and ways that they can be improved in the future.
First, in terms of QTLs, we identified a set of eQTLs several times as large as those in previous studies, targeting a saturating proportion of protein-coding genes. Moreover, we were able to identify a substantial number of cQTLs. PsychENCODE was, in fact, among the first efforts to generate ChIP-seq data across a large cohort of brain samples, with experiments focused primarily on H3K27ac. In the future, further increasing cohort size and performing additional chromatin assays, such as STARR-seq (self-transcribing active regulatory region sequencing) and ChIP-seq for other histone modifications, will improve the identification of enhancers and cQTLs (52). More fundamentally, one-dimensional fluctuations in the chromatin signal reflect changes in three-dimensional chromatin architecture, and new metrics beyond cQTLs may be needed.
Second, in terms of single-cell analysis, we found that varying proportions of basic cell types (with different expression signatures) accounted for a large fraction of the expression variation across a population of individuals. However, this assumes that the expression levels characterizing a signature are fairly constant over a population of cells of a given cell type. In the future, larger-scale single-cell studies will allow us to examine this question in detail, perhaps quantifying and bounding environment-associated transcriptional variability. In addition, current single-cell techniques suffer from low sensitivity and dropouts; thus, it remains challenging to reliably quantify low-abundance transcripts (15, 53). This is particularly the case for specific brain cell substructures, such as axons and dendrites (15).
Third, we developed a comprehensive deep-learning model, the DSPN, and used it to illustrate how functional genomics data could improve the link between genotype and phenotype. In particular, by integrating regulatory-network connectivity and latent factors, the DSPN improves trait prediction over traditional additive models. Moreover, it takes into account dependencies between gene expression levels not modeled by univariate eQTL methods. In this study, we kept our eQTL methods very standard, closely following the GTEx paradigm. This separation we make between univariate eQTL detection and multivariate integrative modeling allows us to compare our eQTLs directly with those from previous analyses, such as the CMC study. However, multivariate-based methods for QTLs have been used elsewhere and, in the future, may be combined with our approach (54, 55).
Further, in the future, we can envision how our DSPN approach can be extended to modeling additional intermediate phenotypes. In particular, we can naturally embed in the middle levels of the model additional types of QTLs and phenotype-phenotype interactions—e.g., QTLs associated with microRNAs, neuroimaging, human-and primate-specific genes, and developmental brain enhancers (56–59).
We expect that the DSPN will improve accuracy mainly for complex traits with a highly polygenic architecture, but not necessarily for traits that are strongly determined by only a few variants, such as Mendelian disorders, or are closely correlated with population structure, such as ethnicity. However, even when the DSPN performance is low, it may still provide insights about intermediate phenotypes; for instance, in our analysis, the PFC transcriptome appears substantially less predictive with respect to gender (after removing the sex chromosome genes) than age, but this very fact highlights the similarity of the transcriptome between sexes (60). Finally, although our focus has been on common SNPs, the DSPN may be able to capture the effects of rare variants, such as those known to be implicated in ASD (51), through their influence on intermediate phenotypes.
In summary, our integrative analyses demonstrate the usefulness of functional genomics for unraveling molecular mechanisms in the brain (21, 61), and the results of these analyses suggest directions for further research into the etiology of brain disorders.
Materials and methods summary
The materials and methods for each section of the main text are available in the section with same heading in the supplementary materials (21); i.e., supplementary content for a given main text section within the supplementary materials is named in a parallel fashion. Detailed data protocols are available in the supplementary materials. Moreover, associated and derived data files are available at the PsychENCODE resource site (19). Often we provide multiple versions of the derived summary files with different parameterizations (e.g., for the single-cell profiles and for eQTLs).
Supplementary Material
ACKNOWLEDGMENTS
Funding: Data were generated as part of the PsychENCODE Consortium, supported by U01MH103339, U01MH103365, U01MH103392, U01MH103340, U01MH103346, U01MH116492, R01MH105472, R01MH094714, R01MH105898, R01MH110920, R01MH110905, R01MH110926, R01MH110927, R01MH110928, R01MH109715, R01MH111721, R21MH102791, R01MH110921, R01MH109677, R21MH105881, R21MH103877, R21MH109956, R21MH105853, and P50MH106934, awarded to S.A. (Icahn School of Medicine at Mount Sinai); A. Chess (Icahn School of Medicine at Mount Sinai); G.E.C. (Duke University); S. Dracheva (Icahn School of Medicine at Mount Sinai); P. Farnham (University of Southern California); Z.W. (UMass Medical School); M.B.G. (Yale University); D.H.G. (University of California–Los Angeles); F. Goes (Johns Hopkins University); T. M. Hyde (Lieber Institute for Brain Development); A.E.J. (Lieber Institute for Brain Development); J.A.K. (SUNY Downstate Medical Center); C. Liu (SUNY Upstate Medical University); D. Pinto (Icahn School of Medicine at Mount Sinai); P.R. (Icahn School of Medicine at Mount Sinai); N.S. (Yale University); P. Sklar (Icahn School of Medicine at Mount Sinai); M. State (University of California–San Francisco); P. Sullivan (University of North Carolina); F. Vaccarino (Yale University); D. Weinberger (Lieber Institute for Brain Development); S. Weissman (Yale University); K.P.W. (University of Chicago); A. J. Willsey (University of California–San Francisco); and P. Zandi (Johns Hopkins University), L. Mangravite and M.P. (Sage Bionetworks), and A. Arguello, L. Bingaman, T. Lehner, D. Panchision, and G. Senthil (NIMH). A subset of the transcriptome (RNA-seq) data was generated as part of the CMC, supported by funding from Takeda Pharmaceuticals, F. Hoffman–La Roche, and NIH grants R01MH085542, R01MH093725, P50MH066392, P50MH080405, R01MH097276, RO1-MH-075916, P50M096891, P50MH084053S1, R37MH057881, R37MH057881S1, HHSN271201300031C, AG02219, AG05138, and MH06692. Brain tissue for the study was obtained from the following brain bank collections: the Mount Sinai NIH Brain and Tissue Repository, the University of Pennsylvania Alzheimer’s Disease Core Center, the University of Pittsburgh NeuroBioBank and Brain and Tissue Repositories, and the NIMH Human Brain Collection Core. CMC leadership is as follows: P. Sklar and J. Buxbaum (Icahn School of Medicine at Mount Sinai), B. Devlin and D. Lewis (University of Pittsburgh), R. Gur and C.-G. Hahn (University of Pennsylvania), K. Hirai and H. Toyoshiba (Takeda Pharmaceuticals), E. Domenici and L. Essioux (F. Hoffman–La Roche), L. Mangravite and M.P. (Sage Bionetworks), and T. Lehner and B. Lipska (NIMH). Z.H.G. is supported by NIH/NIAID grant U19AI118610.
Footnotes
Competing interests: G.E.C. is a co-founder of Element Genomics. K.P.W. is associated with Tempus Labs. The other authors declare no competing interests.
Data and materials availability: All data are available in the main text or the supplementary materials. Associated data files are available under individual file identifiers at the PsychEncode resource site (19).
Contributor Information
PsychENCODE Consortium:
Allison E. Ashley-Koch, Gregory E. Crawford, Melanie E. Garrett, Lingyun Song, Alexias Safi, Graham D. Johnson, Gregory A. Wray, Timothy E Reddy, Fernando S. Goes, Peter Zandi, Julien Bryois, Andrew E. Jaffe, Amanda J. Price, Nikolay A. Ivanov, Leonardo Collado-Torres, Thomas M. Hyde, Emily E. Burke, Joel E. Kleiman, Ran Tao, Joo Heon Shin, Schahram Akbarian, Kiran Girdhar, Yan Jiang, Marija Kundakovic, Leanne Brown, Bibi S. Kassim, Royce B. Park, Jennifer R Wiseman, Elizabeth Zharovsky, Rivka Jacobov, Olivia Devillers, Elie Flatow, Gabriel E. Hoffman, Barbara K. Lipska, David A. Lewis, Vahram Haroutunian, Chang-Gyu Hahn, Alexander W. Charney, Stella Dracheva, Alexey Kozlenkov, Judson Belmont, Diane DelValle, Nancy Francoeur, Evi Hadjimichael, Dalila Pinto, Harm van Bakel, Panos Roussos, John F. Fullard, Jaroslav Bendl, Mads E. Hauberg, Lara M Mangravite, Mette A. Peters, Yooree Chae, Junmin Peng, Mingming Niu, Xusheng Wang, Maree J. Webster, Thomas G. Beach, Chao Chen, Yi Jiang, Rujia Dai, Annie W. Shieh, Chunyu Liu, Kay S. Grennan, Yan Xia, Ramu Vadukapuram, Yongjun Wang, Dominic Fitzgerald, Lijun Cheng, Miguel Brown, Mimi Brown, Tonya Brunetti, Thomas Goodman, Majd Alsayed, Michael J. Gandal, Daniel H. Geschwind, Hyejung Won, Damon Polioudakis, Brie Wamsley, Jiani Yin, Tarik Hadzic, Luis De La Torre Ubieta, Vivek Swarup, Stephan J. Sanders, Matthew W. State, Donna M. Werling, Joon-Yong An, Brooke Sheppard, A. Jeremy Willsey, Kevin P. White, Mohana Ray, Gina Giase, Amira Kefi, Eugenio Mattei, Michael Purcaro, Zhiping Weng, Jill Moore, Henry Pratt, Jack Huey, Tyler Borrman, Patrick F. Sullivan, Paola Giusti-Rodriguez, Yunjung Kim, Patrick Sullivan, Jin Szatkiewicz, Suhn Kyong Rhie, Christoper Armoskus, Adrian Camarena, Peggy J. Farnham, Valeria N. Spitsyna, Heather Witt, Shannon Schreiner, Oleg V. Evgrafov, James A. Knowles, Mark Gerstein, Shuang Liu, Daifeng Wang, Fabio C. P. Navarro, Jonathan Warrell, Declan Clarke, Prashant S. Emani, Mengting Gu, Xu Shi, Min Xu, Yucheng T. Yang, Robert R. Kitchen, Gamze Gürsoy, Jing Zhang, Becky C. Carlyle, Angus C. Nairn, Mingfeng Li, Sirisha Pochareddy, Nenad Sestan, Mario Skarica, Zhen Li, Andre M. M. Sousa, Gabriel Santpere, Jinmyung Choi, Ying Zhu, Tianliuyun Gao, Daniel J. Miller, Adriana Cherskov, Mo Yang, Anahita Amiri, Gianfilippo Coppola, Jessica Mariani, Soraya Scuderi, Anna Szekely, Flora M. Vaccarino, Feinan Wu, Sherman Weissman, Tanmoy Roychowdhury, and Alexej Abyzov
REFERENCES AND NOTES
- 1.Kessler RC et al. , Design and field procedures in the US National Comorbidity Survey Replication Adolescent Supplement (NCS-A). Int. J. Methods Psychiatr. Res 18, 69–83 (2009). doi: 10.1002/mpr.279; pmid: 19507169 [DOI] [PMC free article] [PubMed] [Google Scholar]
- 2.Wilson PW et al. , Prediction of coronary heart disease using risk factor categories. Circulation 97, 1837–1847 (1998). doi: 10.1161/01.CIR.97.18.1837; pmid: 9603539 [DOI] [PubMed] [Google Scholar]
- 3.Weinstein JN et al. , The Cancer Genome Atlas Pan-Cancer analysis project. Nat. Genet 45, 1113–1120 (2013). doi: 10.1038/ng.2764; pmid: 24071849 [DOI] [PMC free article] [PubMed] [Google Scholar]
- 4.Lloyd-Jones DM et al. , Prediction of lifetime risk for cardiovascular disease by risk factor burden at 50 years of age. Circulation 113, 791–798 (2006). doi: 10.1161/CIRCULATIONAHA.105.548206; pmid: 16461820 [DOI] [PubMed] [Google Scholar]
- 5.Stratton MR, Campbell PJ, Futreal PA, The cancer genome. Nature 458, 719–724 (2009). doi: 10.1038/nature07943; pmid: 19360079 [DOI] [PMC free article] [PubMed] [Google Scholar]
- 6.Geschwind DH, Flint J, Genetics and genomics of psychiatric disease. Science 349, 1489–1494 (2015). doi: 10.1126/science.aaa8954; pmid: 26404826 [DOI] [PMC free article] [PubMed] [Google Scholar]
- 7.Cichon S et al. , Genomewide association studies: History, rationale, and prospects for psychiatric disorders. Am. J. Psychiatry 166, 540–556 (2009). doi: 10.1176/appi.ajp.2008.08091354; pmid: 19339359 [DOI] [PMC free article] [PubMed] [Google Scholar]
- 8.Battle A et al. , Genetic effects on gene expression across human tissues. Nature 550, 204–213 (2017). doi: 10.1038/nature24277; pmid: 29022597 [DOI] [PMC free article] [PubMed] [Google Scholar]
- 9.Kundaje A et al. , Integrative analysis of 111 reference human epigenomes. Nature 518, 317–330 (2015). doi: 10.1038/nature14248; pmid: 25693563 [DOI] [PMC free article] [PubMed] [Google Scholar]
- 10.ENCODE Project Consortium, An integrated encyclopedia of DNA elements in the human genome. Nature 489, 57–74 (2012). doi: 10.1038/nature11247; pmid: 22955616 [DOI] [PMC free article] [PubMed] [Google Scholar]
- 11.Fromer M et al. , Gene expression elucidates functional impact of polygenic risk for schizophrenia. Nat. Neurosci 19, 1442–1453 (2016). doi: 10.1038/nn.4399; pmid: 27668389 [DOI] [PMC free article] [PubMed] [Google Scholar]
- 12.Colantuoni C et al. , Temporal dynamics and genetic control of transcription in the human prefrontal cortex. Nature 478, 519–523 (2011). doi: 10.1038/nature10524; pmid: 22031444 [DOI] [PMC free article] [PubMed] [Google Scholar]
- 13.Won H et al. , Chromosome conformation elucidates regulatory relationships in developing human brain. Nature 538, 523–527 (2016). doi: 10.1038/nature19847; pmid: 27760116 [DOI] [PMC free article] [PubMed] [Google Scholar]
- 14.Lake BB et al. , Neuronal subtypes and diversity revealed by single-nucleus RNA sequencing of the human brain. Science 352, 1586–1590 (2016). doi: 10.1126/science.aaf1204; pmid: 27339989 [DOI] [PMC free article] [PubMed] [Google Scholar]
- 15.Saliba AE, Westermann AJ, Gorski SA, Vogel J, Single-cell RNA-seq: Advances and future challenges. Nucleic Acids Res. 42, 8845–8860 (2014). doi: 10.1093/nar/gku555; pmid: 25053837 [DOI] [PMC free article] [PubMed] [Google Scholar]
- 16.Darmanis S et al. , A survey of human brain transcriptome diversity at the single cell level. Proc. Natl. Acad. Sci. U.S.A. 112, 7285–7290 (2015). doi: 10.1073/pnas.1507125112; pmid: 26060301 [DOI] [PMC free article] [PubMed] [Google Scholar]
- 17.Akbarian S et al. , The PsychENCODE project. Nat. Neurosci 18, 1707–1712 (2015). doi: 10.1038/nn.4156; pmid: 26605881 [DOI] [PMC free article] [PubMed] [Google Scholar]
- 18.Walters JT, Owen MJ, Endophenotypes in psychiatric genetics. Mol. Psychiatry 12, 886–890 (2007). doi: 10.1038/sj.mp.4002068; pmid: 17895920 [DOI] [PubMed] [Google Scholar]
- 19.PsychENCODE Integrative Analysis, http://resource.psychencode.org/.
- 20.Lake BB et al. , Integrative single-cell analysis of transcriptional and epigenetic states in the human adult brain. Nat. Biotechnol 36, 70–80 (2018). doi: 10.1038/nbt.4038; pmid: 29227469 [DOI] [PMC free article] [PubMed] [Google Scholar]
- 21.Materials and methods are available as supplementary materials.
- 22.Gandal MJ et al. , Transcriptome-wide isoform-level dysregulation in ASD, schizophrenia, and bipolar disorder. Science 362, eaat8127 (2018). [DOI] [PMC free article] [PubMed] [Google Scholar]
- 23.Voineagu I et al. , Transcriptomic analysis of autistic brain reveals convergent molecular pathology. Nature 474, 380–384 (2011). doi: 10.1038/nature10110; pmid: 21614001 [DOI] [PMC free article] [PubMed] [Google Scholar]
- 24.Gandal MJ et al. , Shared molecular neuropathology across major psychiatric disorders parallels polygenic overlap. Science 359, 693–697 (2018). doi: 10.1126/science.aad6469; pmid: 29439242 [DOI] [PMC free article] [PubMed] [Google Scholar]
- 25.Oldham MC et al. , Functional organization of the transcriptome in human brain. Nat. Neurosci 11, 1271–1282 (2008). doi: 10.1038/nn.2207; pmid: 18849986 [DOI] [PMC free article] [PubMed] [Google Scholar]
- 26.Bakken TE et al. , A comprehensive transcriptional map of primate brain development. Nature 535, 367–375 (2016). doi: 10.1038/nature18637; pmid: 27409810 [DOI] [PMC free article] [PubMed] [Google Scholar]
- 27.Jaffe AE et al. , Developmental regulation of human cortex transcription and its clinical relevance at single base resolution. Nat. Neurosci 18, 154–161 (2015). doi: 10.1038/nn.3898; pmid: 25501035 [DOI] [PMC free article] [PubMed] [Google Scholar]
- 28.Kelley KW, Nakao-Inoue H, Molofsky AV, Oldham MC, Variation among intact tissue samples reveals the core transcriptional features of human CNS cell classes. Nat. Neurosci 21, 1171–1184 (2018). doi: 10.1038/s41593-018-0216-z; pmid: 30154505 [DOI] [PMC free article] [PubMed] [Google Scholar]
- 29.Rubenstein JL, Merzenich MM, Model of autism: Increased ratio of excitation/inhibition in key neural systems. Genes Brain Behav. 2, 255–267 (2003). doi: 10.1034/j.1601-183X.2003.00037.x; pmid: 14606691 [DOI] [PMC free article] [PubMed] [Google Scholar]
- 30.McKinney BC et al. , Hypermethylation of BDNF and SST genes in the orbital frontal cortex of older individuals: A putative mechanism for declining gene expression with age. Neuropsychopharmacology 40, 2604–2613 (2015). doi: 10.1038/npp.2015.107; pmid: 25881116 [DOI] [PMC free article] [PubMed] [Google Scholar]
- 31.Tacutu R et al. , Human ageing genomic resources: New and updated databases. Nucleic Acids Res. 46 (D1), D1083–D1090 (2018). doi: 10.1093/nar/gkx1042; pmid: 29121237 [DOI] [PMC free article] [PubMed] [Google Scholar]
- 32.Kasowski M et al. , Extensive variation in chromatin states across humans. Science 342, 750–752 (2013). doi: 10.1126/science.1242510; pmid: 24136358 [DOI] [PMC free article] [PubMed] [Google Scholar]
- 33.Sun W et al. , Histone acetylome-wide association study of autism spectrum disorder. Cell 167, 1385–1397.e11 (2016). doi: 10.1016/j.cell.2016.10.031; pmid: 27863250 [DOI] [PubMed] [Google Scholar]
- 34.Purves D, Neuroscience (Oxford Univ., ed. 6, 2018). [Google Scholar]
- 35.Ardlie KG et al. , The Genotype-Tissue Expression (GTEx) pilot analysis: Multitissue gene regulation in humans. Science 348, 648–660 (2015). doi: 10.1126/science.1262110; pmid: 25954001 [DOI] [PMC free article] [PubMed] [Google Scholar]
- 36.Storey JD, Tibshirani R, Statistical significance for genomewide studies. Proc. Natl. Acad. Sci. U.S.A. 100, 9440–9445 (2003). doi: 10.1073/pnas.1530509100; pmid: 12883005 [DOI] [PMC free article] [PubMed] [Google Scholar]
- 37.del Rosario RC et al. , Sensitive detection of chromatin-altering polymorphisms reveals autoimmune disease mechanisms. Nat. Methods 12, 458–464 (2015). doi: 10.1038/nmeth.3326; pmid: 25799442 [DOI] [PubMed] [Google Scholar]
- 38.Grubert F et al. , Genetic control of chromatin states in humans involves local and distal chromosomal interactions. Cell 162, 1051–1065 (2015). doi: 10.1016/j.cell.2015.07.048; pmid: 26300125 [DOI] [PMC free article] [PubMed] [Google Scholar]
- 39.Bryois J et al. , Evaluation of chromatin accessibility in prefrontal cortex of individuals with schizophrenia. Nat. Commun 9, 3121 (2018). doi: 10.1038/s41467-018-05379-y; pmid: 30087329 [DOI] [PMC free article] [PubMed] [Google Scholar]
- 40.Chailangkarn T et al. , A human neurodevelopmental model for Williams syndrome. Nature 536, 338–343 (2016). doi: 10.1038/nature19067; pmid: 27509850 [DOI] [PMC free article] [PubMed] [Google Scholar]
- 41.Dao LTM et al. , Genome-wide characterization of mammalian promoters with distal enhancer functions. Nat. Genet 49, 1073–1081 (2017). doi: 10.1038/ng.3884; pmid: 28581502 [DOI] [PubMed] [Google Scholar]
- 42.de la Torre-Ubieta L, Won H, Stein JL, Geschwind DH, Advancing the understanding of autism disease mechanisms through genetics. Nat. Med 22, 345–361 (2016). doi: 10.1038/nm.4071; pmid: 27050589 [DOI] [PMC free article] [PubMed] [Google Scholar]
- 43.Fode C et al. , A role for neural determination genes in specifying the dorsoventral identity of telencephalic neurons. Genes Dev. 14, 67–80 (2000). pmid: 10640277 [PMC free article] [PubMed] [Google Scholar]
- 44.Rasmussen AH, Rasmussen HB, Silahtaroglu A, The DLGAP family: Neuronal expression, function and role in brain disorders. Mol. Brain 10, 43 (2017). doi: 10.1186/s13041-017-0324-9; pmid: 28870203 [DOI] [PMC free article] [PubMed] [Google Scholar]
- 45.Erlander MG, Tillakaratne NJ, Feldblum S, Patel N, Tobin AJ, Two genes encode distinct glutamate decarboxylases. Neuron 7, 91–100 (1991). doi: 10.1016/0896-6273(91)90077-D; pmid: 2069816 [DOI] [PubMed] [Google Scholar]
- 46.Liodis P et al. , Lhx6 activity is required for the normal migration and specification of cortical interneuron subtypes. J. Neurosci 27, 3078–3089 (2007). doi: 10.1523/JNEUROSCI.3055-06.2007; pmid: 17376969 [DOI] [PMC free article] [PubMed] [Google Scholar]
- 47.Pardiñas AF et al. , Common schizophrenia alleles are enriched in mutation-intolerant genes and in regions under strong background selection. Nat. Genet 50, 381–389 (2018). doi: 10.1038/s41588-018-0059-2; pmid: 29483656 [DOI] [PMC free article] [PubMed] [Google Scholar]
- 48.Mangale VS et al. , Lhx2 selector activity specifies cortical identity and suppresses hippocampal organizer fate. Science 319, 304–309 (2008). doi: 10.1126/science.1151695; pmid: 18202285 [DOI] [PMC free article] [PubMed] [Google Scholar]
- 49.Wang C et al. , SOX7 interferes with β-catenin activity to promote neuronal apoptosis. Eur. J. Neurosci 41, 1430–1437 (2015). doi: 10.1111/ejn.12910; pmid: 25847511 [DOI] [PubMed] [Google Scholar]
- 50.Salakhutdinov R, Hinton G, “Deep Boltzmann machines,” Proc. 12th Int. Conf. Artif. Intell. Stat 5, 448–455 (2009). [Google Scholar]
- 51.Anttila V et al. , Analysis of shared heritability in common disorders of the brain. Science 360, eaap8757 (2018). doi: 10.1126/science.aap8757; pmid: 29930110 [DOI] [PMC free article] [PubMed] [Google Scholar]
- 52.Liu Y et al. , Functional assessment of human enhancer activities using whole-genome STARR-sequencing. Genome Biol. 18, 219 (2017). doi: 10.1186/s13059-017-1345-5; pmid: 29151363 [DOI] [PMC free article] [PubMed] [Google Scholar]
- 53.Liu S, Trapnell C, Single-cell transcriptome sequencing: Recent advances and remaining challenges. F1000Res. 5, 10.12688/f1000research.7223.1 (2016). pmid: 26949524 [DOI] [PMC free article] [PubMed] [Google Scholar]
- 54.Chun H, Keles S, Expression quantitative trait loci mapping with multivariate sparse partial least squares regression. Genetics 182, 79–90 (2009). doi: 10.1534/genetics.109.100362; pmid: 19270271 [DOI] [PMC free article] [PubMed] [Google Scholar]
- 55.Scott-Boyer MP et al. , An integrated hierarchical Bayesian model for multivariate eQTL mapping. Stat. Appl. Genet. Mol. Biol 11, /j/sagmb.2012.11.issue-4/1544–6115.1760/1544–6115.1760.xml (2012). doi: 10.1515/1544-6115.1760; pmid: 22850063 [DOI] [PMC free article] [PubMed] [Google Scholar]
- 56.Bearden CE, Thompson PM, Emerging global initiatives in neurogenetics: The Enhancing Neuroimaging Genetics through Meta-analysis (ENIGMA) Consortium. Neuron 94, 232–236 (2017). doi: 10.1016/j.neuron.2017.03.033; pmid: 28426957 [DOI] [PMC free article] [PubMed] [Google Scholar]
- 57.van Erp TGM et al. , Cortical brain abnormalities in 4474 individuals with schizophrenia and 5098 control subjects via the Enhancing Neuro Imaging Genetics Through Meta Analysis (ENIGMA) Consortium. Biol. Psychiatry 84, 644–654 (2018). doi: 10.1016/j.biopsych.2018.04.023; pmid: 29960671 [DOI] [PMC free article] [PubMed] [Google Scholar]
- 58.Sousa AMM et al. , Molecular and cellular reorganization of neural circuits in the human lineage. Science 358, 1027–1032 (2017). doi: 10.1126/science.aan3456; pmid: 29170230 [DOI] [PMC free article] [PubMed] [Google Scholar]
- 59.Amiri A et al. , Transcriptome and epigenome landscape of human cortical development modeled in organoids. Science 362, eaat6720 (2018). [DOI] [PMC free article] [PubMed] [Google Scholar]
- 60.Evgrafov OV et al. , Gene expression in patient-derived neural progenitors provide insights into neurodevelopmental aspects of schizophrenia. bioRxiv 209197 [Preprint]. 26 October 2017. doi: 10.1101/209197 [DOI] [Google Scholar]
- 61.Li M et al. , Integrative functional genomic analysis of human brain development and neuropsychiatric risks. Science 362, eaat7615 (2018). [DOI] [PMC free article] [PubMed] [Google Scholar]
Associated Data
This section collects any data citations, data availability statements, or supplementary materials included in this article.