

Abstract
Molecular dynamics (MD) simulations of heptane/vapor, hexadecane/vapor, water/vapor, hexadecane/water, and dipalmitoylphosphatidylcholine (DPPC) bilayers and monolayers are analyzed to determine the accuracy of treating long-range interactions in interfaces with the isotropic periodic sum (IPS) method. The method and cutoff (rc) dependences of surface tensions, density profiles, water dipole orientation, and electrostatic potential profiles are used as metrics. The water/vapor, heptane/vapor, and hexadecane/vapor interfaces are accurately and efficiently calculated with 2D IPS (rc = 10 Å). It is demonstrated that 3D IPS is not practical for any of the interfacial systems studied. However, the hybrid method PME/IPS [Particle Mesh Ewald for electrostatics and 3D IPS for Lennard-Jones (LJ) interactions] provides an efficient way to include both types of long-range forces in simulations of large liquid/vacuum and all liquid/liquid interfaces, including lipid monolayers and bilayers. A previously published pressure-based long-range LJ correction yields results similar to those of PME/IPS for liquid/liquid interfaces. The contributions to surface tension of LJ terms arising from interactions beyond 10 Å range from 13 dyn/cm for the hexadecane/vapor interface to approximately 3 dyn/cm for hexadecane/water and DPPC bilayers and monolayers. Surface tensions of alkane/vapor, hexadecane/ water, and DPPC monolayers based on the CHARMM lipid force fields agree very well with experiment, whereas surface tensions of the TIP3P and TIP4P-Ew water models underestimate experiment by 16 and 11 dyn/cm, respectively. Dipole potential drops (∆Ψ) are less sensitive to long-range LJ interactions than surface tensions. However, ∆Ψ for the DPPC bilayer (845 ± 3 mV proceeding from water to lipid) and water (547 ± 2 mV for TIP4P-Ew and 521 ± 3 mV for TIP3P) overestimate experiment by factors of 3 and 5, respectively, and represent expected deficiencies in nonpolarizable force fields.
1. Introduction
Long-range electrostatic interactions are critical when simulating interfaces,1–5 and the calculation of these effects by Particle Mesh Ewald6 (PME) is now standard. In contrast, the importance of long-range Lennard-Jones (LJ) interactions for interfaces has only recently been appreciated. For example, the simulated surface tension of the heptane/vacuum interface increases 50% when the LJ cutoff is increased from 10 to 25 Å7 On the basis of these and related results, Lagüe et al.7 developed a pressure-based long-range correction (LRC) for LJ interactions in liquid/liquid interfaces and isotropic media. However, because the LRC method relies on adjustments to the applied pressure, it can only be applied to constant-volume ensembles (including liquid/vapor interfaces and lipid mono-layers) as an approximate post-simulation correction. Increasing cutoffs for nonbonded interactions to 16 Å or greater1,8 substantially improves the treatment of long-range LJ forces, but at the cost of computational efficiency.
Recently, Wu and Brooks9 developed the isotropic periodic sum (IPS) method for accurately treating both electrostatic and LJ long-range interactions. This method does not sum up the discrete lattice images for long-range interactions but, rather, utilizes isotropic periodic images to represent remote interactions by integrating over all possible directions isotropically. Essentially, the IPS method is a cutoff method for the short-range interactions plus an isotropic long-range correction to obtain interactions to infinity. It is formulated for systems that are periodic in one, two, or three dimensions. Among the advantages of IPS is the accurate treatment of the long-range LJ interactions and its applicability to both constant-pressure and constant-volume ensembles. The IPS method has been tested on electrostatic and LJ fluids, as well as the acetylcholine binding protein.9 This study extends testing of 2D and 3D IPS to liquid/ vapor (l/v) and liquid/liquid (l/l) interfaces. The hybrid method, PME/IPS, is also introduced, wherein the electrostatics are treated with PME and the LJ interactions by 3D IPS. Six systems, namely, heptane/vapor, hexadecane/vapor, water/vapor, hexadecane/water, a dipalmitoylphosphatidylcholine (DPPC) bilayer at one surface area, and DPPC monolayers at three different surface areas, are considered. This set of hydrophobic, electrostatic, and hydrophobic/hydrophilic systems provides tests of both long-range LJ and charged interactions. The heptane/ vapor and hexadecane/vapor systems are sufficiently small to allow an extensive evaluation of system size and cutoff dependence for different methods, including PME with a 25-Å cutoff. A comparison of calculated surface tensions with experiment provides a test of the revised CHARMM27 (C27r) alkane parameters.10,11 Simulations of water/vapor and hexadecane/water were carried out with both the TIP3P12,13 water model and the recently developed TIP4P-Ew14 water model, providing further validation of the methods and evaluation of the force-field parameters. The DPPC bilayers and monolayers add a new set of interactions (zwitterion/water) and the constraints associated with the lipid/water interface. Comparison of the IPS results with simulations of hexadecane/air carried out with the pressure-based LRC, as well previously published simulations of the DPPC bilayer,10,15 allows a comparison of the two methods. The results of bilayer16,17 and monolayer16 simulations carried out with no long-range LJ correction are also included in the preceding comparison.
By way of outline, section 2 briefly reviews the IPS method and describes the simulation methods and analysis. Section 3 presents density profiles, surface tensions, orientation of the water dipole moment, and electrostatic potential drops with respect to the surface for the assorted simulations. These results are discussed in section 4, and recommendations for simulating l/v and l/l interfaces are presented.
2. Methodology
2.1. Isotropic Periodic Sum.
The long-range interaction between an atom and all others is determined in the IPS method by calculating an integral that represents the process of isotropically replicating all of the atoms within a specified cutoff distance, rc.9 If the simulation system is sufficiently isotropic within rc, then the long-range interactions are exact. This method differs from standard long-range interactions that are calculated on a lattice and based on periodic images of the entire simulation unit cell. Typically, a relatively small value of rc (10–12 Å) yields results of comparable accuracy to PME with a large cutoff in the LJ interactions and with much greater computational efficiency.
Both the 2D and 3D variants of IPS are considered in this study. 2D IPS is designed for systems that are finite in one dimension and infinite in the other two, such as a liquid slab in a cell used to simulate a liquid in contact with its vapor (Figure 1, left). Periodicity is imposed onto the finite dimension (normal to the surface or z axis) to avoid particle loss by molecular evaporation. The long-range interactions in 2D IPS between an atom and the remaining interface are calculated with a cylinder oriented along the z axis and replicated in the xy plane. The length of the cylinder equals the unit cell dimension in the z direction, and the radius equals the cutoff rc. The atom interacts with all other atoms in the cylinder and its replicates in the xy plane at .9 Calculations with 2D IPS become computationally demanding when the slab thickness is much larger than rc, because all interactions are evaluated along the z axis within the cylinder.
Figure 1.

Schematic of the two types interfaces examined in this study.
Long-range interactions in 3D IPS are calculated using a replicated sphere defined by rc. Although excellent results have been obtained for bulk-like systems that are isotropic in all three dimensions,9 it will be demonstrated that 3D IPS is not well suited for calculating the electrostatic interactions of polar interfaces. Consequently, the electrostatic interactions for l/l interfaces (Figure 1, right) and lipid monolayers were evaluated by PME, and the LJ interactions were evaluated by 3D IPS. This hybrid method is denoted PME/IPS.
As appropriate, the cutoff is noted when referring to a simulation, e.g., PME(rc=25), where Å is omitted for notational convenience. Simulations carried out with the pressure-based long-range correction, including selected bilayer systems, are labeled PME/LRC. Bilayer and monolayer simulations carried out without the LRC were simulated with a 10-Å cutoff are thereby specified PME(rc=10).
2.2. Molecular Dynamics.
Simulations were performed with CHARMM18 using the revised CHARMM27 force field (C27r).10,11 For water, the modified TIP3P water model12,13 and TIP4P-Ew14 were used in the MD simulations. The leapfrog Verlet algorithm was used with a tetragonal periodic boundary and a time step of 1 fs. For the l/v systems, a vapor space was created on either side of the interface to minimize artificial long-range interactions with other fluid interfaces. All hydrogen atoms were constrained using the SHAKE algorithm.19 Evaluation of electrostatic interactions with PME6 was carried out with κ = 0.34 Å−1 and a fast-Fourier grid density of about 1 Å−1. For calculations with truncation, the LJ interactions were smoothed by a switching function from rc – 2 Å to rc, where rc is the radial cutoff. The liquid/vapor systems were simulated in the constant-particle-number (N), constant-volume (V), and constant-temperature (T) ensemble (NVT). Hexadecane/water was simulated at NPAT, where P and A denote the normal pressure and surface area, respectively. NPAT simulations with the LRC in pressure7 (PME/LRC) were also performed for this alkane/water interface and the DPPC bilayer to compare long-range LJ methods. The long-range LJ cutoff used in this LRC method was 30 Å. The extended system formalism was used to maintain the temperature via the Hoover thermostat20 and/or pressure21,22 with a thermostat coupling constant of 2000 kcal mol−1 ps−2 for and a piston mass of 2000 amu for hexadecane/water.
The starting coordinates for the heptane/vapor and hexadecane/vapor systems were obtained from previous simulations of the bulk.10 For water/vapor, a bulk simulation of the same size was run for 2 ns, and the last coordinates were used as starting coordinates. The initial coordinates for hexadecane/water were obtained by first using the equilibrated hexadecane/vapor coordinates and adding liquid water to either side to fill the vapor space. Waters in close contact with hexadecane (<2.5 Å) were also removed, and a 100-step steepest-decent minimization eliminated any remaining water/hexadecane overlaps. The following system sizes were simulated: 64, 128, and 256 molecules for heptane/vapor; 160 and 230 molecules for hexadecane/vapor; 1340 molecules for water/vapor; and 160 hexadecane molecules and 4697 water molecules for hexadecane/water.
Each of the MD simulations included heating and equilibration periods. For heating, the velocities were set to 100 K below the target temperature and increased by 10 K every 1 ps until the target temperature was reached (or 100 ps total). After heating, 300 ps of equilibration was run to ensure a fully equilibrated state. Production runs of the alkane and water simulations were carried out for 2 ns, and coordinates were saved every 1 ps. Cuttoffs varied from 8 to 25 Å.
The DPPC lipid bilayer consisted of 36 lipids per leaflet (72 total) with 2189 TIP3P water molecules and a cross-sectional area of 64 Å2/lipid.23 Three methods are compared for the DPPC bilayer: a single 30-ns PME/IPS simulation (rc ) 10), PME/ LRC from a previous set of three 50-ns simulations,15 and PME-(rc = 10) from a previous 25-ns trajectory of a bilayer with 40 lipids/leaflet with no LRC applied.17 The DPPC lipid monolayers (40 lipids/leaflet) were simulated at 54, 64, and 80 Å2/lipid, and the results compared with those from previous 20-ns PME-(rc=10) simulations (the pressure-based LRC cannot be applied to monolayers).16 PME/IPS simulations of bilayers and monolayers were initiated from the final coordinates of the PME/ LRC and PME(rc=10) trajectories, respectively. They were carried out for 25-ns each, following 3 ns of equilibration.
2.3. Analysis of MD.
The electron density profile normal to the interface, ρ(z), and surface tension, γ, are the primary measures for comparisons among simulations and between simulation and experiment. The ρ(z) values were obtained as an average of all 1-ps snapshots following Feller et al.24 To account for temporal displacements of the entire interface along z, the center of the interface for each snapshot was taken to be zM, the mass-weighted projection of the molecules along the z axis, and adjusted atomic positions zi were then obtained from the raw atomic positions by subtracting zM. Based on the zi values, the number of electrons in each atom was then added to a histogram with a bin size of 0.1 Å in the z direction, ∆z. Division by the bin volume and the number of snapshots provided the electron density ρ(zj). The density in the center of each liquid slab, , was determined by fitting the ρ(z) values to a scaled complimentary error function.
The surface tension was evaluated from the expression
| (1) |
where Lz is the size of the simulation box normal to the interface, Pzz is the normal component of the internal pressure tensor, and Pxx and Pyy are the tangential components. Because the MD simulations here contained two interfaces (see Figure 1), the prefactor 0.5 was required to obtain γ on a per-interface basis.
The orientation of water with respect to the surface normal was calculated for each 1-ps snapshot; binned into 0.1-Å slabs,
zj; and scaled by the electron density to obtain , where θ is the angle between the dipole vector and the positive z axis. (This smooths the function and minimizes the effects of water molecules in the vapor phase.)
The electrostatic potential profile of all systems at the interface was calculated by double integration of the Poisson equation
| (2) |
where ρc is the time-averaged charge density. The zero is the vacuum for the l/v systems and the center of the hydrophobic layer in the l/l systems.
3. Results
3.1. Alkane/Vapor.
Table 1 presents the system size (N) and cutoff (rc) dependence for surface tensions of heptane/vapor for PME, 2D IPS, and 3D IPS. From these data and the system-size-dependent densities (data not shown), N = 128 is adequate for heptane/vapor. A similar analysis yields N = 160 for hexadecane/vapor.
TABLE 1:
Surface Tension (dyn/cm) of the Heptane/Vapor Interface with a Given LJ Cutoff (rc) at 298.15 Ka
|
rc (Å) |
|||||||
|---|---|---|---|---|---|---|---|
| method | no. of molecules | 8 | 10 | 12 | 15 | 20 | 25 |
| PME | 64 | 2.6 ± 0.3 | 9.6 ± 0.4 | 13.1 ± 0.6 | 18.7 ± 0.4 | ||
| 128 | 2.5 ± 0.1 | 8.7 ± 0.3 | 12.2 ± 0.3 | 18.3 ± 0.1 | |||
| 256 | 2.1 ± 0.2 | 9.0 ± 0.3 | 12.3 ± 0.3 | 17.3 ± 0.3 | |||
| 2D IPS | 64 | 14.8 ± 0.5 | 16.8 ± 0.5 | 16.8 ± 0.4 | 17.8 ± 0.3 | 18.5 ± 0.5 | |
| 128 | 18.4 ± 0.3 | 18.7 ± 0.3 | 18.3 ± 0.3 | 18.3 ± 0.3 | 18.7 ± 0.4 | ||
| 3D IPS | 128 | 2.9 ± 0.3 | 8.7 ± 0.3 | 15.0 ± 0.4 | 16.7 ± 0.4 | 18.5 ± 0.3 | 17.8 ± 0.3 |
Experimental value is 19.8 dyn/cm.25
The surface tensions for heptane and hexadecane calculated from the PME trajectories show the strong dependence on rc noted previously by Lagüe et al.7 Hence, whereas the long-range electrostatic contributions to the surface tension are correctly included by PME, an unacceptably large fraction of the LJ forces is ignored for commonly used cutoffs such as 10 and 12 Å. The density profiles for PME(rc= 10) and PME-(rc=25) are also substantially different (Figure 2). The PME-(rc=8) heptane system is only borderline stable, as is consistent with a surface tension near zero.
Figure 2.

Density of the heptane/vapor interface at 298.15 K for 2D IPS, 3D IPS, and PME for selected values of the cutoff rc in angstroms.
In contrast, surface tensions and densities calculated with 2D IPS are nearly independent of cutoff. The average surface tension, 18.5 ± 0.3 dyn/cm, is statistically equivalent to the PME(rc=25) value for heptane (Table 1), and the density profiles are nearly identical (Figure 2). Because 2D IPS is effectively an infinite-cutoff method, surface tensions are expected to be greater than or equal to those calculated from PME. Hence, the observation that the surface tension for 2D IPS is approximately 3 dyn/cm higher than that for PME(rc=25) for hexadecane (Table 2) simply implies that rc = 25 Å is too small for this system.
TABLE 2:
Surface Tension (dyn/cm) of the Hexadecane/ Vapor Interface (N = 160 Molecules) with a Given LJ Cutoff (rc) at 323.15 Ka
|
rc (Å) |
||||
|---|---|---|---|---|
| method | 8 | 10 | 12 | 25 |
| PME | 5.9 ± 0.2 | 12.1 ± 0.3 | 16.6 ± 0.2 | 22.7 ± 0.4 |
| 2D IPS | 24.6 ± 0.5 | 23.0 ± 0.5 | 25.2 ± 0.3 | |
| 3D IPS | 9.1 ± 0.1 | 18.1 ± 0.2 | 18.9 ± 0.2 | |
Experimental value is 25.0 dyn/cm.25
Surface tensions and densities for 3D IPS monotonically increase with cutoff, although the dependence is not as strong as that obtained from PME. Nevertheless, both the surface tension (Tables 1 and 2) and the density (Figure 2) for 3D IPS (rc = 12) clearly underestimate the 2D IPS results, pointing to the limited usefulness of the 3D IPS method for alkane/vapor interfaces.
According to these results, 2D IPS provides the most accurate evaluation of liquid/vapor surface tensions. The surface tensions with the C27r force field for heptane/vapor and hexadecane/ vapor agree well with the experimental25 values 19.8 dyn/cm at 298.15 K (Table 1) and 25.0 dyn/cm at 323.15 K (Table 2), respectively. The fitted densities at the center of each system, , are 0.660 ± 0.003 g/cm3 for heptane/vapor and 0.755 ± 0.006 g/cm3 for hexadecane/vapor. These are statistically identical to the experimental bulk densities at the same temperature: 0.655 g/cm3 (heptane) and 0.753 g/cm3 (hexadecane).
The variation in electrostatic potential drops (∆Ψ) across the alkane/vapor interfaces is less dramatic than for surface tension. For example, for heptane/vapor, ∆Ψ (in mV) = 428 ± 6 with PME(rc=10), 450 ± 4 with PME(rc=25), and 444 ± 4 with 2D IPS(rc=10). For hexadecane/vapor, ∆Ψ ) 500 ± 5 with PME(rc=10), 523 ± 1 with PME(rc=25), and 534 ± 6 with 2D IPS(rc=10). Experimental values for ∆Ψ do not appear to be available.
3.2. Water/Vapor.
The electron density of the water/vapor interface is less sensitive to the LJ cutoff for PME than that of alkane/vapor because electrostatics dominate. For simulations with TIP3P at 323.15 K, for PME-(rc=25), which is statistically identical to the experimental density of bulk water at this temperature, 0.988 g/cm3.26 Densities for 2D IPS are independent of cutoff, with . However, for 3D IPS at 303.15 K, there is a slight dependence of ρ(z) on rc: , and 1.001 ± 0.001 g/cm3 for rc = 8, 10, and 12 Å, respectively; for PME(rc=25); and the experimental bulk density is 0.996 g/cm3. The density dependences on rc are similar for PME/ IPS (electrostatics with PME and LJ with 3D IPS) and 3D IPS. The density profiles and values for TIP4P-Ew and TIP3P at 323.15 K from 2D IPS are nearly identical.
The results for water surface tension are similar to those for density. Surface tensions for 3D IPS and PME/IPS increase moderately with rc and converge on the 2D IPS values (Table 3). Values for 2D IPS are independent of cutoff and further support 2D IPS as the method of choice for liquid/vapor systems. Surface tensions from 2D IPS at 323.5 K for TIP4P-Ew are approximately 5 dyn/cm higher than those for TIP3P, but they still underestimate the experimental value of 67.9 dyn/cm27 by approximately 10 dyn/cm. The TIP3P model underestimates experiment by over 15 dyn/cm at 303.15 K but correctly yields the 3 dyn/cm reduction of γ as the temperature is increased to 323.15 K.
TABLE 3:
Surface Tension (dyn/cm) of the Water/Vapor Interface with a Given LJ Cutoff (rc)a
|
rc (Å) |
||||||
|---|---|---|---|---|---|---|
| method | water model | temp (K) | 8 | 10 | 12 | 25 |
| PME | TIP3P | 303.15 | 44.1 ± 0.6 | 47.5 ± 0.6 | 51.6 ± 0.6 | 54.8 ± 0.5 |
| TIP3P | 323.15 | 41.5 ± 0.5 | 45.7 ± 0.3 | 47.7 ± 0.4 | 51.3 ± 0.4 | |
| TIP4P-Ew | 323.15 | 49.2 ± 0.7 | 53.2 ± 0.6 | 53.7 ± 0.9 | 59.2 ± 0.7 | |
| 2D IPS | TIP3P | 303.15 | 55.1 ± 0.5 | 54.1 ± 0.5 | 55.3 ± 0.4 | |
| TIP3P | 323.15 | 50.9 ± 0.5 | 50.7 ± 0.4 | 52.2 ± 0.7 | ||
| TIP4P-Ew | 323.15 | 57.4 ± 0.6 | ||||
| 3D IPS | TIP3P | 303.15 | 51.4 ± 0.3 | 53.6 ± 0.8 | 54.4 ± 0.6 | |
| TIP4P-Ew | 323.15 | 58.0 ± 0.6 | 58.7 ± 0.7 | 59.0 ± 0.6 | ||
| PME/IPS | TIP3P | 323.15 | 47.9 ± 0.5 | 49.6 ± 0.5 | ||
| TIP4P-Ew | 323.15 | 56.6 ± 0.3 | 57.2 ± 0.9 | |||
Experimental values at 303.15 and 323.15 K are 71.2 and 67.9 dyn/cm, respectively.27
The water dipole orientation with respect to the interface normal (z axis) is very sensitive to cutoff method, and this fact has supported arguments against using simple spherical electrostatic cutoffs when simulating interfaces.2 It has also been shown2 that PME correctly yields bulk behavior far from the interface; this is illustrated in the top panel of Figure 3 for TIP4P-Ew water, where for the range –10 Å z < 10 Å (the center of the water slab is located a z = 0). 2D IPS (Figure 3, middle) and PME/IPS (Figure 3, bottom) yield the same result. In contrast, there is strong orientational correlation throughout the entire slab for 3D IPS at rc = 10 and 12 Å (Figure 3, bottom). This ramp-like artifact is similar to that found for several other spherical cutoff methods.2
Figure 3.
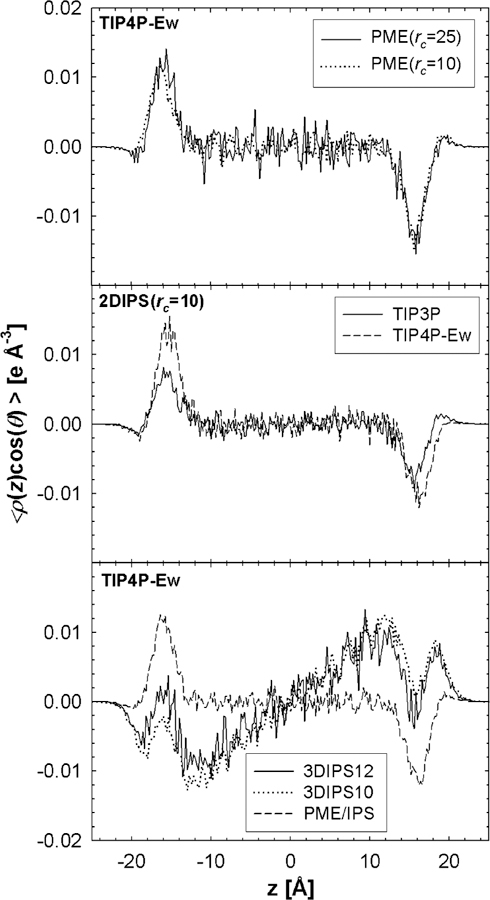
Orientation of the water dipole with respect to the positive z axis scaled by the electron density for PME (top), 2D IPS (middle), and 3D IPS and PME/IPS (bottom) for TIP4P-Ew at 323.15 K. Results for TIP3P are included for 2D IPS (middle panel).
The average dipole orientations near the interface are useful for comparing water models. For both TIP3P and TIP4P-Ew, and z are the same sign in the region closest to the vapor (z = ±19 Å). This indicates that the water dipole is directed toward the vapor phase (the hydrogen atoms point away from the bulk). The peak heights of TIP4P-Ew are somewhat higher than those of TIP3P, implying increased orientational order for the former. Specifically, the average angle of the dipole with respect to the interfacial plane, , equals 3.9° for TIP4P-Ew (from simulations with PME, 2D IPS, and PME/IPS) and 3.2° for TIP3P (from 2D IPS). Likewise, the value of the large and broad peak (z = ±16 Å) is –1.6° for TIP4P-Ew and –0.8° for TIP3P. The value for TIP4P-Ew at the water/vapor interface is 10.5° for 3D IPS, a value substantially larger than those obtained by the other methods.
Figure 4 plots the electrostatic potential profile for selected simulations. PME(rc=25), 2D IPS(rc=10), and PME/IPS(rc=10) all yield the same potential drop and a constant region in the center of the slab. The artifacts noted above for the dipole potential for 3D IPS are reflected in ψ(z): the large value of at the interface leads to a larger potential drop than the other methods, and the ramp-like behavior throughout the slab leads to a parabolic shape. As is evident in Figure 4, these artifacts remain even when rc = 25 Å, because, as with all cutoff methods, a cutoff greater than the interfacial thickness (>35 Å) is required to avoid inaccuracies in the interfacial electrostatics. Therefore, these results convincingly demonstrate that 3D IPS is not an acceptable or efficient method for the simulation of interfaces where electrostatics is important.
Figure 4.

Electrostatic potential profiles of the water/vapor interface for TIP4P-Ew at 323.15 K (top) and the hexadecane/water interface at 323.15 K (bottom; the dotted line is for TIP4P-Ew, and the remainder is TIP3P). In both panels, simulations for hexadecane/water were run with an interface of water/hexadecane/water, and the values shown in this figure were shifted to place water at the center.
∆Ψ is slightly larger for TIP4P-Ew than for TIP3P at 323.15 K according to the PME/IPS results, i.e., 547 ± 2 and 521 ± 3 mV, respectively. Experiments measuring ∆ψ for the water/ vapor interface are difficult to carry out and interpret.28 Nevertheless, the consensus value of an approximately 100 mV drop from air to water is substantially smaller than the values obtained here.
3.3. Hexadecane/Water.
The 2D IPS method cannot be used in this three-dimensional system, and 3D IPS yielded similar artifacts for water (data not shown), so only PME, PME/LRC, and PME/IPS are compared. The total and component ρ(z) values obtained with PME/IPS(rc=10) agree with those obtained with PME(rc=25) for TIP3P at 323.15 K (data not shown). The change in the methyl density is small upon inclusion of long-range LJ with PME/IPS(rc=10), but the water and hexadecane densities are increased: with PME-(rc=10) and 0.747 ± 0.004 g/cm3 with PME/IPS(rc=10). As with water/vapor, TIP4P-Ew has a slightly lower value (0.988 ± 0.001 g/cm3) at 323.15 K than TIP3P (0.995 ± 0.001 g/cm3).
The surface tensions for PME(rc=25), PME/IPS, and PME/ LRC are all comparable and about 2 dyn/cm larger than that for PME(rc=10) (Table 4). The experimental surface tension at 298.15 K is 53.3 dyn/cm,25 almost exactly between the TIP3P and TIP4P-Ew PME/IPS values. For TIP3P and TIP4P-Ew, γ decreases with increasing temperature (Table 4).
TABLE 4:
Surface Tension (dyn/cm) of the Hexadecane/Water Interface with rc = 10 Åa
| temp (K) | water model | PME | PME/LRC | PME/IPS |
|---|---|---|---|---|
| 298.15 | TIP3P | 44.9 ± 0.4 | 47.1 ± 0.6 | 48.2 ± 0.5 |
| TIP4P-Ew | 53.4 ± 0.7 | 57.3 ± 0.5 | ||
| 323.15 | TIP3P | 43.8 ± 0.4 | 45.5 ± 0.5 | 44.9 ± 0.5 |
| TIP4P-Ew | 50.6 ± 0.6 | 55.4 ± 0.8 |
Experimental value at 298.15 K is 53.3 dyn/cm.25 γ =45.4 ± 0.6 dyn/cm for PME(rc=25) at 323.15 K.
The dipole orientation of water with a hexadecane interface is similar to that of the pure water interface (see Figure 5). The dipole of water points toward the alkane directly at the interface with a slightly smaller peak than pure water. The peak height is also reduced for the major peak at z ≈ ± 15 Å, and the dipole points away from the alkane. The dipole orientations from PME-(rc=25) and PME/IPS are nearly identical (Figure 5). The value with PME/IPS and TIP3P at the interface and the major peak are 2.3° and –0.7°, respectively, and for TIP4P-Ew, they are 3.2° and –1.3°, respectively. The magnitude of these values for is slightly smaller than that of the water/vapor system.
Figure 5.

Orientation of the water dipole with respect to the positive z axis, scaled by the electron density, for hexadecane/water at 323.15 K. The two PME/IPS results are with rc = 10 Å, and the PME result is with rc = 25 Å.
The electrostatic potential profiles of TIP3P at 323.15 K for PME(rc=25) and PME/IPS are identical (Figure 4, bottom). ∆Ψ from the alkane to water interface is 18 ± 2 and 40 ±2 mV for TIP3P and TIP4P-Ew, respectively. The difference in ∆Ψ between water models is similar to that for the water/vapor interface, although the values are an order of magnitude smaller. Experimental values for ∆Ψ do not appear to be available.
3.4. DPPC Lipid Bilayer and Monolayers.
IPS was tested on two biologically relevant interfacial systems, a DPPC bilayer and monolayers, and compared with PME/LRC and PME-(rc=10). 2D IPS simulations on the monolayer were not performed because of the prohibitive cost.
As a first test, the symmetrized electron density about the bilayer center is compared in Figure 6. The PME/LRC and PME/ IPS methods are nearly identical for the overall density of the lipid bilayer. The slight difference in the D spacings for PME/ LRC and PME/IPS, 66.07 ± 0.01 and 65.90 ± 0.03 Å, respectively, is of little consequence. The density in the bilayer center is lower for PME(rc=10), as is consistent with the neglect of long-range LJ terms.
Figure 6.

Electron density of the DPPC bilayer at 323.15 K for PME/ IPS with rc = 10 Å (red), for PME/LRC 15 (green), and for PME(rc=10 Å)17 (black) compared to the experimental H2 model density29 (blue). The individual component densities are also shown: CH3 = methyl, CH2 = methylene, CG = carbonyl-glycerol, P = phosphate, and W + Chol = water and choline.
There are some differences between the experimentally modeled29 ρ(z) values and simulations including long-range LJ interactions, but the agreement is good overall (Figure 6). Elevated densities are calculated for the methyl trough and the headgroup peak. Similar deviations with the increased density at the center of the bilayer were obtained from simulations of a dimyristoylphosphatidycholine (DMPC) lipid bilayer.30 These two deviations suggest areas to further improve the C27r force field.
The surface tensions of the DPPC bilayer for PME/LRC and PME/IPS are statistically equivalent (18.6 ± 1.1 and 19.7 ± 0.8 dyn/cm) and approximately 3 dyn/cm larger than that for PME(rc=10)17 (16.8 ± 1.0 dyn/cm). Monolayer surface tensions for PME/IPS are 4.5, 2.2, and 2.0 dyn/cm and are higher than those for PME(rc=10) for the three surface areas of 54, 64, and 80 Å,2 respectively (Figure 7). The overall agreement between experiment31,32 and simulation for monolayers is excellent, considering the complexity of the system. It is slightly improved for PME/IPS at a surface area of 80 Å2 but is slightly worsened at 54 Å.2
Figure 7.

Simulated DPPC lipid monolayer surface tension at three surface areas for PME/IPS and PME with rc = 10 Å. The experimental data are also shown for 323.15 and 321.15 K from refs 31 and 32, respectively.
The charged groups of choline and phosphorus alter the dipole behavior of water compared to that for the hexadecane/water interface. The dipole of water points away from the hydrocarbon near the aliphatic carbons and is directed toward the center in the choline region (see Figure 8, top, for the DPPC bilayer). is larger than for the water/vapor or hexadecane/water systems. The maximum θ’ value for the major peak of PME/ LRC and PME/IPS is 11.5° and is located at z = 20.6 Å. This maximum value increases slightly with PME(rc=10) to 12.2° at z = 21.0 Å, which is the result of density changes between the two methods.
Figure 8.

(Top) Orientation of the water dipole with respect to the positive z axis, which is scaled by the electron density for DPPC at 323.15 K. (Bottom) Electrostatic potential profile of the fully hydrated DPPC bilayer. A value of rc = 10 Å is used for PME/IPS and PME. The bilayer center is located at z = 0.
The electrostatic potential profiles for the lipid bilayer are identical for PME/LRC and PME/IPS (Figure 8, bottom). ∆Ψ from the center of the bilayer to the water interface is 845 ± 3 mV, which is slightly lower than the value of ∆Ψ ) 890 ± 7 mV obtained from PME(rc=10) (Figure 8, bottom).16 These values are significantly greater than the approximately 250 mV obtained from experiment,33 but they are in the range obtained by other MD simulation studies.34 The electrostatic potential profiles for DPPC monolayers are compared in Figure 9. There are two potential drops, i.e., one at the lipid/vapor interface and another at the lipid/water interface. ∆Ψ increases with increasing surface area per lipid for these DPPC monolayers. PME(rc=10) and PME/IPS result in identical values of ∆Ψ (see Figure 9).
Figure 9.

Electrostatic potential profile of DPPC monolayers for PME/ IPS and PME with rc = 10 Å. For clarity, a comparison is made between PME/IPS (solid) and PME (dashed) only at A = 64 Å 2/lipid. The center of the water layer is located at z = 0.
4. Discussion and Conclusions
The isotropic periodic sum methods have been validated for simulations of interfacial systems. For l/v systems of small molecules (e.g., heptane, hexadecane, and water), 2D IPS(rc=10) provides an accurate and efficient evaluation of interfacial properties. However, 2D IPS is limited to l/v systems because the long-range interactions with images in the z direction are ignored. All molecules in a cylinder defined by the z dimension of the unit cell and rc are considered in the 2D IPS and can be computationally demanding. This limits the use of this method on large systems, such as lipid monolayers. Instead, 2D IPS should be used as a benchmark for other methods because it is typically more efficient and more accurate than PME with a cutoff of 25 Å.
In principle, 3D IPS can be used for l/v and l/l systems providing that the cutoff region is larger than the heterogeneous size.9 Because 3D IPS behaves as a cutoff method, MD simulations for l/v and l/l interfaces with smaller cutoffs resulted in a water dipole orientation that was similar to those obtained from simple spherical truncation and other distance-based cutoff methods2 (Figure 3). Even with a relatively large cutoff of 25 Å, 3D IPS disagrees with the standard PME result for ψ(z) within the water layer (Figure 4, top). Therefore, for charged interfacial systems, the heterogeneous size is the interfacial thickness, and a cutoff greater than this value is required to accurately calculate all interactions. Because this large cutoff is computationally expensive, 3D IPS is used only for the long-range LJ interactions (allowing for a shorter cutoff), and PME is used for the long-range electrostatics. This hybrid method, PME/IPS, with rc = 10 Å results in complete agreement with the PME with a 25-Å cutoff for ρ(z), γ, water dipole, and ψ(z) for the water/vapor and hexadecane/water systems. PME/IPS, though approximate because of isotropic averaging of long-range LJ forces near the interface, is our method of choice for simulating l/l and large l/v systems such as lipid monolayers.
A previously published pressure-based correction to the long-range LJ interaction7 denoted here as PME/LRC yields results nearly equivalent to those of PME/IPS for hexadecane/water and the DPPC bilayer (Figures 6 and 8). Hence, to a reasonable approximation, long-range LJ effects can be captured by increasing the pressure and thereby increasing the density of the system (a 3% increase for bulk heptane and pentadecane7). However, PME/IPS is preferred because PME/LRC requires reevaluation of the pressure with a very large cutoff and it is somewhat cumbersome to apply to liquid/liquid systems. Additionally, PME/LRC is only applicable to constant-volume ensembles as a postprocess to the simulation.
The densities of the alkane/vapor and water/vapor systems attain their bulk values in the slab centers and are in good agreement with experiment. As shown previously,7 not including long-range LJ interactions results in a density that is lower than experiment. For the DPPC bilayer, the agreement between the experimental model29 for the electron density and PME/IPS is good. However, these results and those for the DMPC lipid bilayer (PME/LRC)30 suggest areas for improving the lipid force field. The electron density at the center of the bilayer is higher than experiment, which is the result of increased chain inter-digitation. Similarly, the density in the region of the headgroup is elevated as a result of a broader phosphate distribution and an increased density of water within the bilayer as compared to experiment (Figure 6).
Table 5 lists the most accurate surface tensions presented here for each system. Except for water/vapor, these are within 10% of experiment (the standard errors in simulated values are generally 1–3%). This includes the DPPC monolayers, where the errors for 54, 64, and 80 Å2/lipid are 20%, 5%, and 1%, respectively (for an average of 9%). Surfactant monolayers, which are both macroscopically and microscopically flat, allow a direct and unambiguous comparison between simulated and experimental surface tensions, in contrast to bilayers where comparisons are confounded by potential finite-size effects.30 The results for the DPPC monolayer surface tension strongly support the utility of the alkane and lipid parameters in the CHARMM parameter set, C27r. The errors in the surface tension for water are somewhat higher: 23% and 15% underestimates for TIP3P and TIP4P-Ew, respectively (Table 5). Hence, it is likely that the discrepancies of the hexadecane/water surface tension can be reduced by improving the water model, rather than the alkane potential. The errors in the alkane/water or water/ vapor surface tensions have little effect on the monolayer surface tensions, because the dominant contributions are at the head-group/water and chain/vapor interfaces.
TABLE 5:
Summary of the Most Accurate Surface Tensions (dyn/cm) Calculated (2D IPS with the Highest Cutoff Listed in the Previous Tables or PME/IPS with rc = 10 Å), Surface Tensions Calculated without Long-Range Lennard-Jones Interactions (PME with rc = 10 Å), and Experiment
| system | Most accurate | no long-range LJ | expta |
|---|---|---|---|
| heptane (298.15 K) | 18.7 | 9.0 | 19.825 |
| hexadecane (323.15 K) | 25.2 | 12.1 | 25.025 |
| water (TIP3P, 303.15 K) | 55.3 | 47.5 | 71.227 |
| water (TIP3P, 323.15 K) | 52.2 | 45.7 | 67.927 |
| water (TIP4P-Ew, 323.15 K) | 57.4 | 53.2 | 67.927 |
| hexadecane/water (TIP3P, 298.15 K) | 48.2 | 44.9 | 53.325 |
| hexadecane/water (TIP4P-Ew, 298.15 K) | 57.3 | 53.4 | 53.325 |
| DPPC monolayer (54 Å2/lipid, 323.15 K) | 21.6 | 17.1 | 17.932 |
| DPPC monolayer (64 Å2/lipid, 323.15 K) | 42.9 | 40.7 | 40.932 |
| DPPC monolayer (80 Å2/lipid, 323.15 K) | 55.5 | 53.5 | 54.932 |
| DPPC bilayer (64 Å2/lipid, 323.15 K) | 19.7 | 16.8 |
Experimental values for DPPC monolayers are at 321.15 K; experimental values for a microscopic (simulation-sized) bilayer patch are not available.
It should be noted that the parametrizations of TIP3P and TIP4P-Ew water models used different methods to include long-range interactions. The TIP3P water model was optimized with short-range LJ and electrostatic cutoffs of 7.5 Å,13 with long-range effects implicitly included. Consequently, long-range energies with PME/IPS are different than those used in the TIP3P parametrization. TIP4P-Ew was parametrized using a longer LJ cutoff of 9.5 Å and PME,14 so long-range energetic differences with PME/IPS should be reduced. Nevertheless, differences in the cutoff methods used for parametrization and the present calculation lead to ambiguities in the precise values of the surface tensions for these models.
Table 5 also compiles the surface tensions calculated with PME(rc=10). A comparison with 2D IPS (for alkanes and water) and PME/IPS (hexadecane/water and DPPC bilayer and mono-layers) yields insight into the importance of long-range LJ interactions for a range of systems. Not surprisingly, pure alkanes show the largest percentage increases. Although the percent increase is substantially smaller for water than for alkanes, the 4–8 dyn/cm increases in magnitude is comparable to that for heptane. Increases for hexadecane/water are somewhat less than those for pure water. This implies that contributions from hydrophobic interactions to the surface tension in alkane/ water systems are relatively insensitive to long-range LJ interactions. The increases for lipid bilayers and monolayers are comparable to each other and to those for hexadecane/water, even though the magnitudes of the surface tensions are quite different. This supports that notion that hydrophobic interactions make a substantial contribution the surface tension at the lipid/ water interface. This relatively small increase for monolayers implies that the acyl chain/air interface of a monolayer is considerably more structured than the hexadecane/vapor inter-face and is thereby less sensitive to long-range LJ interactions. Much of this chain ordering arises from the constraints at the headgroup/water interface, which, of course, are absent in a hexadecane/vapor system.
Although a rigorous treatment of long-range electrostatics is essential for calculating the electrostatic potential drop across interfaces, the contributions of long-range LJ interactions contribute only approximately 5% of the total. This might be explained by the slight increase in density associated with these interactions. The dipole orientations of water for the hexadecane/ water and pure water interface are similar (see Figure 5). The dipole of water is directed toward the alkane or vapor at the interface and away from the hydrophobic phase just outside the interface. The calculated potential drop from the hexadecane interface to water is greater for TIP4P-Ew than for TIP3P, where ∆Ψ is 40 ± 2 and 18 ± 2 mV, respectively.
In contrast to the generally very good results for surface tension, those for ∆Ψ are poor for water-containing interfaces: approximately 500 and 850 mV for water and a DPPC bilayer from simulation versus 100 and 250 mV from experiment.33 Experimentally, ∆Ψ values for monolayers are approximately 100 mV higher than for the corresponding bilayer,33,34 presumably because the chain/vapor interface is not present in bilayers. Here, the simulated difference is closer to 500 mV, as is consistent with the value obtained for hexadecane/vapor. Hence, the calculated 444 ± 4 and 534 ± 6 mV drops for heptane/ vapor and hexadecane/vapor are likely too high, although experimental data are not available for comparison. Patel and Brooks8 recently reported that a polarizable alkane models reduces the magnitude of the hexane/vapor potential drop obtained by C27r from 434 to 179 mV. These results suggest that a polarizable model is required to satisfactorily describe the potential drops for interfacial systems.
In conclusion, the isotropic periodic sum offers an efficient and accurate method for calculating long-range interactions for interfacial systems, which obviates the need to use the computationally demanding LRC in pressure. The efficiency and accuracy of 2D IPS compared to PME(rc=25) demonstrates that this method can be used as a benchmark to test the hybrid PME/ IPS method on more complex l/v systems. The success of PME/ IPS on lipid monolayers and bilayers suggests that this method can also be used in simulations of large interfacial systems, such as membrane proteins embedded in lipid and lipid/cholesterol bilayers.
Acknowledgment.
This research was supported in part by the Intramural Research Program of the NIH, National Heart, Lung, and Blood Institute.
References and Notes
- (1).Alper HE; Bassolino D; Stouch TR J. Chem. Phys 1993, 98, 9798. [Google Scholar]
- (2).Feller SE; Pastor RW; Rojnuckarin A; Bogusz S; Brooks BR J. Phys. Chem 1996, 100, 17011. [Google Scholar]
- (3).Jungwirth P; Tobias DJ Chem. ReV 2006, 106, 1259. [DOI] [PubMed] [Google Scholar]
- (4).Patra M; Karttunen M; Hyvonen MT; Falck E; Lindqvist P; Vattulainen I Biophys. J 2003, 84, 3636. [DOI] [PMC free article] [PubMed] [Google Scholar]
- (5).Polyansky AA; Volynsky PE; Nolde DE; Arseniev AS; Efremov RG J. Phys. Chem. B 2005, 109, 15052. [DOI] [PubMed] [Google Scholar]
- (6).Darden T; York D; Pedersen LJ Chem. Phys 1993, 98, 10089. [Google Scholar]
- (7).Lagüe P; Pastor RW; Brooks BR J. Phys. Chem. B 2004, 108, 363. [Google Scholar]
- (8).Patel SA; Brooks CL J. Chem. Phys 2006, 124, 204706. [DOI] [PubMed] [Google Scholar]
- (9).Wu XW; Brooks BR J. Chem. Phys 2005, 122, 044107. [DOI] [PMC free article] [PubMed] [Google Scholar]
- (10).Klauda JB; Brooks BR; MacKerell AD Jr.; Venable RM; Pastor RW J. Phys. Chem. B 2005, 109, 5300. [DOI] [PubMed] [Google Scholar]
- (11).Klauda JB; Pastor RW; Brooks BR J. Phys. Chem. B 2005, 109, 15684. [DOI] [PMC free article] [PubMed] [Google Scholar]
- (12).Durell SR; Brooks BR; Bennaim AJ Phys. Chem 1994, 98, 2198. [Google Scholar]
- (13).Jorgensen WL; Chandrasekhar J; Madura JD; Impey RW; Klein ML J. Chem. Phys 1983, 79, 926. [Google Scholar]
- (14).Horn HW; Swope WC; Pitera JW; Madura JD; Dick TJ; Hura GL; Head-Gordon TJ Chem. Phys 2004, 120, 9665. [DOI] [PubMed] [Google Scholar]
- (15).Klauda JB; Brooks BR; Pastor RW J. Chem. Phys 2006, 125, 144710. [DOI] [PMC free article] [PubMed] [Google Scholar]
- (16).Skibinsky A; Venable RM; Pastor RW Biophys. J 2005, 89, 4111. [DOI] [PMC free article] [PubMed] [Google Scholar]
- (17).Venable RM; Skibinsky A; Pastor RW Mol. Simul 2006, 32, 849. [Google Scholar]
- (18).Brooks BR; Bruccoleri RE; Olafson BD; States DJ; Swaminathan S; Karplus MJ Comput. Chem 1983, 4, 187. [Google Scholar]
- (19).Ryckaert JP; Ciccotti G; Berendsen HJ C. J. Comput. Phys 1977, 23, 327. [Google Scholar]
- (20).Hoover WG Phys. ReV. A 1985, 31, 1695. [DOI] [PubMed] [Google Scholar]
- (21).Nosé S; Klein ML J. Chem. Phys 1983, 78, 6928. [Google Scholar]
- (22).Andersen HC J. Chem. Phys 1980, 72, 2384. [Google Scholar]
- (23).Nagle JF; Tristram-Nagle S Biochim. Biophys. Acta: ReV. Biomembr 2000, 1469, 159. [DOI] [PMC free article] [PubMed] [Google Scholar]
- (24).Feller SE; Venable RM; Pastor RW Langmuir 1997, 13, 6555. [Google Scholar]
- (25).Small DM Handbook of Lipid Research; Plenum Press: New York, 1986; Vol. 4. [Google Scholar]
- (26).Lide DR, Ed. CRC Handbook, 81st ed.; CRC Press: Boca Raton, FL, 2000. [Google Scholar]
- (27).Lemmon EW; McLinden MO; Friend DG Thermophysical Properties of Fluid Systems. In NIST Chemistry WebBook, NIST Standard Reference Database Number 69; Linstrom PJ, Mallard WG, Eds.; National Institute of Standards and Technology: Gaithersburg, MD, 2005. [Google Scholar]
- (28).Bockris J; Khan S Surface Electrochemistry: A Molecular LeVel Approach; Plenum Press: New York, 1993. [Google Scholar]
- (29).Kučerka N; Tristram-Nagle S; Nagle JF Biophys. J 2006, 90, L83. [DOI] [PMC free article] [PubMed] [Google Scholar]
- (30).Klauda JB; KucÏerka N; Brooks BR; Pastor RW; Nagle JF Biophys. J 2006, 90, 2796. [DOI] [PMC free article] [PubMed] [Google Scholar]
- (31).Crane JM; Putz G; Hall SB Biophys. J 1999, 77, 3134. [DOI] [PMC free article] [PubMed] [Google Scholar]
- (32).Somerharju PJ; Virtanen JA; Eklund KK; Vainio P; Kinnunen PK J. Biochemistry 1985, 24, 2773. [DOI] [PubMed] [Google Scholar]
- (33).Clarke RJ AdV. Colloid Interface Sci 2001, 89, 263. [DOI] [PubMed] [Google Scholar]
- (34).Berkowitz ML; Bostick DL; Pandit S Chem. ReV 2006, 106, 1527. [DOI] [PubMed] [Google Scholar]