Abstract
Metabolomics analysis provides a unique opportunity for comprehensive mapping of glutamatergic system function using high-throughput metabolite analysis and providing a perspective of the enzymatic activity, which cannot be obtained by other systems biology techniques.
Keywords: metabolomics, brain, glutamate, glutamate receptor, metabolites, gas chromatography, mass spectrometry
1. Introduction
Metabolomics is a systems biology platform that utilizes a high-throughput measurement technology of the complete set of metabolites that reflects an imprint of all factors that contribute to the actual physiological state of the organism and which can be integrated with the other ‘omic’ technologies to identify the disease mechanisms or provide valuable information for the development of diagnostic or risk prediction models. Using a range of analytical tools that includes mass spectrometry - based approaches or nuclear magnetic resonance, the collected data of all metabolites identified in a biological system are scaled by computational analyses to identify novel biomarkers or affected metabolic pathways. In this technical context, the large-scale metabolomics studies have been focused mostly on the untargeted profiling of biological fluids and a limited number, on the metabolic fingerprinting of post-mortem human brain [1]. Previous studies have shown that brain metabolism is extremely sensitive to glutamate receptor function [2, 3]. Thus, metabolomics analysis represents a novel approach to the study of the diversity of the effects of the contribution of glutamate receptors to physiological and pathological conditions, synaptic activity, and process related to learning and memory. Metabolomics workflow typically consists of several steps: preparation of the samples, extraction of metabolites, data acquisition, peak identifications and quantifications, and bioinformatics analysis [4]. In this chapter, we will describe the metabolomics approach based the application of gas chromatography coupled to mass spectrometry (GC/MS) for the analysis of metabolites in the rodent brain.
2. Materials
All reagents must be analytical grade (HPLC). All aqueous solutions used throughout this protocol should be prepared with milliQ or deionized water (18.2 MΩ-cm, at 4°). When possible all procedures should be performed using glass appliances. The whole extraction needs to be performed at 4°C since the metabolites can degrade as little as a few seconds.
2.1. Brain tissue preparation
Ice-cold saline solution (0.9% NaCl). Add about 100 mL water to a 1 L graduated cylinder or a glass beaker. Weigh 9 g NaCl and transfer to the cylinder. Make up to 1 L with water. Store at 4°C
Wet ice
Dry ice
Aluminum foil
Liquid nitrogen
Petri dish (100mm × 15mm)
1.5 ml Eppendorf vials
2.2. Extraction of metabolites and RNA from brain tissues
35 to 50 mg frozen rodent brain tissues (see Note 1)
Extraction solution: Chloroform/Methanol/Water 2:5:2 (by volume)
Borosilicate glass disposable culture tubes 16×100mm
Glass pipettes, 10 ml
50 ml plastic beaker
Pasteur pipettes and pipette rubber bulbs
Tissue homogenizer (e.g. Polytron PT 1200)
Vortex
Reaction tube centrifuge (e.g., Eppendorf 5810 R)
Vials, screw top, clear glass, 1.5 mL, thread 8–425
Assembled screw cap with hole with PTFE/silicone septum, thread 8–425 (Cat# 27093-U Sigma-Aldrich)
Plastic caps solid-top, thread 8–425
Scissors
Rotary vacuum evaporator
Methanol
RNAEasy mini kit (Qiagen)
2.3. Metabolites derivatization
Derivatization solution 1: 20 mg/mL Methoxyamine hydrochloride in pyridine (see Note 2)
Derivatization solution 2: N-tert-Butyldimethylsilyl-N-methyltrifluoroacetamide with 1% tert-Butyldimethylchlorosilane (MTBSTFA+1% TBDMSCl, mixture 99:1, Cat # 375934–10X1ML, Sigma-Aldrich)
Glass pipettes, 10 ml
Vials, screw top, clear glass, 1.5 mL, thread 8–425
Black plastic caps with solid top, white rubber liner, thread 8–425
Vials, screw top, clear glass, 4 mL, thread 13–425
Black plastic caps, solid top, white rubber liner, thread 13–425
Dry Block Incubator for glass vials (diameter of the well ~14 mm)
1.5 ml Eppendorf vial
Reaction tube centrifuge (e.g., Eppendorf 5415D)
Glass inserts (Cat # 29445-U, Sigma-Aldrich) (see Note 3).
Assembled screw cap with hole with PTFE/silicone septum, thread 8–425 (Cat# 27093-U Sigma-Aldrich
Hexane ≥ 95% for HPLC
2.4. GC/MS analysis and data acquisition
GC/MS
Fused-silica capillary column RXI-5MS (0.25 mm inner diameter, 0.25 μm D.F.,30 m)
Hexane ≥ 95% for HPLC
NIST/EPA/NIH Mass spectral Library (NIST14)
3. Methods
3.1. Isolation of the rodent brain regions
Separate the Petri dish: cover the top with the aluminum foil, place on dry ice.
The bottom part of the Petri dish fill with 10 ml of ice-cold saline and place on wet ice.
Use cervical dislocation to prevent pre-and postsynaptic effects of anesthesia. Remove the brain, as explained in details [5], and wash with ice–cold saline for 30 sec to remove the excess of blood.
Place the brain on the cold dish covered with the aluminum foil and rapidly isolate the brain regions of interest [5], immediately immerse tissues in liquid nitrogen to quench metabolism.
Transfer frozen tissues in the Eppendorf vials and store at −80 °C until further analysis.
3.2. Extraction of metabolites
Frozen mouse brain tissues transfer into pre-cooled (wet-ice) borosilicate glass disposable culture tubes 16×100mm and keep on ice during the homogenization step. Add 2 ml of pre-cooled extraction solution to each tube. For homogenization step, select one tube and place in 50 ml plastic beaker containing wet-ice and homogenize the tissue sample three times for 15 s, with 30 s intervals (to ensure freezing temperatures in sample vials) between the homogenization steps. Perform homogenization for all samples.
Vortex samples for 15 min at 4°C.
Centrifuge at 100 × g for 5 min at 4°C.
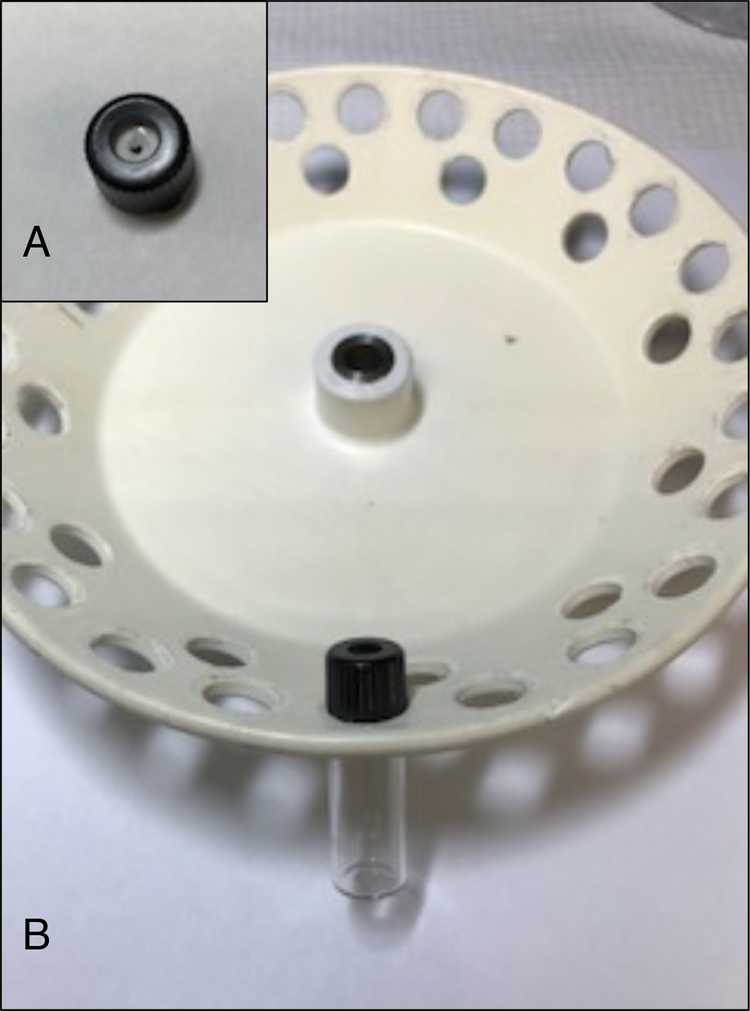
De-assemble the screw cap and remove silicone septum. Perforate it using scissors and mount vials onto a rotary vacuum evaporator (Fig. 1A) (see Note 4).
Collect supernatants after step 3, transfer to a glass vials using Pasteur pipettes and pipette rubber bulbs.
Attach vials to a rotary vacuum evaporator (Fig. 1 B).
Evaporate supernatants to dryness using a rotary vacuum evaporator, replace caps with solid tops, put vials in desiccator and store at −80°C for at least four weeks.
Collect the pellet from step 3 to perform RNA extraction, place it in the Eppendorf vial, and wash with 300 μL cold methanol.
Centrifuge at 16,100 × g for 5 min at 4 °C. Remove methanol, and extract mRNA using RNAEasy mini kit (Qiagen). Alternatively, add 50 μL methanol at −20 °C, and store the pellet at −80 °C until further extraction of RNA (see Note 5).
Identify the amount of RNA for each sample.
Figure 1.
Mounting vials onto a rotary vacuum evaporator. (A) Example of perforated silicone septum from the screw cap. (B) Assembling the glass vial to a rotary vacuum evaporator.
3.3. Metabolites derivatization
Prepare the Derivatization solution 1: mix 20 mg Methoxyamine hydrochloride in 1 ml pyridine using 4 mL glass vials with plastic caps solid-top, thread 13–425 (see Note 6). Briefly vortex obtained solution at RT until Methoxyamine hydrochloride is fully dissolved.
Take out dried samples from storage and allow them to warm up to room temperature for at least 15 min before derivatization (see Note 7) and add 50 μL Derivatization solution 1, close tightly the vials with closed caps and incubate at 37°C for two hours.
Remove samples, add 50 μL of the Derivatization solution 2 (see Note 8) directly to the reaction mixture in the vial, close tightly the vials with closed caps and incubate for an additional 1 h at 60°C.
Transfer the reaction mixture to labeled Eppendorf vial and centrifuge at 16.100 × g for 10 min at RT.
Transfer the supernatant in the new glass vial and immediately close each sample with solid plastic cap, thread 8–425. Store: for long time at −20°C and for short time at 4°C. (see Note 9).
For the analysis place a glass insert in the new glass vial and dilute each sample 1:50 with hexane prior to GC/MS analysis (see Note 10).
3.4. GC/MS analysis
The mass spectrometer must be tuned according to the manufacturer’s manuals for optimal parameters for ion lenses, detector voltage and other settings. Usually, this can be performed in autotune operation.
Inject 1 μL of each sample in the GC-MS.
Separate metabolites using a GC temperature ramping program. The GC oven can be programmed from 100°C to 280°C at a rate of 4°C/min. The injection port temperature will be 280°C, and helium is used as the carrier gas at a constant linear velocity of 39 cm/sec. Injection mode – split (15:1).
Detect metabolites by setting the ion source filament energy to 70 eV, the ion source temperature - 200°C, and the scan range (mass-to-charge (m/z) 35 – 600 Da.
3.5. Data acquisition and analyses
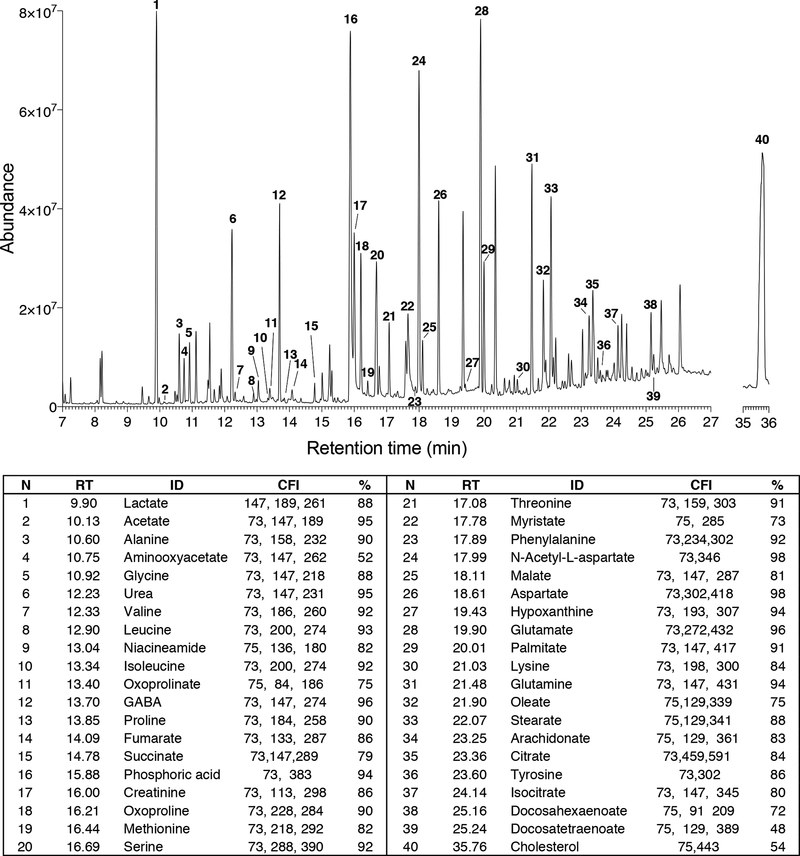
Obtain the total ion chromatogram and mass chromatograms for each detected metabolite (Fig. 2). GC/MS instruments generate a single file per sample, a list of mass spectra together with their corresponding retention times (RTs). These spectra are commonly shown on a chromatogram represented by RT on the horizontal axis and signal intensity on the vertical axis (Fig. 2).
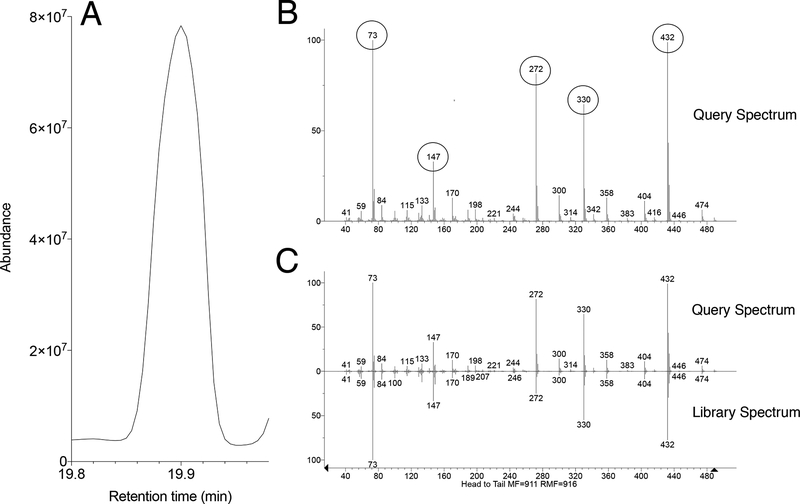
Identify metabolites based on the fragmentation pattern of molecular ions (characteristic fragment ions) using the GC/MS manufacturer’s software equipped with NIST/EPA/NIH Mass spectral Library (NIST14) (Fig. 3) (see Note 11).
Figure 2.
Typical GC-MS total ion current chromatogram (TIC) of metabolites extracted from the brain tissue. RT – retention time, ID- metabolite identity, CFI - characteristic fragment ions, % - identification probability value.
Figure 3.
Identification of glutamate in brain extracts. (A) Fragment of total TIC showing glutamate (RT – 19.90 min). (B) Product ion spectra obtained for glutamate (CFI – m/z73, 147, 272, 330, 432). (c) Product ion spectra obtained for glutamate matched to spectra in the NIST 14 Mass Spectral Library.
3.6. Statistical analysis
Quantify each peak using the maximum peak intensity value and organize data as a “peak intensity table” using MS Excel or similar software (see Note 12). The table must include metabolite identities and peak intensity values and saved in Comma Separated Values (.csv) or Tab Delimited Text (.txt). Perform statistical analyses using free online tool MetaboAnalyst.ca [9] (see Note 13).
Open MetaboAnalyst.ca, choose “Statistical Analysis”, upload the “peak intensity table” and submit. If the table was organized correctly and saved in the required format, the “Data Integrity Check” will pass the information for further analysis. Click “Skip” button to accept the default practice.
In “Data Filtering” click “None” (see Note 14).
Perform data normalization to remove unwanted variations between the samples. First, perform “Sample-specific normalization” and put the amount of RNA identified for each sample in Section 3.2.10. Click “Proceed”. (see Note 15).
Perform “Quality Control” to improve downstream results (see Note 16).
For two groups (control and experimental) perform Univariate Analysis (Fold Change Analysis, T-tests, Volcano plot, Correlation Analysis).
For more groups (different brain regions and treatments) perform chemometrics analysis (Principal Component Analysis (PCA), Partial Least Squares - Discriminant Analysis (PLS-DA), Feature Identification and Cluster Analysis (see Note 17).
3.7. Pathway prediction analysis
Organize data as said in Section 3.6.1. For the pathway prediction analysis, the table must include metabolite identities annotated with a database such as Human Metabolome Database (HMDB) and correspondent peak intensity values (see Note 18).
Perform “Data Integrity Check”, “Data Filtering” and “Data Normalization” as said in section 3.6.2 – 3.6.4 and click “Proceed”.
Select a pathway library: Mouse, Rat etc.
Select pathway analysis algorithms “Pathway Enrichment Analysis - Global Test” and “Pathway Topology Analysis” Relative-Betweeness Centrality” to accept the default practice.
Select a reference metabolome: “Use all compounds in the selected pathways” to accept the default practice and click “Submit”.
Obtained metabolome view on the left will show all matched pathways according to P values from pathway enrichment analysis and pathway impact values from pathway topology analysis (see Note 19).
3. Notes
35 to 80 mg of frozen rodent brain tissues is sufficient for extraction of metabolites using GC/MS. If amount of tissue from the region of interest is less than 35 mg, pooling of the tissue samples from pairs of animals per condition is recommended to achieve required amount of tissue for the analysis. Extraction of metabolites must be done using at least 6 biological replicates per condition which either control or experimental groups including brain region.
Methoxyamine hydrochloride is very sensitive to moisture. Storage is recommended under the vacuum at RT.
Glass inserts decrease the surface area inside the vial allowing to achieve maximum sample recovery and easier sample removal.
De-assemble the screw cap and remove silicone septum. Perforate it using scissors and mount the vials onto a rotary vacuum evaporator. This step is required to minimizes sample cross-contamination during evaporation.
RNA extraction is a crucial step for experimental consistency [9]. Identified amount of RNA per sample will be required for statistical analysis described in Section 3.6. In addition, RNA could be further used for Real time - PCR to analyze the gene expressions pattern.
Derivatization solution 1 must be freshly prepared.
During derivatization avoid contact with moisture, which will result in metabolite degradation. If samples are not dried, it is necessary proceed to an additional evaporation as said in Section 3.2.6 – 3.2.7.
Derivatization solution 2 must be used from freshly opened vials.
If analysis is performed after samples preparation, wait two hours before injecting the first sample into the GC-MS.
The sample concentration must be adequately adjusted to give the sufficient chromatogram, then it needs to be concentrated before injecting the sample into the gas chromatograph. Dilution of sample (1:50) was found to be sufficient for the analysis. However, if the signal is too low, the concentration could be increased.
MS detects the mass of the molecular ions and the masses of the fragment ions. The database contains extensive information of many compounds including the masses of fragment ions that help to perform successful metabolite identification. In addition, to ensure the valid peak identification, data can be also processed using deconvolution method, which is a signal processing technique that estimates the relative area corresponding to each individual peak when multiple peaks overlap within the same spectral region. This is especially important for low abundant metabolites that might co-elute with abundant major peaks. For general quadrupole mass spectrometers, data deconvolution by the freely available software AMDIS is recommended http://chemdata.nist.gov/mass-spc/amdis/).
Some of metabolites so-called “missing values” will not be identified in chromatograms. Therefore, when composing the table for the analysis, missing values should be presented as empty values or NA without quotes.
MetaboAnalyst is a web server designed to permit comprehensive metabolomics data analysis, visualization and interpretation [6]. The web interfaces of MetaboAnalyst are designed to be self-explanatory. Therefore, most steps are documented on top of the corresponding pages. Available tutorials and sample data sets complement the information by providing step-by-step instructions for several most common tasks.
This step is strongly recommended for metabolomics datasets with large number of variables (more than 2000 metabolites), since many of them are from baseline noises. Usually GC/MS analysis of brain tissues could identify less than 60 variables.
The normalization procedures are grouped into three categories. The sample normalization allows general-purpose adjustment for differences among your sample, which can include the initial weight of the tissue from where metabolites were extracted, protein content or RNA. Data can be further transformed by “log” or “cube root” and/or scaled via “mean centering, autoscaling, pareto scaling and range scaling” (please see the description of each in the MetaboAnalyst program). According to van den Berg et al (2006), autoscaling and range scaling performed better than the other pretreatment methods and showed biologically sensible results in chemometrics analysis [10]. Data transformation and scaling are two different approaches to make individual features more comparable that can be used individually or in combination. Scaling is recommended procedure when variables have very different orders of magnitude [6].
“Quality Control” is required to detect outliers. It can be done by visual inspection. Many outliers could be corrected by normalization or excluded from the analysis. In many cases, outliers are the result of operational errors during analytical process. If those values cannot be corrected, they should be removed from analysis, but always justified [6].
Please refer to MetaboAnalyst tutorials, or FAQ to select the statistical analysis method.
HMDB is a freely available electronic database containing detailed information about metabolites found in the human body and each metabolite has a unique identification number.
The node color is based on its P value and the node radius is determined based on their pathway impact values. Please refer to MetaboAnalyst tutorials, or FAQ to interpret the pathway analysis results.
Acknowledgements:
This work was supported by INBRE-PR NIH Grant 8P20GM103475
References
- 1.Vasilopoulou CG, Margarity M, and Klapa MI (2016) Metabolomic Analysis in Brain Research: Opportunities and Challenges. Front Physiol 7:183. [DOI] [PMC free article] [PubMed] [Google Scholar]
- 2.Moussa CE-H, et al. (2002) Effects of L-Glutamate Transport Inhibition by a Conformationally Restricted Glutamate Analogue (2S,1’S,2’R)-2-(Carboxycyclopropyl)Glycine (L-CCG III) on Metabolism in Brain Tissue In Vitro Analysed by NMR Spectroscopy. Neurochem Res 27 (1):27–35 [DOI] [PubMed] [Google Scholar]
- 3.Rae C, et al. (2006) A Metabolomic Approach to Ionotropic Glutamate Receptor Subtype Function: A Nuclear Magnetic Resonance in vitro Investigation. J Cereb Blood Flow Metab 26 (8):1005–1017 [DOI] [PubMed] [Google Scholar]
- 4.Kanani H, Chrysanthopoulos PK, and Klapa MI (2008) Standardizing GC–MS metabolomics. J Chromatogr B 871 (2):191–201 [DOI] [PubMed] [Google Scholar]
- 5.Spijker S (2011) Dissection of Rodent Brain Regions In: Li KW (ed) Neuroproteomics. Humana Press, Totowa, NJ, pp 13–26 [Google Scholar]
- 6.Xia J, et al. (2015) MetaboAnalyst 3.0—making metabolomics more meaningful. Nucleic Acids Res 43 (W1):W251–W257 [DOI] [PMC free article] [PubMed] [Google Scholar]


