

Abstract
Alzheimer’s disease (AD) is known to be associated with loss of cholinergic neurons in the nucleus basalis of Meynert, located in the posterior basal forebrain. Structural changes of septal nuclei, located in the anterior basal forebrain, have not been well studied in AD. Using a validated algorithm, we manually traced septal nuclei on high-resolution coronal magnetic resonance imaging (MRI) in 40 subjects with mild cognitive impairment (MCI) or AD, 89 healthy controls, and 18 subjects who were cognitively normal at the time of MRI but went on to develop AD an average of 2.8 years later. We found that cognitively normal subjects destined to develop AD in the future had enlarged septal nuclei as compared to both healthy controls and patients with current MCI or AD. To our knowledge, this is the first time a brain structure has been found to be enlarged in association with risk of AD. Further research is needed to determine if septal enlargement reflects neuroplastic compensation, amyloid deposition, inflammation, or another process and to determine whether it can serve as an early MRI biomarker of AD.
Keywords: Alzheimer’s disease, Dementia, Mild cognitive impairment, Septal nuclei, Basal forebrain, MRI, Manual tracing, Acetylcholine, Morphometry
1. Introduction
Based on autopsy and neuroimaging studies, Alzheimer’s disease (AD) is associated with loss of cholinergic neurons in the nucleus basalis of Meynert (NBM), located in the posterior basal forebrain (BF) (Teipel et al., 2005; Whitehouse et al., 1981). NBM atrophy occurs early in the course of AD (Grothe et al., 2012) resulting in a cortical cholinergic deficit that can be partially ameliorated with cholinergic medication; this is the rationale for the use of acetylcholinesterase inhibitors to treat symptoms of AD.
The role of anterior BF structures in AD, in particular the septal region, has been less studied. The human septal region is located under and contiguous with the septum pellucidum and contains well-developed nuclei including the ventrolateral, dorsolateral, intermediolateral, septofimbrial, and medially, the vertical limb of the diagonal band of Broca (Andy and Stephan, 1968; Mai et al., 2004). Septal nuclei are strongly interconnected with hippocampi via the fimbria/fornix and are critical for generating the hippocampal theta rhythm needed for learning and memory (Buzsaki, 2002; Gu and Yakel, 2011; Hangya et al., 2009; Huerta and Lisman, 1993; Stewart and Fox, 1990; Winson, 1978). Septal lesions impair memory in animals (Baxter et al., 2013; Winson, 1978) and humans (Alexander and Freedman, 1984; Fujii et al., 2002). Larger septal volume has been associated with better contextual memory in young healthy subjects (Butler et al., 2012). One might expect that septal atrophy, like NBM atrophy, would be an early finding in the development of AD. However, there are hints that this is not the case: autopsy studies demonstrate preserved septal cholinergic cell bodies (Mufson et al., 1989; Vogels et al., 1990) with increased cholinergic innervation of the hippocampus in early AD (DeKosky et al., 2002; Geddes et al., 1985; Hyman et al., 1987). Neuroimaging studies that divide the BF into anterior and posterior divisions show atrophy in early AD only in the posterior BF and NBM, with relative preservation of the anterior BF structure until the late stages of AD (Grothe et al., 2012; Kerbler et al., 2015; Kilimann et al., 2014).
Complicating assessment of the human septal region using neuroimaging is the fact that they are small (~290 mm3) (Butler et al., 2014) and in a location at the base of the brain, in between the ventricles that can be prone to artifacts in magnetic resonance imaging (MRI) studies, especially those that use automated processing. Septal nuclei are not included in any of the standard neuroanatomical parcellation schemes typically used to interpret human neuroimaging studies (Fischl et al., 2002; Tzourio-Mazoyer et al., 2002). To address this issue, we developed a manual tracing algorithm based on histology to accurately measure septal nuclei volume in vivo using MRI (Butler et al., 2014). Here, we used this tracing algorithm to measure septal volume in healthy controls, patients with current MCI or AD, and participants who were clinically normal at the time of MRI but later went on to develop AD.
2. Materials and methods
2.1. Participant selection
All subjects were recruited by the Center for Brain Health (CBH) at the NYU School of Medicine for institutional review board—approved longitudinal studies of aging, cognitive decline, and AD risk factors. A convenience sample was selected from the CBH data set to include all participants scanned on the same 1.5-T MRI, aged older than 55 years and diagnosed as MCI or AD at any time point, as well as a random sample of normal participants. The purpose of this selection strategy was to “enrich” the sample with participants with current or future MCI/AD, which constitutes a low proportion of the CBH data set. Later, we excluded MCI subjects who did not eventually decline to AD to avoid diagnostic uncertainty and heterogeneity inherent to the diagnosis of MCI. Each subject had an MRI (see acquisition protocol below).
2.2. Participant assessment
All participants underwent medical, psychiatric, and neurological assessments, as well as routine blood tests, electrocardiogram, and detailed neuropsychological testing that included the Mini—Mental Status Examination (Folstein et al., 1975) and Clinical Dementia Rating scale (Morris, 1993) as well as other elements of the National Alzheimer’s Coordinating Center (NACC) Uniform Data Set Neuropsychological Test Battery. A diagnosis of normal, MCI, or AD dementia was made in accord with standard criteria (Albert et al., 2011; McKhann et al., 2011) by an experienced clinician based on the diagnostic interview with the participant and his/her study partner and review of all available information including cognitive test scores and neuroimaging.
2.3. MRI acquisition
MRI was performed on the same quality-controlled high-resolution 1.5-T GE scanner between 1994 and 2013. The scanner did not undergo hardware or software upgrades during this time period. The examination included a T1-weighted spoiled gradient echo sequence with repetition time = 35 ms, time to echo = 2 ms, flip angle = 60°, number of excitations = 1, voxel size = 0.8 × 0.8 × 1.6 mm, field of view = 200 mm, and matrix = 256 × 192 × 124, reconstructed as 256 × 256. Although the examination also included Fluid-attenuated inversion recovery (FLAIR), T2-weighted, and diffusion-weighted sequences, only T1-weighed data were used for septal nuclei volumetric analysis.
2.4. MRI analysis
Tracing was performed on de-identified T1 MRIs by 5 independent tracers. After a training period during which tracers reached consensus on septal boundaries in a set of training scans, each tracer traced between 30 and 60 scans. All tracers traced a random subset of 11 scans (different than the training scans) to evaluate interrater reliability. After tracing was completed, it was found that 1 tracer had not accurately followed the tracing rules, and another had traced scans from only 1 of the 3 diagnostic categories, so their scans were excluded from further analysis.
2.5. Diagnostic classification of scans
Scans were divided into 3 categories as follows: For subjects with a diagnosis of AD at any time point, a scan obtained at least 1 year before the diagnosis of MCI/AD, when the participant was cognitively normal, was selected for analysis if available. This group was deemed “future AD” (n = 18). Scans from AD patients obtained after a diagnosis of MCI or AD had been made were deemed “current MCI/AD” (n = 40). This group included 5 participants scanned at the time they were diagnosed with MCI who later declined to AD and 35 participants scanned after they had been diagnosed with AD. Normal participants had at least 1 year of follow-up and were diagnosed as normal at all time points (n = 89.). For participants with more than 1 MRI scan that qualified for the aforementioned categories, the earliest scan was selected.
Tracing was performed using a validated and published semi-automated tracing algorithm implemented in FireVoxel (Mikheev et al., 2008). As described in more detail in the study by Butler et al., 2014, all scans were first reformatted to coronal planes perpendicular to a line connecting the anterior and posterior commissures. Coronal slices were traced from anterior to posterior. The anterior septal boundary was defined as the most anterior coronal slice in which the bilateral globus pallidus was visible and gray matter at the base of the septum pellucidum was present. The superior extent of septal nuclei was defined by the plane where the membranous septum pellucidum widened into septal nuclei. Lateral boundaries were defined by parallel sagittally oriented planes through the most inferior and medial aspect of each lateral ventricle. When a slice was anterior to the crossing fibers of the anterior commissure, the inferior boundary was the base of the brain. When the crossing fibers of the anterior commissure were fully visible, they served as the inferior boundary. The posterior boundary was defined by the following rule—A slice was considered to contain septal gray matter if it met at least 2 of the following 3 criteria: (1) the T1-weighted signal intensity indicates the presence of some gray matter (rather than pure white matter intensity); (2) presence of the crossing fibers of the anterior commissure; and (3) lack of cerebrospinal fluid (CSF) space in the center of the septal region (corresponding to CSF space between columns of the fornix). We used these boundaries and landmarks to create an overinclusive 3D region of interest (ROI). In the next step, we identified CSF voxels as having intensity less than half the average intensity of the white matter. The final step consists of automatic removal of CSF voxels from the overinclusive 3D ROI, yielding the septal ROI, whose volume in cubic millimeter was calculated and recorded.
In addition, we measured the width of the lateral ventricles, which could potentially confound septal measurement (marked ventriculomegaly may distort/stretch the septal region; Butler et al., 2013, 2014) and which also provides a measure reflecting overall brain atrophy. The ventricular width was defined as the widest distance in the left-right direction at the superior extent of the ventricles measured on a coronal slice also containing the septal gray matter.
2.6. Statistical analysis
General linear models were used to compare septal volume and ventricular width between groups (normal, future AD, and current MCI/AD.) Tracer was included as a covariate. The dependent variable was residualized against age and height (a proxy for head size). Post hoc pairwise comparisons between groups were Bonferroni corrected for multiple comparisons. Statistical significance was defined as a p value <0.05. Interrater reliability was assessed using average intraclass correlation coefficient. SPSS (version 22; SPSS, Inc., Chicago, IL) software was used for all analyses.
3. Results
3.1. Participant characteristics
Participant characteristics are presented in Table 1, Participants differed by age at the time of scanning: patients with current MCI/ AD or those destined to develop AD in the future were older than normal controls. As expected, current MCI/AD patients had lower Mini—Mental Status Examination and higher Clinical Dementia Rating scores than normal controls and future AD patients. In the future AD group, there was an average of 2.8 years (standard deviation 1.36; range: 1.0—5.46 years) of follow-up time between MRI and the diagnosis of MCI/AD. Normal controls were followed up for an average of 6.5 years (standard deviation 4.4; range 1.3—21.4 years) after scanning to confirm that they remained normal.
Table 1.
Demographic and clinical characteristics of the participants
| Controls | Future AD | Current MCI/AD | |
|---|---|---|---|
| Agea | 64.4 ± 7.4b | 76.1 ± 7.7 | 76.1 ± 7.7 |
| Educationa | 17 ± 2.1 | 14.9 ± 3.1 | 15.9 ± 3.0 |
| Sex (% female) | 67.4 | 72.2 | 57.5 |
| APOE4 allele present | 24/89; 27% | 2/13; 11.1% | 18/40; 45% |
| MMSEa | 29.4 ± 0.9 | 29.4 ± 1.3 | 20.6 ± 7.5b |
| CDRa | 0.07 ± 0.17 | 0.00 ± 0.0 | 1.3 ± 1.0b |
Values are mean ± standard deviation.
Statistically significant difference from other 2 groups (p < .05).
3.2. Interrater reliability
A high degree of reliability was found between the 3 tracers. The average measure intraclass correlation (ICC) was 0.758 (p = 0.003).
3.3. Septal volume
Septal volume differed significantly by subject group (F [2, 141] = 7.7; p = 0.001.) Average septal volume (and standard deviation) for controls was 224.4 (74.4) mm3, for future AD was 245.5 (74.1) mm3, and for current MCI/AD was 166.2 (69.7) mm3. Pairwise comparisons indicated that all groups differed significantly from each other with future AD > controls > current MCI/AD. Results were similar when also controlling for the ventricular width. Septal tracings in a control, a future AD patient, and a current MCI/AD patient are shown in Fig. 1.
Fig. 1.
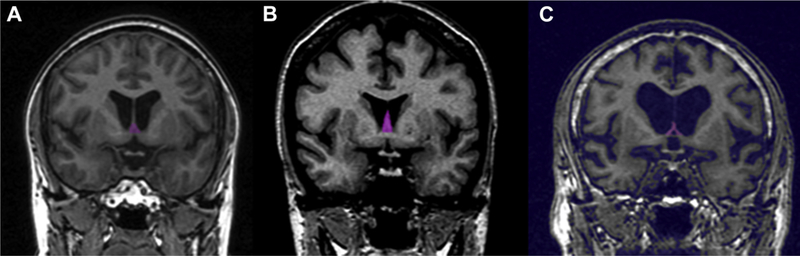
Examples of segmented septal nuclei (pink shading) on coronal T1 MRI at the level of the anterior commissure in (A) a normal control, (B) a subject destined to develop AD in the future but clinically normal at the time of scanning, and (C) a patient with current MCI/AD. Note larger septal region in the future AD subject and virtually no septal gray matter in the current MCI/AD patient. Abbreviations: AD, Alzheimer’s disease; MCI, mild cognitive impairment; MRI, magnetic resonance imaging. (For interpretation of the references to color in this figure legend, the reader is referred to the Web version of this article.)
3.4. Ventricular width
Ventricular width—a rough estimate of brain atrophy—was, as expected, significantly greater in patients with current MCI/AD as compared to normal controls and future AD patients (F [2,137) = 8.0; p = 0.001). Ventricular width did not differ between controls and future AD patients. Average ventricular width for controls was 20.5 (6.2) mm, for future AD was 24.2 (5.4) mm, and for current MCI/AD was 29.4 (7.6) mm.
4. Discussion
Results indicate septal enlargement in healthy controls destined to develop AD in an average of 2.8 years. We are unaware of prior studies demonstrating enlargement of a gray matter structure in individuals at risk of AD. These results contrast markedly with what is known about hippocampal volume: multiple studies have shown that hippocampal volume declines during the transition from normal to MCI to AD, reflecting a gradual neurodegenerative process (De Leon et al., 1989). Our results indicate that something other than neurodegeneration is taking place in the septal region. We postulate that MRl-detectable septal enlargement before cognitive decline reflects a neuroplastic compensatory process involving cholinergic septal neurons. This explanation fits with autopsy studies showing preserved septal cholinergic cell bodies (Mufson et al., 1989; Vogels et al., 1990) with increased cholinergic innervation of the hippocampus in early AD (DeKosky et al., 2002; Geddes et al., 1985; Hyman et al., 1987). Our unique finding of enlargement of a gray matter structure before cognitive decline may relate to the unique propensity of BF cholinergic neurons to express receptors for nerve growth factor throughout life (Chao and Hempstead, 1995) and to enlarge via a nerve growth factor—mediated process in response to various hippocampal pathologies (Conner et al., 2009; Hagg et al., 1989; Higgins et al., 1989; Pearson et al., 1984, 1987; Stroessner-Johnson et al., 1992). Other potential explanations for septal enlargement include deposition of amyloid in the septal region, which occurs early in AD (Arendt et al., 1988), inflammation (Schliebs, 2005), or neuronal enlargement due to cell cycle dysregulation with polyploidy and failed replication (Atwood and Bowen, 2015).
This study has several limitations: manual tracing is a labor intensive process that requires significant training and may not be suitable for large-scale studies. Our suboptimal interrater reliability (ICC = 0.758) and the fact that results from 1 of our 5 tracers had to be discarded reflect this challenge. Tracing the septum in AD patients was especially challenging because the septal region was in many cases so atrophied as to be untrace- able (see Fig. 1.). Despite the limitations of our manual tracing protocol, we believe it is the only currently available method for assessing the septal region in older and AD subjects because we have found that automated measurement of the septal region using SPM, which is accurate in younger subjects (Butler et al., 2014), is highly inaccurate in subjects with significantly enlarged ventricles; these results are presented as supplementary information. Supplementary information also describes automated results showing reduced NBM and hippocampal and enlarged ventricular volume in MCI/AD patients as compared to controls, as expected based on multiple prior studies (e.g., De Leon et al., 1989; Kilimann et al., 2014); it is only automated measurement of the septal region that is inaccurate, likely because of this region’s small volume and close proximity to the ventricles. We hope that current findings will spur further work to optimize the measurement (automated and manual) of this understudied region.
In conclusion, we have demonstrated septal enlargement before development of AD. Future studies are needed to determine the nature of this enlargement and whether it can serve as an early biomarker predicting cognitive decline.
Supplementary Material
Acknowledgements
This study was supported by the following NIH grants: AG12101, AG022374, AG08051, and NS057579.
Footnotes
Disclosure statement
The authors have no actual or potential conflicts of interest.
Appendix A. Supplementary data
Supplementary data associated with this article can be found, in the online version, at https://doi.org/10.1016/j.neurobiolaging.2018.01.014.
References
- Albert MS, DeKosky ST, Dickson D, Dubois B, Feldman HH, Fox NC, Gamst A, Holtzman DM, Jagust WJ, Petersen RC, 2011. The diagnosis of mild cognitive impairment due to Alzheimer’s disease: recommendations from the National Institute on Aging-Alzheimer’s Association workgroups on diagnostic guidelines for Alzheimer’s disease. Alzheimer’s Dement. 7, 270—279. [DOI] [PMC free article] [PubMed] [Google Scholar]
- Alexander MP, Freedman M, 1984. Amnesia after anterior communicating artery aneurysm rupture. Neurology 34, 752. [DOI] [PubMed] [Google Scholar]
- Andy OJ, Stephan H, 1968. The septum in the human brain. J. Comp. Neurol. 133, 383—410. [DOI] [PubMed] [Google Scholar]
- Arendt T, Taubert G, Bigl V, Arendt A, 1988. Amyloid deposition in the nucleus basalis of Meynert complex: a topographic marker for degenerating cell clusters in Alzheimer’s disease. Acta Neuropathol. 75, 226—232. [DOI] [PubMed] [Google Scholar]
- Atwood CS, Bowen RL, 2015. A unified hypothesis of early-and late-onset Alzheimer’s disease pathogenesis. J. Alzheimers Dis. 47, 33—47. [DOI] [PMC free article] [PubMed] [Google Scholar]
- Baxter MG, Bucci DJ, Gorman LK, Wiley RG, Gallagher M, 2013. Selective immunotoxic lesions of basal forebrain cholinergic cells: effects on learning and memory in rats. Behav. Neurosci. 127, 619—627. [DOI] [PubMed] [Google Scholar]
- Butler T, Blackmon K, Zaborszky L, Wang X, DuBois J, Carlson C, Barr WB, French J, Devinsky O, Kuzniecky R, Halgren E, Thesen T, 2012. Volume of the human septal forebrain region is a predictor of source memory accuracy. J. Int. Neuropsychol. Soc. 18, 157—161. [DOI] [PMC free article] [PubMed] [Google Scholar]
- Butler T, Zaborszky L, Pirraglia E, Li J, Wang XH, Li Y, Tsui W, Talos D, Devinsky O, Kuchna I, Nowicki K, French J, Kuzniecky R, Wegiel J, Glodzik L, Rusinek H, deLeon MJ, Thesen T, 2014. Comparison of human septal nuclei MRI measurements using automated segmentation and a new manual protocol based on histology. Neuroimage 97C, 245—251. [DOI] [PMC free article] [PubMed] [Google Scholar]
- Butler T, Zaborszky L, Wang X, McDonald CR, Blackmon K, Quinn BT, DuBois J, Carlson C, Barr WB, French J, Kuzniecky R, Halgren E, Devinsky O, Thesen T, 2013. Septal nuclei enlargement in human temporal lobe epilepsy without mesial temporal sclerosis. Neurology 80, 487—491. [DOI] [PMC free article] [PubMed] [Google Scholar]
- Buzsaki G, 2002. Theta oscillations in the hippocampus. Neuron 33, 325—340. [DOI] [PubMed] [Google Scholar]
- Chao MV, Hempstead BL, 1995. p75 and Trk: a two-receptor system. Trends Neurosci. 18, 321—326. [PubMed] [Google Scholar]
- Conner JM, Franks KM, Titterness AK, Russell K, Merrill DA, Christie BR, Sejnowski TJ, Tuszynski MH, 2009. NGF is essential for hippocampal plasticity and learning. J. Neurosci. 29, 10883—10889. [DOI] [PMC free article] [PubMed] [Google Scholar]
- De Leon M, George A, Stylopoulos L, Smith G, Miller D, 1989. Early marker for Alzheimer’s disease: the atrophic hippocampus. Lancet 334, 672—673. [DOI] [PubMed] [Google Scholar]
- DeKosky ST, Ikonomovic MD, Styren SD, Beckett L, Wisniewski S, Bennett DA, Cochran EJ, Kordower JH, Mufson EJ, 2002. Upregulation of choline acetyltransferase activity in hippocampus and frontal cortex of elderly subjects with mild cognitive impairment. Ann. Neurol. 51, 145—155. [DOI] [PubMed] [Google Scholar]
- Fischl B, Salat DH, Busa E, Albert M, Dieterich M, Haselgrove C, van der Kouwe A, Killiany R, Kennedy D, Klaveness S, Montillo A, Makris N, Rosen B, Dale AM, 2002. Whole brain segmentation: automated labeling of neuroanatomical structures in the human brain. Neuron 33, 341 —355. [DOI] [PubMed] [Google Scholar]
- Folstein MF, Folstein SE, McHugh PR, 1975. “Mini-mental state”: a practical method for grading the cognitive state of patients for the clinician. J. Psychiatr. Res. 12,189—198. [DOI] [PubMed] [Google Scholar]
- Fujii T, Okuda J, Tsukiura T, Ohtake H, Miura R, Fukatsu R, Suzuki K, Kawashima R, Itoh M, Fukuda H, 2002. The role of the basal forebrain in episodic memory retrieval: a positron emission tomography study. Neuroimage 15, 501—508. [DOI] [PubMed] [Google Scholar]
- Geddes JW, Monaghan DT, Cotman CW, Lott IT, Kim RC, Chui HC, 1985. Plasticity of hippocampal circuitry in Alzheimer’s disease. Science 230, 1179. [DOI] [PubMed] [Google Scholar]
- Grothe M, Heinsen H, Teipel SJ, 2012. Atrophy of the cholinergic basal forebrain over the adult age range and in early stages of Alzheimer’s disease. Biol. Psychiatry 71, 805—813. [DOI] [PMC free article] [PubMed] [Google Scholar]
- Gu Z, Yakel J, 2011. Timing-dependent septal cholinergic induction of dynamic hippocampal synaptic plasticity. Neuron 71, 155—165. [DOI] [PMC free article] [PubMed] [Google Scholar]
- Hagg T, Fass-Holmes B, Vahlsing HL, Manthorpe M, Conner JM, Varon S, 1989. Nerve growth factor (NGF) reverses axotomy-induced decreases in choline acetyltransferase, NGF receptor and size of medial septum cholinergic neurons. Brain Res. 505, 29—38. [DOI] [PubMed] [Google Scholar]
- Hangya B, Borhegyi Z, Szilagyi N, Freund T, Varga V, 2009. GABAergic neurons of the medial septum lead the hippocampal network during theta activity. J. Neurosci. 29, 8094—8102. [DOI] [PMC free article] [PubMed] [Google Scholar]
- Higgins GA, Koh S, Chen KS, Gage FH, 1989. NGF induction of NGF receptor gene expression and cholinergic neuronal hypertrophy within the basal forebrain of the adult rat. Neuron 3, 247—256. [DOI] [PubMed] [Google Scholar]
- Huerta PT, Lisman JE, 1993. Heightened synaptic plasticity of hippocampal CA1 neurons during a cholinergically induced rhythmic state. Nature 364, 723—725. [DOI] [PubMed] [Google Scholar]
- Hyman BT, Kromer LJ, van Hoesen GW, 1987. Reinnervation of the hippocampal perforant pathway zone in Alzheimer’s disease. Ann. Neurol. 21, 259—267. [DOI] [PubMed] [Google Scholar]
- Kerbler GM, Fripp J, Rowe CC, Villemagne VL, Salvado O, Rose S, Coulson EJ Initiative, A.s.D.N., 2015. Basal forebrain atrophy correlates with amyloid b burden in Alzheimer’s disease. Neuroimage Clin. 7, 105—113. [DOI] [PMC free article] [PubMed] [Google Scholar]
- Kilimann I, Grothe M, Heinsen H, Alho EJL, Grinberg L, Amaro E Jr., dos Santos GAB, da Silva RE, Mitchell AJ, Frisoni GB, 2014. Subregional basal forebrain atrophy in Alzheimer’s disease: a multicenter study. J. Alzheimers Dis. 40, 687—700. [DOI] [PMC free article] [PubMed] [Google Scholar]
- Mai J, Assheuer J, Paxinos G, 2004. Atlas of the Human Brain. Elsevier Academic Press, Boston. [Google Scholar]
- McKhann GM, Knopman DS, Chertkow H, Hyman BT, Jack CR, Kawas CH, Klunk WE, Koroshetz WJ, Manly JJ, Mayeux R, 2011. The diagnosis of dementia due to Alzheimer’s disease: Recommendations from the National Institute on Aging-Alzheimer’s Association workgroups on diagnostic guidelines for Alzheimer’s disease. Alzheimer’s Demen. 7, 263—269. [DOI] [PMC free article] [PubMed] [Google Scholar]
- Mikheev A, Nevsky G, Govindan S, Grossman R, Rusinek H, 2008. Fully automatic segmentation of the brain from T1-weighted MRI using Bridge Burner algorithm. J. Magn. Reson. Imaging 27, 1235—1241. [DOI] [PMC free article] [PubMed] [Google Scholar]
- Morris JC, 1993. The Clinical Dementia Rating (CDR): current version and scoring rules. Neurology 43, 2412—2414. [DOI] [PubMed] [Google Scholar]
- Mufson EJ, Bothwell M, Kordower JH, 1989. Loss of nerve growth factor receptor-containing neurons in Alzheimer’s disease: a quantitative analysis across subregions of the basal forebrain. Exp. Neurol. 105, 221—232. [DOI] [PubMed] [Google Scholar]
- Pearson RCA, Sofroniew MV, Powell TPS, 1984. Hypertrophy of immunohis- tochemically identified cholinergic neurons of the basal nucleus of Meynert following ablation of the contralateral cortex in the rat. Brain Res. 311, 194—198. [DOI] [PubMed] [Google Scholar]
- Pearson RCA, Sofroniew MV, Powell TPS, 1987. The cholinergic nuclei of the basal forebrain of the rat: hypertrophy following contralateral cortical damage or section of the corpus callosum. Brain Res. 411, 332—340. [DOI] [PubMed] [Google Scholar]
- Schliebs R, 2005. Basal forebrain cholinergic dysfunction in Alzheimer’s disease—interrelationship with b-amyloid, inflammation and neurotrophin signaling. Neurochem. Res. 30, 895—908. [DOI] [PubMed] [Google Scholar]
- Stewart M, Fox SE, 1990. Do septal neurons pace the hippocampal theta rhythm? Trends Neurosci. 13,163—169. [DOI] [PubMed] [Google Scholar]
- Stroessner-Johnson H, Rapp P, Amaral D, 1992. Cholinergic cell loss and hypertrophy in the medial septal nucleus of the behaviorally characterized aged rhesus monkey. J. Neurosci. 12,1936—1944. [DOI] [PMC free article] [PubMed] [Google Scholar]
- Teipel SJ, Flatz WH, Heinsen H, Bokde AL, Schoenberg SO, Stöckel S, Dietrich O, Reiser MF, Möller H-J, Hampel H, 2005. Measurement of basal forebrain atrophy in Alzheimer’s disease using MRI. Brain 128, 2626—2644. [DOI] [PubMed] [Google Scholar]
- Tzourio-Mazoyer N, Landeau B, Papathanassiou D, Crivello F, Etard O, Delcroix N, Mazoyer B, Joliot M, 2002. Automated anatomical labeling of activations in SPM using a macroscopic anatomical parcellation of the MNI MR! single-subject brain. Neuroimage 15, 273—289. [DOI] [PubMed] [Google Scholar]
- Vogels O, Broere C, Ter Laak H, Ten Donkelaar H, Nieuwenhuys R, Schulte B, 1990. Cell loss and shrinkage in the nucleus basalis Meynert complex in Alzheimer’s disease. Neurobiol. Aging 11, 3—13. [DOI] [PubMed] [Google Scholar]
- Whitehouse PJ, Price DL, Clark AW, Coyle JT, DeLong MR, 1981. Alzheimer disease: evidence for selective loss of cholinergic neurons in the nucleus basalis. Ann. Neurol. 10, 122—126. [DOI] [PubMed] [Google Scholar]
- Winson J, 1978. Loss ofhippocampal theta rhythm results in spatial memory deficit in the rat. Science 201, 160—163. [DOI] [PubMed] [Google Scholar]
Associated Data
This section collects any data citations, data availability statements, or supplementary materials included in this article.