Abstract
Acute kidney injury (AKI) is a devastating clinical condition affecting at least two-thirds of critically ill patients, and, among these patients, it is associated with a greater than 60% risk of mortality. Kidney mononuclear phagocytes (MPs) are implicated in pathogenesis and healing in mouse models of AKI and, thus, have been the subject of investigation as potential targets for clinical intervention. We have determined that, after injury, F4/80hi-expressing kidney-resident macrophages (KRMs) are a distinct cellular subpopulation that does not differentiate from nonresident infiltrating MPs. However, if KRMs are depleted using polyinosinic/polycytidylic acid (poly I:C), they can be reconstituted from bone marrow–derived precursors. Further, KRMs lack major histocompatibility complex class II (MHCII) expression before P7 but upregulate it over the next 14 days. This MHCII– KRM phenotype reappears after injury. RNA sequencing shows that injury causes transcriptional reprogramming of KRMs such that they more closely resemble that found at P7. KRMs after injury are also enriched in Wingless-type MMTV integration site family (Wnt) signaling, indicating that a pathway vital for mouse and human kidney development is active. These data indicate that mechanisms involved in kidney development may be functioning after injury in KRMs.
Keywords: Immunology, Nephrology
Keywords: Innate immunity, MHC class 2, Macrophages
Acute kidney injury–responsive tissue-resident macrophages downregulate MHC class II, returning to a phenotype and transcriptional profile present in these cells during organ development.
Introduction
Severe acute kidney injury (AKI) is a life-threatening clinical condition that confers increased risk of chronic kidney disease, end-stage renal disease, and mortality (1–12). In AKI, the loss of kidney function is associated, in many cases, with inflammatory cell infiltration in the kidney interstitium (13–22). Normal kidney architecture can be lost, leading to (a) interstitial fibrosis and scarring mediated by macrophages, myofibroblasts, and increased pericyte-endothelium distance; (b) progressive decline in secretory and excretory function; and (c) an inability to regenerate functional kidney tissue (23–31).
The mononuclear phagocyte (MP) system is a family of cells consisting of bone marrow progenitors, monocytes, macrophages, and DCs (32). They are present throughout the kidney tissue (15, 16, 33–35) and are derived from multiple sources (36, 37). F4/80hi-expressing MP cells are derived from the yolk sac and fetal liver during embryonic life (36). These cells are kidney-resident macrophages (KRMs) that can transport material into the interstitium across the endothelium in uninjured kidneys (37). In animal models of AKI, neutrophils and MPs from the peripheral circulation infiltrate into the kidney in large numbers within 24 hours (13, 15, 16). However, the enduring sources of renewal for F4/80hi KRMs and F4/80lo-infiltrative MPs after AKI remain unknown.
Two potential sources of KRMs and other renal MPs are bone marrow hematopoiesis-derived MPs or in situ renewal independent of bone marrow hematopoiesis (36). Upon transmigration into tissues from the blood, bone marrow–derived monocytes differentiate into macrophages or DCs (38, 39). Due to remarkable plasticity, bone marrow–derived MPs have the ability to differentiate into renal myofibroblasts, although this represents a small proportion of myofibroblast precursors (40).
Previous studies of the role of MPs in the pathogenesis and resolution of AKI were not designed to clearly define the ontogeny of these cells, nor did they explicitly correlate immune cell lineage, embryonic versus adult bone marrow hematopoiesis, with differing gene expression (13, 16, 34, 41). In addition, supporting the importance of MPs in the pathogenesis of AKI, nonspecific depletion of infiltrative MPs and resident macrophages reduced survival after AKI (13). In the heart, tissue-resident macrophages are known to participate in injury response and support normal physiology (42–44). Resident macrophages are present during early kidney development, suggesting their role in the process (36, 45). Therefore, the purpose of this study was to (a) test the hypothesis that a subset of KRMs harness a developmental transcriptional profile during healing and (b) to define a lineage-specific subset that may be targeted in therapeutic strategies in the future.
Results
F4/80hi kidney macrophages are minimally replaced by precursors from the blood after ischemia/reperfusion AKI.
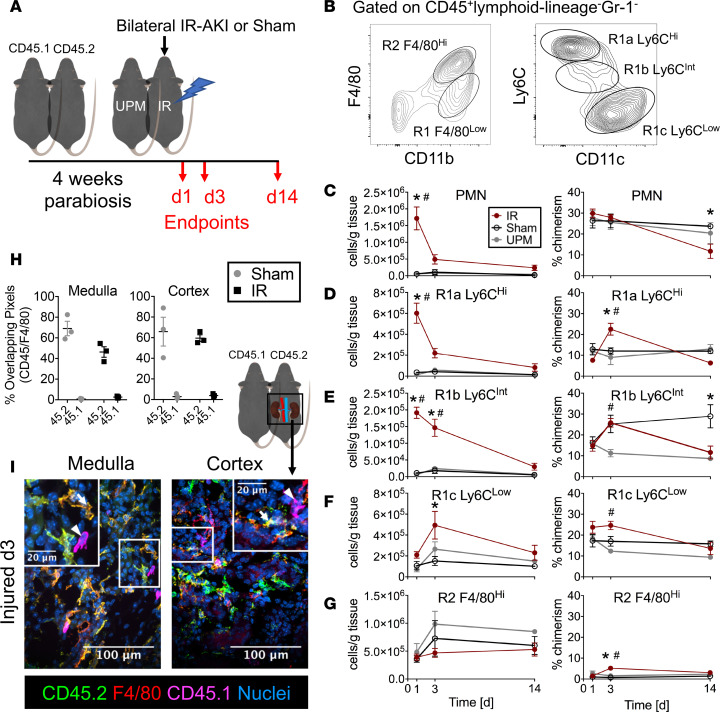
We established a model of ischemia/reperfusion-induced (IR-induced) AKI (IR-AKI) in parabiotic mice (Figure 1A) in order to test whether KRMs (R2 F4/80hi: CD45+ lymphoid lineage–Gr-1–F4/80hiCD11bloCX3CR1+CD64+MerTK+; Figure 1B and Supplemental Figure 1, A and B; supplemental material available online with this article; https://doi.org/10.1172/jci.insight.125503DS1) can result from differentiation of infiltrative MPs (R1 F4/80lo: CD45+ lymphoid lineage–Gr-1–CD11bhiF4/80loCX3CR1+/–CD64–MerTK–; Figure 1B and Supplemental Figure 1, A and B) in the kidney after AKI. Four weeks after establishment of parabiosis between CD45.2 C57BL/6J and CD45.1 congenic C57BL/6J mice, one pair member was subjected to 30 minutes of bilateral renal IR. Serum creatinine levels were significantly increased in the injured pair members at 1 and 3 days after injury, while uninjured pair members showed no significant increases in serum creatinine (Supplemental Figure 2, A and B). As expected, serum creatinine levels in sham controls were unchanged relative to baseline (Supplemental Figure 2, C and D). Histologic sections stained with periodic acid–Schiff hematoxylin demonstrated classic signs of AKI in injured mice 1 and 3 days after injury, including necrotic tubules, casts, and loss of brush border, whereas uninjured pair members and sham kidneys appeared normal with intact proximal tubules (Supplemental Figure 2, E and F). The acute inflammatory infiltrate was dominated by neutrophils (CD45+ lymphoid lineage–Gr-1hiCD11b+F4/80–MHCII–) and Ly6C-expressing infiltrative MPs (R1a, R1b, R1c), with significant increases in proportions of leukocytes and absolute numbers normalized to tissue mass (Figure 1, B–F) at day 1 with a near-complete return to sham levels at day 3. In injured mice, KRM (R2 F4/80hi, Figure 1B) absolute numbers remained constant until day 14 (Figure 1G). In order to determine the extent to which infiltrative MP differentiates into F4/80hi KRMs after IR-AKI, we measured the presence of chimeric, blood-borne leukocytes among the R2 population at 1, 3, and 14 days after injury. Even after extensive MP infiltration (relative increase in absolute numbers of infiltrative MPs, IR minus sham: R1a 5.6 × 10⁵ ± 0.8 × 10⁵, R1b 1.8 × 10⁵ ± 0.2 × 10⁵ cells/g tissue at day 1), the percentage of chimerism among R2 cells after IR increased to 5.2% ± 1.2% compared with 0.7% ± 0.4% in sham controls (P < 0.05) after 3 days and returned to sham levels 14 days after injury (Figure 1G). In contrast, the percentage of chimerism of R1a MPs significantly increased to 22.6% ± 2.8% compared with that of sham controls, at 12.1% ± 1.5% (P < 0.05), 3 days after injury (Figure 1D).
Figure 1. F4/80hi kidney macrophages are minimally replaced by precursors from the blood after IR-AKI.
(A) Schematic representation of AKI in parabiosis model. One animal in a pair of CD45 congenic parabiotic chimeras underwent bilateral ischemia/reperfusion AKI (IR-AKI), and tissues were studied at 1, 3, and 14 days after injury. IR, injured; UPM, uninjured pair member. (B) Gating strategy and naming convention for kidney mononuclear phagocytes (MPs), including R2 kidney-resident macrophages (KRMs) and R1-infiltrative MPs. (C–G) Total absolute numbers (cells/g tissue) and percentage of chimerism for kidney (C) neutrophils (PMN), (D) R1a Ly6Chi, (E) R1b Ly6CInt, (F) R1c Ly6Clo, and (G) R2 F4/80hi MPs after IR-AKI at days 1, 3, and 14. Mean ± SEM, n = 4–7 (≥4 pairs), 2-way ANOVA with Tukey’s post-test, *P < 0.05 for IR vs. Sham, #P < 0.05 for IR vs. UPM. (H) Mander’s overlap coefficients (percentage overlapping pixels) were plotted for CD45 allotypes overlapping with F4/80+ pixels. (I) Representative colocalization of CD45 allotypes with F4/80+ kidney MPs by confocal microscopy of transverse sections from injured kidneys in the medullae and cortices. Macrophages expressing CD45.2 (arrow) or CD45.1 (arrowheads) are indicated. Scale bar: 100 μm; 20 μm (insets). Representative of 3 biologic replicates per treatment group from 2 independent experiments.
In order to validate flow cytometry measurements of chimerism and localize F4/80-expressing cells, we performed confocal microscopy of AKI in parabiosis kidneys 3 days after injury. Colocalization analysis, measuring the percentage of overlapping pixels for CD45 allotypes against total F4/80+ pixels, indicated that F4/80 protein colocalized with the native CD45 allotype (CD45.2, yellow cells, Figure 1, H and I) with greater frequency than the chimeric, infiltrative allotype (CD45.1, magenta cells, Figure 1, H and I). We observed CD45.1-expressing infiltrative cells with macrophage morphology in both the medullae and cortices of the kidneys of injured CD45.2 mice, indicating infiltrative MPs were present and available to differentiate (Figure 1I and Supplemental Figure 2G). These data together support the hypothesis that F4/80hi KRMs remain independent from and do not extensively differentiate from infiltrative MPs, even in the context of IR-AKI.
Fcgr4hiFcgr1+ kidney MPs are F4/80hi KRMs, and these cells upregulate MerTK, Fcgr1, and Fcgr2/3 in response to AKI.
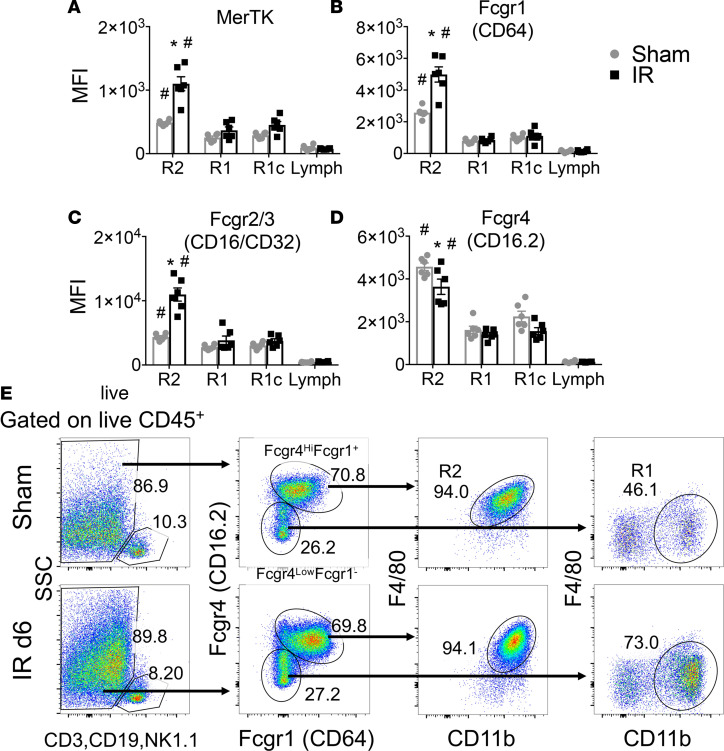
There is a need for specific surface markers for kidney MP, distinguishing KRMs from infiltrative MPs, that are evolutionarily conserved from mouse to human. Previous work by Stamatiades et al. illustrated a functional role for Fcgr4 expression by KRMs in monitoring transendothelial transport of immune complexes (37). Fc γ receptor (Fcgr) expression by kidney leukocytes is intriguing due to the prevalence of inflammatory kidney diseases involving immune complex deposition, including autoimmune and drug-induced interstitial nephritis. We studied dynamic Fcgr and mer tyrosine kinase (MerTK) expression by flow cytometry, in the context of IR-AKI, as potential novel surface markers for KRMs and infiltrative MPs. In sham controls, R2 KRMs demonstrated significantly higher expression of MerTK, Fcgr1, Fcgr2/3, and Fcgr4 compared with R1- and R1c-infiltrative MPs and lymphoid lineage cells, indicating these may serve as steady-state markers for KRMs (Figure 2, A–D). However, expression for these surface proteins was observed in infiltrative MPs, albeit at lower levels (Figure 2, A–D). Interestingly, MerTK, Fcgr1, and Fcgr2/3 expression was specifically induced in R2 KRMs secondary to IR-AKI (Figure 2, A–C), while Fcgr4 expression decreased in KRMs in response to injury but remained increased relative to R1 and R1c cells (Figure 2D). Using this information, we devised a phenotyping strategy for identifying R2 KRMs and R1-infiltrative MPs. Live CD45+ lymphoid lineage– cells were studied for expression of Fcgr4 and Fcgr1 (Figure 2E). We found that Fcgr4hiFcgr1+ MPs resolved from other cell populations and that this phenotype corresponded with R2 F4/80hi KRMs. The Fcgr4loCD64– gate contained a mixture of cell types, including R1-infiltrative MPs (Figure 2E).
Figure 2. Fcgr4hiFcgr1+ kidney MPs are F4/80hi KRMs, and these cells upregulate MerTK, Fcgr1, and Fcgr2/3 in response to AKI.
(A–D) Kidney mononuclear phagocyte (MP) flow cytometry measurements of mean fluorescence intensity (MFI) for R2 F4/80hi kidney-resident macrophages (KRMs), R1-infiltrative MPs, R1c Ly6Clo infiltrative MPs, and lymphoid lineage cells (CD3, CD19, NK1.1). Mean ± SEM, n = 6 per group from 2 independent experiments, 2-way ANOVA, *P < 0.05 for IR vs. Sham (Sidak’s post-test), #P < 0.05 for R2 vs. R1, R1c, and lymph (Tukey’s post-test). (A) MerTK, (B) Fcgr1 (CD64), (C) Fcgr2/3 (CD16/CD32), (D) Fcgr4 (CD16.2). (E) Representative 2-parameter flow histograms of a gating strategy for R2 KRMs and R1-infiltrative MPs that depends on Fcgr4 and Fcgr1. Values are percentage gated. Representative of n = 6 per group from 2 independent experiments. Lymph, lymphoid lineage cells (CD3, CD19, NK1.1); MerTK, Mer tyrosine kinase; Fcgr, Fc γ receptor.
Kidney F4/80lo MPs are derived from the peripheral circulation and turn over within 14 days.
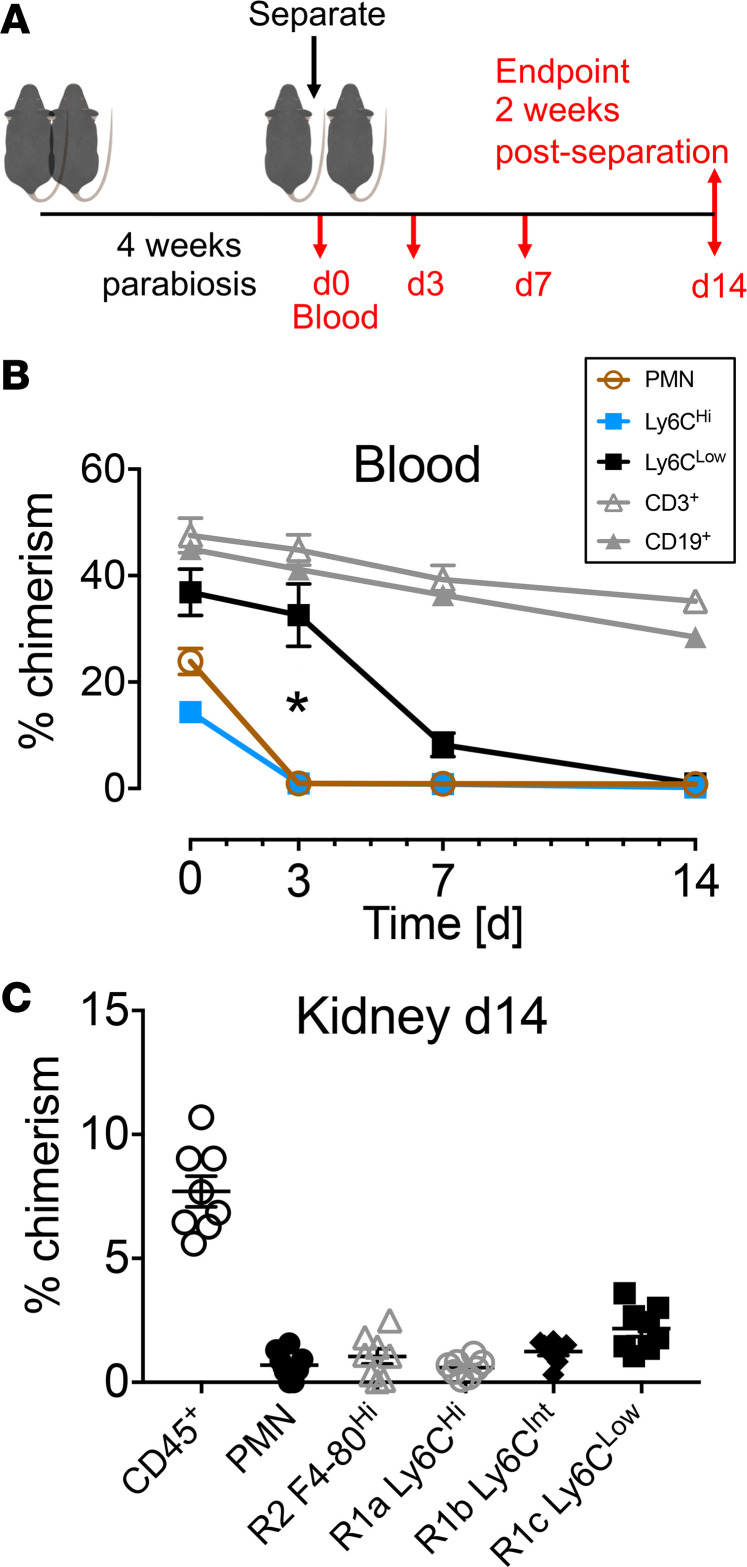
F4/80lo R1 MPs arise from the bone marrow in a Myb-dependent manner (36). In order to establish the time required for turn over of F4/80lo cells, we separated the CD45 congenic parabiotic mice, eliminating the source of renewal of chimeric cells, and measured the disappearance of chimeric leukocytes (Figure 3A). CD11b+Ly6Chi lymphoid lineage– blood monocytes declined significantly more rapidly after pair separation than CD11b+Ly6Clo lymphoid lineage– monocytes in the peripheral blood (Figure 3B). Lymphocytes, in contrast, containing populations of long-lived memory cells, did not turn over within 14 days of separation (Figure 3B). By 14 days after separation, the percentage of chimerism for R1a and R1c intrarenal MPs was 0.59% ± 0.12% and 2.16% ± 0.31%, respectively, indicating near-complete turnover, even for major histocompatibility complex class II–expressing (MHCII-expressing) and CD11c-expressing R1c MPs (Figure 3C and Supplemental Figure 3). The percentage of chimerism of R2 KRMs was 1.05% ± 0.31% (Figure 3C). These data together indicate R1 F4/80lo intrarenal MPs rapidly turn over, and, in healthy uninjured adult mice, R1 MPs do not appear to differentiate into R2 KRMs.
Figure 3. Kidney F4/80lo mononuclear phagocytes are derived from the peripheral circulation and turn over within 14 days.
(A) Schematic representation of parabiosis separation experiment of steady-state parabiotic chimeras. 10-week-old CD45 congenic mice (CD45.1 and CD45.2) were parabiotically attached for 4 weeks. The pairs were separated and blood was drawn at the time of separation and then 3, 7, and 14 days after separation. On day 14, kidneys were harvested and immune cell chimerism was studied. (B) The percentage of chimerism in peripheral blood of parabiotic chimeras at time points after separation. Mean ± SEM, n = 8 (4 pairs). Statistical comparison: day 3 Ly6Chi vs. Ly6Clo, 2-way ANOVA with Tukey’s post-test, *P < 0.05. (C) The percentage of chimerism for kidney CD45+ leukocytes, intrarenal neutrophils (PMN), and kidney MPs 14 days after separation. Mean ± SEM.
KRMs are replaced by bone marrow–derived precursors after the niche is opened.
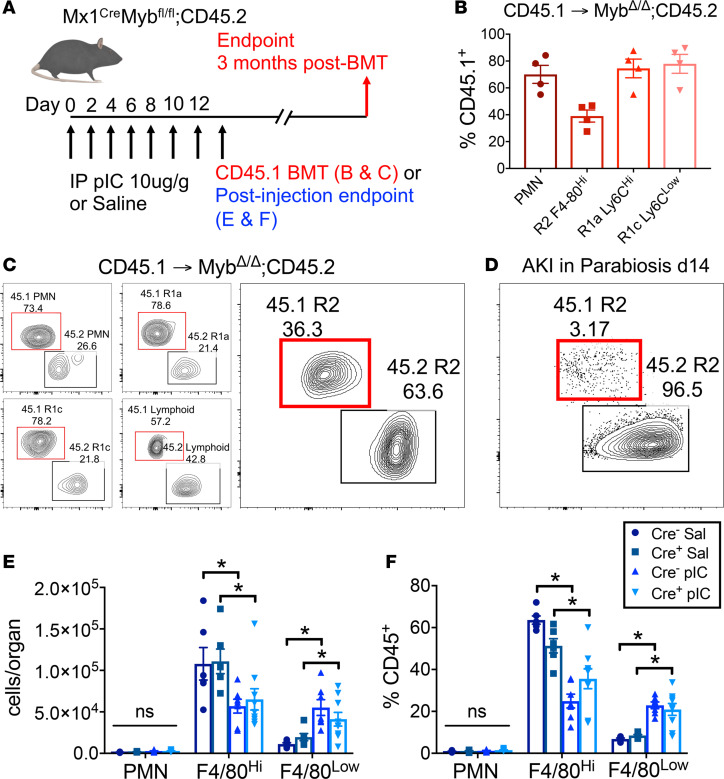
Given that R2 KRMs are not replaced by precursors from the blood in the setting of steady state and are only minimally replaced after IR-AKI, we endeavored to determine why half of these cells were previously shown to be dependent on Myb, a transcription factor required for normal hematopoiesis, in the landmark study by Schulz et al., because the parabiosis data were not consistent with this result (36). In order to validate that R2 KRMs can be dependent on Myb, and consequently bone marrow hematopoiesis, we repeated the experiment performed in the Schulz et al. study (Figure 4A). Reproducing their findings, in Mx1Cre+Mybfl/fl mice treated with polyinosinic/polycytidylic acid (poly I:C) and transplanted with CD45.1 congenic bone marrow, R2 KRMs demonstrated 39.0% ± 4.5% chimerism 3 months after transplant (Figure 4, B and C). This was in contrast to R2 KRM chimerism observed in AKI in parabiotic mice 14 days after injury (Figure 4D versus Figure 4C). In transplanted mice, successful bone marrow engraftment, although incomplete, was confirmed by predominant bone marrow chimerism for PMN, R1 F4/80lo MP, and lymphoid lineage cells (Figure 4, B and C). Treating Mx1Cre+Mybfl/fl mice with poly I:C, upon completion of injections (day 12), resulted in a 2-fold reduction in proportions and absolute numbers of the R2 KRM population (Figure 4, E and F). However, we found the same KRM depletion in Cre– and wild-type C57BL/6J mice treated with poly I:C and no depletion in saline-treated controls, indicating that treatment with poly I:C was the cause of the KRM reduction (Figure 4, E and F, and Supplemental Figure 4A). In concert with reductions in R2 KRMs, decreases in B cells were observed (Supplemental Figure 4B). In contrast, increases in R1 MPs (Figure 4, E and F) and NK cells (Supplemental Figure 4B) were observed secondary to poly I:C treatment. Intrarenal inflammatory cell changes indicated a nonspecific infiltrative response occurring inside the kidney secondary to systemic administration of poly I:C. Hence, bone marrow hematopoiesis can repopulate R2 KRMs, but only after the cellular niche has been opened, as occurs in the kidney with poly I:C treatment.
Figure 4. Kidney-resident macrophages are replaced by bone marrow–derived precursors only after the niche is opened.
(A) Schematic of Cre induction and Myb gene deletion in Mx1CreMybfl/fl mice, either followed by CD45.1 congenic bone marrow transplant (BMT), further followed by a 3-month period before endpoint analysis (B and C), or by tissue harvest to study effects of poly I:C (pIC) on kidney MPs (E and F). (B) Percentage of chimerism (%CD45.1+) of kidney PMNs and MPs 3 months following BMT. Mean ± SEM. (C) Representative contour flow cytometry plots of chimerism 3 months after BMT for PMN, R1a, R1c, and lymphoid lineage cells (CD3, CD19, NK1.1), and R2. The red gate encloses chimeric bone marrow–derived cells. The black gate encloses host-derived, nonchimeric cells. Values are percent gated. Representative of n = 4. (D) Representative contour flow cytometry plot of chimerism for R2 from AKI in parabiosis kidney 14 days after injury. The red gate encloses chimeric blood-borne cells. The black gate encloses host-derived, nonchimeric cells. Values are percentage gated. Representative of n = 7; 3 independent experiments. (E and F) Proportions and absolute numbers, normalized to whole organ preparations, of neutrophils (PMN) and R2 or R1 kidney MPs following either saline vehicle (Sal) or pIC in Cre+ or Cre– mice. Mean ± SEM, 2-way ANOVA with Tukey’s post-test, *P < 0.05.
KRMs demonstrate a developmental switch for MHCII expression.
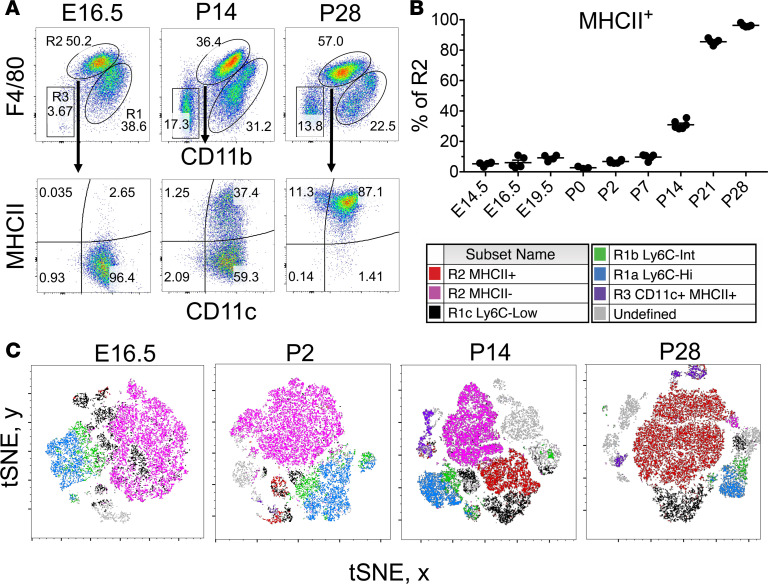
KRMs are embryonically derived, tissue resident, and maintain themselves independent of bone marrow hematopoiesis in the healthy state (35–37). KRMs seed the nascent organ as early as E8.5 during development (36). We hypothesized that a unique phenotypic and transcriptional profile characterizes KRMs at this stage, and, given that they are present during kidney organogenesis, that they are also involved in repair following AKI in adult mice. We studied the surface phenotype of kidney MPs as a function of ontogeny (Figure 5) and found that R2 KRMs at E14.5 are almost entirely negative for MHCII expression, while they are entirely positive at day P28 after birth (Figure 5, A and B). In addition, interestingly, the proportional predominance of myeloid lineage leukocytes in developing kidneys suggests that, among leukocytes, myeloid lineage cells are more likely to participate in development from E14.5 to P2, compared with the lymphoid lineage (Supplemental Figure 5). Utilizing t-stochastic neighbor embedding (tSNE) for analysis of CD45+ lymphoid lineage–Gr-1– kidney MPs, we found that MHCII+ and MHCII– R2 KRMs cluster together at P14 (Figure 5C), indicating these are near-identical cell types at the level of surface phenotype. R1-infiltrative MPs clustered away from R2 KRMs and were heterogeneous compared with KRMs, indicating that R1 MPs are a mixture of multiple cell types (Figure 5C). We also found the proportion of R2 KRMs positive for MHCII expression increased substantially beginning at P7, with an apparent inflection point at P14 (Figure 5B).
Figure 5. Resident macrophages in developing kidneys undergo an MHCII phenotype switch.
(A) Representative 2-parameter flow histograms plotted on CD11b and F4/80 of CD45+ lymphoid–lineage–Gr-1– kidney mononuclear phagocytes (MPs) through development from E16.5 to P28. R2 F4/80hi kidney-resident macrophages (KRMs) are further studied for CD11c and MHCII. (B) Proportion of R2 F4/80hi KRMs expressing MHCII protein at various stages during development from E14.5 to P28. Mean ± SEM, n = 3–6. (C) t-Distributed stochastic neighbor embedding (tSNE) of physical characteristics and surface phenotype of CD45+ lymphoid lineage–Gr-1– kidney MPs with color backgating at various stages of development from E16.5 to P28. Lymphoid lineage includes CD3, CD19, and NK1.1.
KRMs downregulate MHCII after injury.
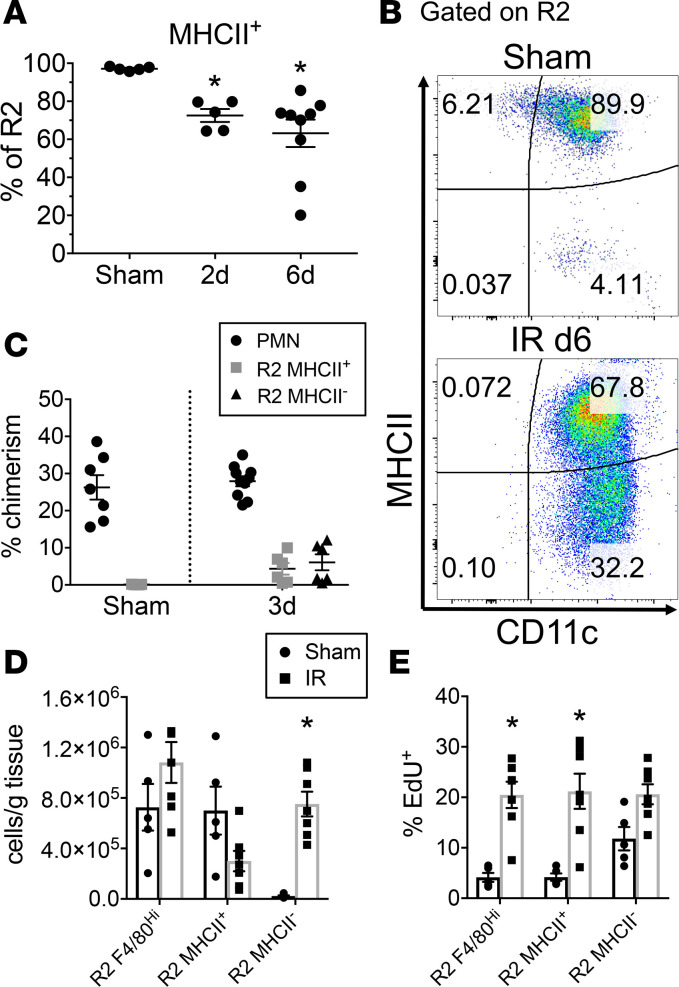
We next tested whether R2 MHCII– KRMs arise after kidney injury induced by bilateral IR-AKI, as we hypothesized that they are important in recovery after injury (Supplemental Figure 6A). Two days after AKI, the proportion of R2 MHCII– KRMs significantly increased to 27.5% ± 3.4% of R2 (P < 0.05 compared with sham) and 36.8% ± 7.2% at 6 days (P < 0.05 compared with sham, P = 0.37, day 2 vs. day 6) (Figure 6, A and B). Examination of the R2 MHCII+ and R2 MHCII– phenotypes in the parabiosis model after AKI revealed no difference in chimerism 3 days after injury, indicating that neither subpopulation of R2 KRMs infiltrated from the blood (Figure 6C). We utilized an in vivo proliferation assay to test whether the MHCII– R2 KRM subpopulation arose from KRMs already present in the kidney at a time point intermediate between days 2 and 6. EdU nucleoside was administered 3 days after injury, and tissue was studied at 4 days. In these mice, enumeration of R2 KRM subpopulations showed that, at this early time point, consistent with our prior observations, the absolute numbers of total R2 KRMs relative to those undergoing sham operation did not significantly change (P = 0.2). But there was a significant increase in MHCII– R2 KRMs (P < 0.05), while MHCII+ cells trended toward a decrease (P = 0.13) (Figure 6D). The MHCII+ R2 KRMs significantly increased in proportion of uptake of EdU after AKI, and MHCII– trended toward an increase, indicating that both populations likely undergo in situ proliferation (Figure 6E). Further, supporting the claim that R1-infiltrative MPs result from bone marrow hematopoiesis, we observed increases in EdU+ myeloid cells in the bone marrow secondary to AKI (Supplemental Figure 6, B and C). Taken together, these data suggest the R2 KRMs are self-renewing, even after AKI. Further, they support the hypothesis that R2 MHCII– cells arise from MHCII+ R2 KRMs through downregulation of MHCII expression and do not originate from the peripheral circulation.
Figure 6. Kidney-resident macrophages downregulate MHCII after injury.
(A) The percentage of R2 kidney-resident macrophages (KRM) positive for MHCII expression in sham and injured (20 minutes bilateral ischemia/reperfusion) mice at varying time points after injury. Mean ± SEM, n = 5–9 from 2 independent experiments, 1-way ANOVA with Sidak’s post-test compared with sham control, *P < 0.05. (B) Flow cytometry 2-parameter histograms gated on R2 KRMs demonstrating MHCII and CD11c expression 6 days after injury compared with sham control. Values are percentage gated. (C) From AKI in parabiosis mice, percentage of chimerism for PMNs, R2 MHCII+, and R2 MHCII– in sham and 3 days after injury. Mean ± SEM, n = 5–10 from 3 independent experiments. (D and E) Absolute numbers (D) and percentage of EdU+ (E) for R2 KRMs, further subset into MHCII+ and MHCII–, indicating changes in cell numbers and proliferative activity during period of 3–4 days after injury (EdU treatment at day 3, endpoint at day 4). Mean ± SEM, n = 5–7 from 2 independent experiments, 2-way ANOVA with Tukey’s post-test compared with sham control, *P < 0.05.
AKI-responsive KRMs adopt a transcriptional profile similar to developmental macrophages during healing.
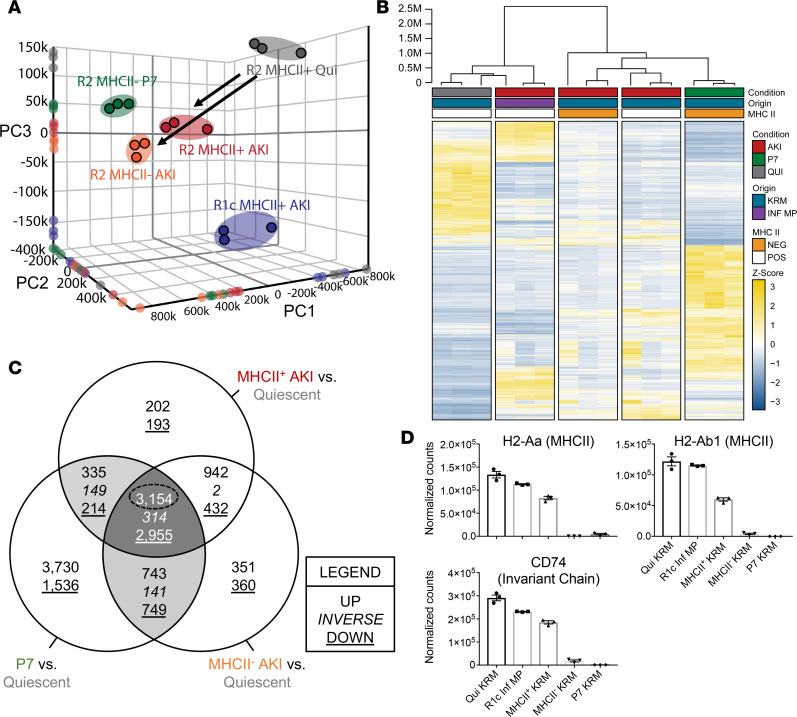
We hypothesized that KRMs undergo transcriptional reprogramming toward a developmental state following injury. We sorted MPs from (a) P7 neonatal pups (R2 MHCII– P7), (b) R2 MHCII+ after AKI, (c) R2 MHCII– after AKI, (d) infiltrative R1c MHCII+ after AKI, and (e) baseline control R2 MHCII+ quiescent (Qui) KRMs from C57BL/6J mice and performed RNA-sequencing (RNAseq) analysis. Dimensionality reduction via unsupervised principal component analysis (PCA) indicated that the transcriptional profiles of injury-responsive R2 KRMs more closely approximated neonatal KRMs (P7) compared with KRMs from untreated adult mice (Qui) (Figure 7A). R1c MHCII+ AKI were distinct from KRMs; thus, MP lineage was a determinant of the transcriptional response to AKI (Figure 7A). Hierarchical clustering and heatmap visualization of differential expression in R2 MHCII- P7 KRMs relative to Qui baseline control KRMs (P < 0.01, 10,376 differentially expressed genes [DEGs]) demonstrated a hierarchy consistent with the PCA analysis (Figure 7B). Conversely, the infiltrative R1c MHCII+ AKI clustered with Qui baseline control KRMs (Figure 7, A and B). We next compared each transcriptional profile from KRMs after AKI and P7 KRMs to the transcriptional profile of normal, Qui R2 KRMs. DEGs were classified using a Venn diagram to indicate genes that were commonly upregulated, downregulated, or inverted for the given comparisons (Figure 7C). The greatest numbers of shared DEGs were observed for the 3-way intersection of MHCII– AKI, MHCII+ AKI, and P7 in comparison to R2 KRMs from Qui, normal mice (Figure 7C). Further, transcripts for MHCII genes (H2-Aa, H2-Ab1) and the invariant chain (Cd74) were decreased in MHCII– AKI and P7 KRMs compared with Qui and MHCII+ AKI KRMs and R1c MHCII+ infiltrative MPs (Figure 7D). These observations reveal that, after injury, KRMs reactivate a transcriptional program that reflects a developmental phenotype.
Figure 7. AKI-responsive kidney-resident macrophages utilize developmental transcriptional programming during healing.
(A) Unsupervised 3-dimensional principal component analysis (PCA) using normalized counts from RNAseq analysis, with spheroids designated according to k-means clustering. RNA was isolated from sorted cells from P7 mice (sex indiscriminate), from adult male quiescent mice, or from adult male mice 6 days after injury. Independent biologic replicates were projected onto each individual principal component axis. (B) Hierarchical clustering and heatmap visualization of DEGs (P7 vs. Qui, P < 0.01), illustrating the treatment condition (injured vs. quiescent), MHCII expression status, and cellular origin. Expression levels represented as relative Z-score, with yellow indicating increased expression and blue decreased expression. (C) Three-way Venn diagram depicting the overlap in DEGs for MHCII+ AKI vs. Quiescent, MHCII– AKI vs. Quiescent, and P7 vs. Quiescent (P < 0.01). (D) RNAseq normalized counts for MHCII and invariant chain gene transcripts in sorted kidney MPs. Mean ± SEM, n = 3 per group. MHCII, major histocompatibility complex class II.
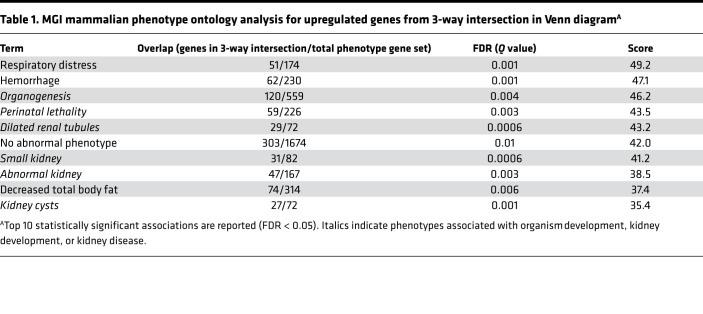
Using an informatics approach to test whether the shared DEGs in the 3-way intersection were linked with biological processes associated with kidney development, we tested for mammalian phenotype gene ontology (GO) terms in the Mouse Genome Informatics (MGI) database from The Jackson Laboratory (46). In this database, mouse gene mutations have been tagged with associated phenotypes. For upregulated genes from the 3-way intersection, the 10 most significant mammalian phenotype GO terms, by combined score (cutoff FDR < 0.05), contained a high degree of enrichment (6 of 10 terms) for organism-wide development, as well as kidney development and disease (Table 1), linking KRM injury response to development. In contrast, downregulated genes from the 3-way intersection indicated associations with abnormal B cell phenotypes (Supplemental Table 2).
Table 1. MGI mammalian phenotype ontology analysis for upregulated genes from 3-way intersection in Venn diagramA.
In order to assess whether M1 or M2 macrophage transcriptional profiles associate with injury-responsive or developmental KRMs, we performed gene set enrichment analysis (GSEA) (47, 48) using transcriptomic data from Jablonski et al. to generate the canonical gene sets (49). However, M1/M2 macrophage gene sets were not useful associations for classifying the KRM response to IR-AKI, nor were they useful for classifying P7 cells (Supplemental Figure 7 and Supplemental Table 3). In aggregate, these data support the conclusion that the transcriptional profiles of both MHCII+ and MHCII– R2 KRMs after injury resemble MHCII– R2 KRMs isolated from P7 neonatal mice. Further, the observed shared transcriptional programming in injury-responsive KRMs was associated with phenotypes, including kidney disease and development, supporting a link between development and injury response, specifically in KRMs.
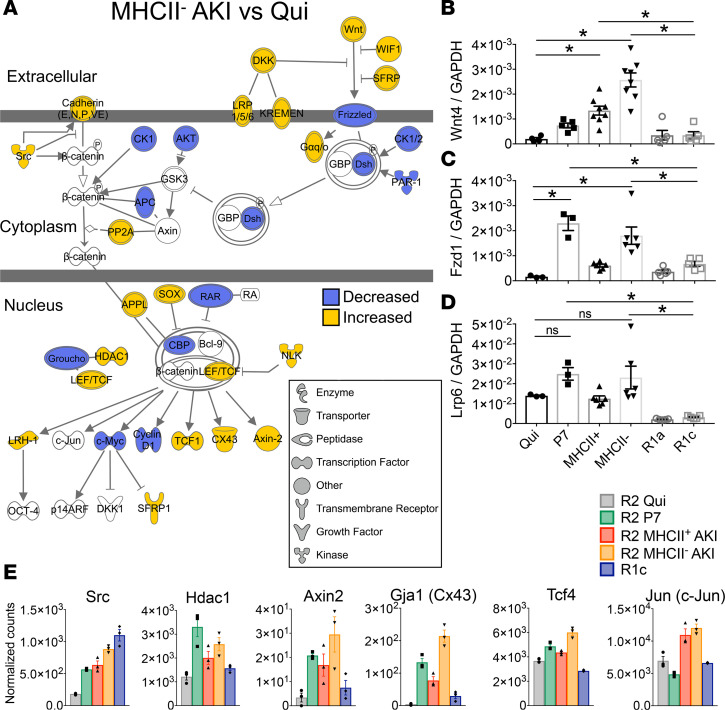
Wnt/b-catenin canonical signaling is enriched in injury-responsive and P7 KRMs. The activation of Wnt signaling is necessary for both kidney development and repair from injury (41, 50–53); therefore, we used the curated Ingenuity pathway database to identify DEGs associated with Wnt/β-catenin signaling among the 3-way intersection of MHCII– AKI, MHCII+ AKI, and P7 KRMs. Gene set enrichment analysis revealed Wnt/β-catenin signaling as among the 10 most-enriched pathways by P value (Supplemental Table 4). Overlaying the differential expression for MHCII– AKI KRMs relative to Qui KRMs over the Wnt/β-catenin gene network, we found a mixed transcriptional signature consistent with transcriptional activation inside KRMs (Figure 8A). Relative expression levels measured by RNAseq suggested Wnt4 was expressed at the highest level, compared with all Wnt ligand transcripts detected, among KRMs (Supplemental Figure 8). Using PCR, we validated differential expression of Wnt4 ligand, as well as receptor, Fzd1, and coreceptor, Lrp6, across KRMs and infiltrative MPs. Expression levels were similar for R2 MHCII– KRMs compared with P7 cells, except for Wnt4, which was increased in KRMs from injured mice compared with Qui KRMs, regardless of MHCII expression. Notably, these transcripts were not observed at comparably high levels in infiltrating R1a or R1c MPs after injury, indicating this response is restricted to resident macrophages (Figure 8, B–D). Transcripts associated with downstream canonical Wnt signaling were observed after injury in MHCII– AKI KRMs, including Axin2, Tcf4, and Jun (Figure 8E). These data indicate KRMs, but not infiltrative MPs, respond to Wnt ligands via canonical Wnt signaling.
Figure 8. Wnt/b-catenin canonical signaling is enriched in injury-responsive and P7 kidney-resident macrophages.
(A) Wnt/β-catenin signaling pathway based on Ingenuity Pathway Analysis (IPA), with overlaid differential gene expression based on MHCII– AKI vs. Quiescent (FDR-adjusted P < 0.05). (B–D) Real-time PCR analysis of sorted kidney MPs for mRNA expression of (B) Wnt4, (C) Fzd1, and (D) Lrp6. Mean ± SEM, n = 3–8, 1-way ANOVA with Dunnett’s post-test comparing each group vs. Qui or R1c, *P < 0.05. (E) Normalized counts from RNAseq for genes associated with canonical Wnt signaling activation downstream of surface receptor binding of Wnt ligands as visualized in A. Expression data displayed for Src, Hdac1, Axin2, Gja1, Tcf4, and Jun. Mean ± SEM, n = 3 per group. Gene symbols are from Mouse Genome Informatics via IPA.
Discussion
Macrophages have the potential to promote inflammation, organ fibrosis, or regeneration in response to tissue injury (54). The results of this work provide insights into the response by resident macrophages in AKI. First, using parabiosis, we established that, despite a significant 8-fold increase in numbers of infiltrating MPs within 24 hours of injury, they contribute minimally to the KRM cell pool after AKI. Therefore, infiltrative MPs do not transition in large numbers into KRMs. Second, KRM do not appear to be replenished through bone marrow hematopoiesis unless they have been depleted. Third, during nephrogenesis, KRMs lack MHCII protein expression, but in adulthood, all KRMs express MHCII. KRMs lacking expression of MHCII reappear during the healing phase after AKI. Fourth, MHCII+ and MHCII– KRMs bear distinct transcriptional signatures. The transcriptome of MHCII– KRMs closely resemble the transcriptome of KRMs isolated from developing kidneys during early neonatal life. Finally, signaling pathway analysis indicates that MHCII– KRMs isolated from kidneys during early neonatal life and after injury are enriched for transcripts involved in downstream canonical Wnt signaling. This includes increases in expression of Tcf4, Axin2, and Jun.
The extent to which MPs infiltrating from the blood differentiate into resident macrophages after AKI was evaluated. The rationale for asking this question lies in our ability to target these cells therapeutically. For example, if bone marrow–derived MPs are needed to replenish the KRM pool and KRMs are required for healing, it would be counterproductive to deplete infiltrative macrophages or prevent their transmigration into the kidney. We established that in IR-AKI relatively few infiltrative MPs differentiate into F4/80hi-expressing KRMs after transmigration from the bloodstream to the interstitium (Figures 1 and 3). While Ki67, a cell cycle protein, was previously found to be expressed in F4/80hi MPs in response to AKI (13), the presence of cycling cells did not explicitly demonstrate that a fraction of new KRMs did not also result from cellular infiltration from the blood stream. Using our model of IR-AKI in parabiotic mice, we established that few cells originating from the blood stream become F4/80hi KRMs, even after substantial infiltrative MP transmigration, which means that in situ proliferation was sufficient to maintain the KRM population. We concluded that infiltrative and resident macrophages are unique cell types, with respect to their origin, a finding which supports inhibition strategies focused on modulating the lineage-specific effects of macrophages, in the environment after injury.
In a prior study, it was shown that bone marrow hematopoiesis depends on the Myb transcription factor (55). It was subsequently reported that R1 MPs and 50% of KRMs were Myb-dependent (36). That group used Mx1Cre+Mybfl/fl mice, in which Myb was deleted secondary to treatment with poly I:C. The bone marrow compartment was reconstituted using transplantation with cells from CD45.1 congenic mice (36). These data were not in agreement with the parabiosis experiments that indicated there was no significant differentiation of bone marrow precursors into KRMs, even after substantial infiltration into the kidney. Using the Mx1Cre+Mybfl/fl experimental system, we confirmed that R1 MPs are Myb dependent and, therefore, bone marrow derived. But in our hands, KRMs were depleted by poly I:C in C57BL/6 mice and Mx1Cre–Mybfl/fl mice, indicating that KRMs are not dependent on Myb. Further, we conclude that, after depletion, KRMs can be replaced by bone marrow–derived precursors, but under normal conditions of injury and homeostasis, they do not appear to receive input from the bone marrow. This conclusion is consistent with our parabiosis experiments which did not display significant differentiation of bone marrow–derived MPs from the peripheral circulation into KRMs, even after substantial infiltration into the kidney. When considering the mechanism by which KRMs are sensitive to poly I:C treatment, we also highlighted that systemic poly I:C injections cause a local infiltrative inflammatory response in the kidney (Figure 4). At this time, it is not clear whether KRM numbers are reduced in the kidney because of cell death or emigration. Further experiments are needed to determine how poly I:C specifically affects KRMs.
Several studies have demonstrated that kidney MPs are necessary for healing after injury (13, 16, 18, 41). However, those studies were not designed to discern phenotypically defined subpopulations of renal MPs and did not elucidate if KRMs could potentially have a prohealing role after AKI. However, the presence and activation state of tissue-resident macrophages specifically, compared with cells that are infiltrative in the injured state, are increasingly recognized as pivotal in promoting normal physiology as well as in disease outcomes (13, 44, 56). Further, increasing attention is being directed toward defining relationships between molecular pathways deployed during organ development and their reintroduction during tissue regeneration in nonlymphoid organs, such as the liver, lung, and kidney (57–64).
The lack of MHCII surface expression on some or all KRMs, in the settings of development (Figure 5) or injury (Figure 6), has interesting potential consequences with respect to immune responses. MHCII is required for MPs to present antigen to CD4+ T cells. The reduction in MHCII expression by injury-responsive KRMs may have two important consequences. First, reduction in antigen presentation to CD4 T cells after injury may serve to reduce the severity of chronic inflammation. This process may also be relevant during development, during which time tissue remodeling may release normally sequestered antigens. Second, the lack of MHCII expression could also allow for energetic resources to be diverted toward functions associated with injury resolution and healing, instead of promoting inflammation.
A previous study by Zhang et al. concluded that numbers of F4/80hi MPs increase in the kidney in response to IR-AKI over time (13). We found that KRM absolute numbers trended toward an increase but did not significantly change compared with KRMs from sham-operated mice 4 days after IR-AKI (20 minutes, ketamine-xylazine, body temperature 36°C ± 1°C). KRMs did demonstrate cell cycle S-phase and a lack of infiltration from the blood stream (Figure 6). Therefore, we hypothesized that, in order to maintain a zero flux for cell numbers, a fraction of KRMs either emigrated from the kidney or died, and progeny cells were produced by in situ proliferation to maintain cell numbers. This in situ proliferation did not result in a robust increase in KRM numbers. However, due to the short time elapsed after injury in our IR-AKI model in individual mice (4 days), it is possible that KRM numbers would have increased in the resolution phase (day 10). From our model of AKI in parabiotic mice, we can conclude that if KRM numbers increased in the resolution phase, it would not likely be due to infiltrative MP differentiation (Figure 1). Importantly, both MHCII+ and MHCII– KRM participated in cell cycle S-phase after injury, supporting the conclusion that the MHCII phenotype did not associate with infiltrative cells or differential cell cycling (Figure 6).
We became particularly interested in understanding the shared features of the MHCII– KRMs present after injury and during development. We isolated KRMs at age P7 while the kidney is actively developing and just before MHCII expression increases and compared their transcriptional profiles to KRMs isolated 6 days after injury (Figure 7). We found that adult KRMs do, in fact, appear to adopt developmental transcriptional programming in response to IR tissue injury.
Canonical Wnt signaling is important in animal models of kidney injury and repair and is associated with the AKI to chronic kidney disease transition in humans after kidney transplantation (64–66). Lindström et al. recently brought into focus a central role for Wnt signaling in mouse and human kidney development, and their findings regarding Wnt4 are particularly relevant to our study (51–53). Wnt4-null mice die shortly after birth, presumably due to kidney failure (67, 68). Considering a central role for Wnt4 in organ development and macrophages in the injury response, we have provided evidence that, among the Wnt ligand transcripts, Wnt4 was most abundant in MHCII– KRMs, 6 days after injury. Further, using pathway analysis, we found evidence that KRMs not only produce but also respond to Wnt ligands and activate downstream canonical Wnt signaling (Figure 8).
To advance these studies toward interventions in patients with AKI, we must understand similarities and differences between mouse KRMs and functionally analogous macrophages in human kidneys. Future experiments will test for shared features of human developmental KRMs and KRMs after injury. This pursuit is currently limited by a lack of explicit means to experimentally identify human KRMs, but ongoing studies aim to address these challenges.
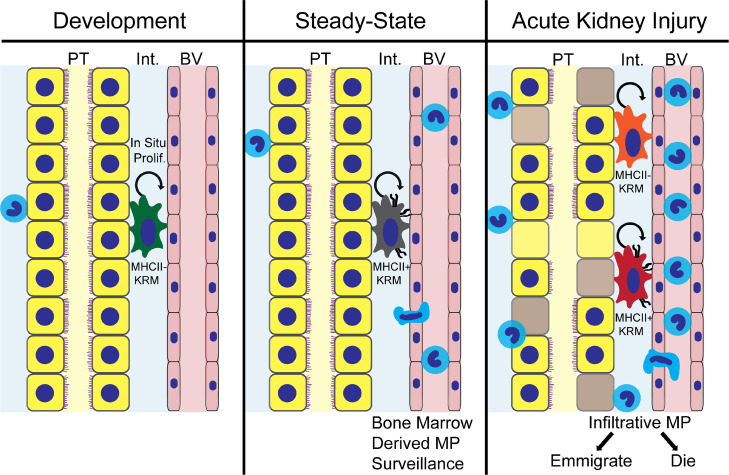
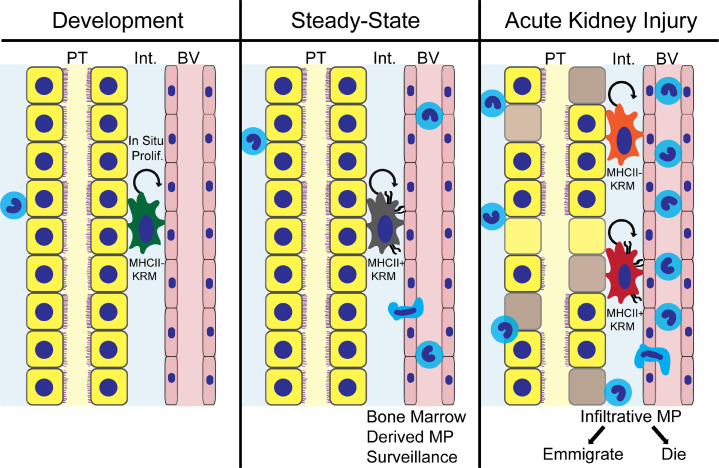
We conclude that the renewing source of KRMs after AKI is predominantly in situ renewal as opposed to infiltration of macrophage precursors from the blood, and KRMs execute an MHCII phenotype switch during development and after injury (Figure 9). KRMs after AKI demonstrate an MHCII phenotype and transcriptional profile similar to that of KRMs during development, defining their transcriptional reprogramming during healing. Further supporting their role in development and healing, KRMs participate in canonical Wnt signaling, both by expression of Wnt ligand genes as well as downstream intracellular signaling mediators. Due to the independence of infiltrative and tissue-resident kidney macrophages, even after AKI, our study supports a lineage-centered approach to intervening in macrophage biology in the after AKI setting.
Figure 9. A lineage model for prohealing mononuclear phagocytes in AKI.
Schematic representation of lineage independence of kidney-resident macrophages (KRMs) from infiltrative mononuclear phagocytes (MPs) after AKI. KRMs show a phenotypic developmental switch for MHCII expression, and MHCII– KRMs reappear in the setting of injury, reproducing transcriptional profiles present in these cells during nephrogenesis. Unique compared with infiltrative MPs, KRMs display activation of downstream canonical Wnt signaling in response to injury.
Methods
Animals.
Mice were obtained from The Jackson Laboratory and were males aged 8–16 weeks, unless specified, including the following strains: C57BL/5J (stock 000664) and B6.SJL-PtprcaPepcb/BoyJ (stock 002014). Mx1CreMybfl/fl mice were provided by Frederic Geissmann (Sloan Kettering Institute, New York, New York, USA) and Jon Frampton (University of Birmingham, Birmingham, United Kingdom). The genotype of transgenic mice was confirmed by PCR on genomic DNA isolated from the tail per the protocol previously reported (36). AKI performed on individual (nonparabiotic) mice followed previously published protocols (15) and consisted of 20 minutes bilateral IR, under i.p.-administered ketamine (90 g/g BW)/xylazine (10 μg/g BW) anesthetic, kept at a body temperature of 36°C ± 1°C, as measured by a rectal thermometer during the procedure. Complete reperfusion was confirmed visually within 1 minute of clamp removal. Poly I:C (MilliporeSigma, P1530) was dissolved in sterile normal saline to a stock concentration of 1 mg/ml and stored at –20°C. 10 μg/g BW or saline vehicle were administered every other day via intraperitoneal injection for a total of 7 injections.
Parabiosis model.
Male mice matched for age 10 weeks ± 7 days and body mass 25 ± 5 g were cohoused from the age of 4 weeks ± 7 days, with a density no greater than 6 mice per cage. The animals were monitored daily for evidence of fighting and were exposed to gel food diet supplement at least 2 times, 2–6 weeks before parabiotic attachment surgery. Animals were randomly assigned a pair member within their cohoused cohort.
Parabiosis surgery was performed as previously described (35). Animals were provided with water in a plastic dish on the floor of the cage as well as moistened chow and gel food diet supplement (Bio-Serv Nutra-Gel Diet, 6.7 g/pair, 1/6 of 40 g cube) daily for 4 days after the procedure. During this period, body weight was recorded, and mice were observed for signs of delayed recovery, pain, distress, open wounds, or infection. From 5 days after procedure, gel food diet supplement was provided every other day, until 28 days after parabiosis. After separation, with care taken to avoid infection, interrupted 5-0 absorbable sutures were placed to close skin near joints and continuous sutures ventrally and dorsally to close the skin incision along the flank. For all parabiosis mice, including AKI in parabiosis mice, buprenorphine was administered as needed for analgesia (1 μg/g BW).
AKI in parabiosis.
Parabiotic chimeras were anesthetized with inhaled isoflurane 1.5%–2.0% v/v induction, 1.0%–1.5% v/v maintenance, via a dual nose cone. Fur was removed from the surgical site; the bilateral flank regions of the injury or sham mouse were disinfected and incisions were made. Atraumatic vascular clamps (Fine Science Tools, 18055-05) were applied to the hilum of both kidneys. Ischemia was confirmed by color change to dark purple and maintained for 30 minutes with careful maintenance of body temperature at 36°C ± 1°C by rectal thermometer. Reperfusion was visually confirmed within 1 minute. Mice were monitored during recovery from anesthesia. In some cases, one parabiotic pair member recovered more quickly than its partner. Water and gel food diet supplement were provided on the floor of the cage every day for 3 days after surgery.
Flow cytometry.
Leukocytes were isolated as previously described (35). Mice were anesthetized with isoflurane (2.5% v/v for induction, 1.5% v/v for maintenance) and perfused with 30–40 ml cold phosphate buffered saline through the left ventricle. Tissues were digested with Liberase DL (Roche Diagnostics) in DMEM medium, 10 mM HEPES, pH 7.4, for 30 minutes at 37°C shaking. Cold PEB buffer (PBS, 2 mM EDTA, 1% v/v BSA) was added to stop digestion. Tissues were disaggregated by aspiration through 18-g and then 20-g syringes in sequence and passed over a 40-μm nylon cell strainer. Red blood cells were lysed using ACK lysis buffer at room temperature for 2 minutes for kidney, 3 minutes for spleen, and 5 minutes for blood, followed by a wash with cold PBS. Leukocytes were stained according to the following protocol. Cells were washed with staining buffer (PBS, 0.5% w/v BSA, 0.01% w/v sodium azide) or PBS. Fcγr2/3 was blocked with anti-mouse CD16/32 (clone 93), followed by surface staining. Flow cytometry cell staining panels are listed in Supplemental Table 1. 7-Aminoactinomycin or Aqua Live/Dead (Invitrogen, L34966, 1:1000 in PBS prior to surface stain) were used for dead cell exclusion. See Supplemental Table 1 for details regarding monoclonal antibodies used for flow cytometry. Stock EdU solution was made at 25 mg/ml in DMSO and stored desiccated at –20°C. EdU was diluted to 5 mg/ml in sterile normal saline immediately prior to injection and administered intraperitoneally at a dose of 1 mg per animal, 24 hours prior to endpoint. Click-iT EdU Alexa Fluor 647 staining for flow cytometry was performed per the manufacturer protocol (Invitrogen, C10419). For RNAseq and qPCR on isolated leukocyte subpopulations, cells were isolated using electronic cell sorting on a FACSAria (BD) and were sorted directly into Trizol (Life Technologies).
Confocal immunofluorescence and bright-field microscopy and digital image analysis.
Following cryosectioning, kidney tissue was washed with 1× PBS and fixed with 4% PFA for 10 minutes. The section was permeabilized with 0.2 % Triton X-100 for 8 minutes and blocked in PBS with 1% BSA, 0.3% Triton X-100, 2% v/v donkey serum for 30 minutes at room temperature. Sections were incubated in primary antibody overnight at 4°C followed by the addition of appropriate secondary antibodies for 30 minutes at room temperature. Primary antibodies included F4/80 (BM8, 1:200) and its isotype (RTK2758, 1:200); CD45.2 conjugated with Alexa Fluor 488 (104, 1:100) and its isotype (MOPC-173, 1:40); and CD45.1 conjugated with Alexa Fluor 647 (A20, 1:100) and its isotype (MOPC-173, 1:5) (all from BioLegend). The secondary antibody for F4/80 is Rhodamine Red–conjugated donkey anti-rat (polyclonal IgG, 1:200, Jackson ImmunoResearch). Following addition of secondary antibody, slides were washed and nuclei were stained by Hoechst nuclear stain (1:1000, Thermo Fisher). Coverslips were mounted using IMMU-MOUNT (Thermo Fisher). All fluorescence images were captured on Nikon Ti2 Spinning Disk (Yokogawa X1) confocal microscope. Bright-field images of periodic acid–Schiff hematoxylin-stained sections were acquired using a Keyence BZ-X700 microscope. Digital image analysis was performed in FIJI (version 1.51n). Colocalization analysis above experimenter-set threshold reports Mander’s Colocalization Coefficient, as measured by JACoP (Just Another Colocalization Plugin) (69). Color, brightness, and contrast adjustments were made in an identical manner for matched sections.
RNA isolation and quantification of mRNA expression.
Total RNA was isolated using the miRNEasy Micro Kit (Qiagen, 217084) following the manufacturer’s protocol. RNA quality was assessed using the Agilent 2100 Bioanalyzer and only samples with a RIN score > 8.0 were used for qPCR or RNAseq. RNA was sequenced on NextSeq500 system (Illumina), and the library was prepared with the Agilent SureSelect Stranded mRNA kit.
Relative mRNA expression was quantified using SYBR Green–based real-time PCR from cDNA generated from total RNA (Thermo Fisher). Comparative threshold cycle method was employed, and values were normalized to GAPDH mRNA as an internal control. Primers used included the following: Wnt4 fwd: 5′-GGTGGTGACACAAGGGACCCG-3′, rev: 5′- GCACTGTCCGGTCACAGCCA-3′; Fzd1 fwd: 5′-CAGCAGTACAACGGCGAAC-3′, rev: 5′- GTCCTCCTGATTCGTGTGGC-3′; Lrp6 fwd: 5′-GCCCCTTTGTTGCTTTATGC-3′, rev: 5′-AACGAAGCGACTTGAGCCAT-3′; and GAPDH fwd: 5′-ATCATCCCTGCATCCACT-3′, GAPDH, rev: 5′-ATCCACGACGGACACATT-3′. All reactions were performed in duplicate, and melting curve analysis was employed to monitor specificity.
RNAseq data processing and analysis.
Sequencing data have been deposited within the Gene Expression Omnibus repository (GSE121410). RNA was submitted to the Heflin Genomics Core (University of Alabama at Birmingham [UAB]) for paired-end, high-throughput RNAseq using Illumina NexSeq500 with 75-bp read-length. Sequenced samples were then inspected for quality using Multiqc (70) to ensure PHRED >30. Reads were aligned and annotated to the Gencode mus musculus genome (GRCm38) using STAR (71), transcript abundances (raw counts) were calculated using HTSeq-Count version 0.9.1, and differential gene expression performed using DESeq2 (72) (1.18.1) within the R (3.4.2) statistical computing environment, as described previously (73), with project-specific details outlined in the Supplemental Methods. To address sample-size constraints (n = 3), aligned count dispersion estimates were determined via maximum likelihood to assume that genes of similar average expression strength possess similar dispersion, as previously described (72). These gene-wise dispersion estimates were then shrunken by an empirical Bayes approach to provide normalized count data for genes in proportion to both gene dispersion and sample size. Differential expression was determined using quantile-normalized read counts via log2 (fold change) using the Wald test followed by Bonferroni-adjusted P value (i.e., Q value, FDR) for each aligned and annotated gene. Statistical significance was assigned using an unpaired 2-tailed Bonferroni-adjusted P value (Q value, FDR) of less than or equal to 0.05 unless otherwise specified.
Functional and network gene enrichment analysis, along with curated literature-supported candidate upstream regulators, were performed using either Enrichr (74, 75) or QIAGEN’s Ingenuity Pathway Analysis (IPA, QIAGEN) on RNAseq data sets (P < 0.01 versus R2 Qui). Using Enrichr Ontologies, statistically significant (FDR < 0.05) phenotype associations from the MGI Mammalian Phenotype gene set were reported. Within IPA software, pathway analysis was done both on the individual data sets and as a combined “comparison” analysis to determine overlapping enriched pathways. Heatmap generation was performed using pheatmap package (1.0.8) within R.
Kidney function measurements.
Serum creatinine was quantified at the UAB-UCSD O’Brien Center for AKI Research using liquid chromatography–tandem mass spectrometry (LC-MS/MS) as previously described (76).
Statistics.
Statistical analyses were performed using Graphpad Prism software (version 7.0c). Specific statistical tests applied appear in figure legends and include 2-way ANOVA with Tukey’s post-test, 2-way ANOVA, Sidak’s post-test, 1-way ANOVA with Sidak’s post-test, and 1-way ANOVA with Dunnett’s post-test. Data are presented as mean ± SEM. Values of P < 0.05 were considered statistically significant.
Study approval.
All procedures involving mice were performed in accordance with National Institutes of Health guidelines regarding the care and use of live animals and were reviewed and approved by the Institutional Animal Care and Use Committee of UAB.
Author contributions
JML, TDH, AA, and JFG designed research studies. JML, TDH, RB, LMB, OOA, YJ, ZL, JEP, HEE, MRC, and JFG conducted experiments. JML, TDH, LMB, OOA, ZL, MRC, and JFG acquired data. JML, TDH, RB, MEP, LMB, OOA, AMT, JEP, DKC, MRC, and JFG analyzed data. JML, TDH, RB, MEP, LMB, OOA, AMT, JEP, DKC, MRC, SB, KAZ, MM, BKY, AA, and JFG interpreted data. JML, TDH, MEP, LMB, ZY, YJ, ZL, DKC, MRC, SB, KAZ, ARW, AA, and JFG provided methodology expertise. ARW, MM, BKY, AA, and JFG provided reagents and resources. JML, TDH, AA, and JFG wrote the manuscript. All authors reviewed, edited, and approved the final version of the manuscript.
Supplementary Material
Acknowledgments
This work was supported by National Institute of Diabetes and Digestive and Kidney Diseases grants R01-DK-59600 (to AA and JFG); R01-DK-115752 (to BKY); R01-DK-097423 (to MM); F31-DK-115169 (to JML); T32-DK-116672 (to LMB); and K01-DK-103931 (to SB) and the core resource of the UAB-UCSD O’Brien Center for AKI Research (NIH grant P30-DK-079337 to AA). Additional support was from the Office of Research and Development, Medical Research Service, Department of Veterans Affairs (I01-BX00229 to MM), the Polycystic Kidney Disease Research Foundation (214G16A to BKY), UAB School of Medicine (AMC21 to BKY, MM, and JFG), UAB Medical Scientist Training Program (NIH T32-GM-008361 to JML and JEP), NIH T32-HL-134640 (to JEP), and NIH T32-AI-007051 (to KAZ). We acknowledge John D. Mountz, Vidya Sagar Hanumanthu, and the UAB Comprehensive Flow Cytometry Core (NIH grant P30-AR-04831); the UAB Heflin Genomics Core; and the UAB Comprehensive Cancer Center Core (NIH grant P30-CA- 013148). We thank Farah Abou Daya for technical contributions and Janusz Kabarowski for guidance on bone marrow transplant studies. We acknowledge Somersault 18:24 for providing mouse and kidney graphics.
Version 1. 01/24/2019
Electronic publication
Version 2. 12/14/2023
Han E. Eckenrode's name was updated
Footnotes
Conflict of interest: MM reports grants and consulting fees from Otsuka Pharmaceutical and Sanofi. AA serves as a consultant for DynaMed and is on the advisory board of Goldilocks Therapeutics.
License: Copyright 2019, American Society for Clinical Investigation.
Reference information: JCI Insight. 2019;4(2):e125503. https://doi.org/10.1172/jci.insight.125503.
Contributor Information
Jeremie M. Lever, Email: jlever@uab.edu.
Travis D. Hull, Email: Thull1@partners.org.
Ravindra Boddu, Email: rboddu@uab.edu.
Laurence M. Black, Email: lmblac@uab.edu.
Oreoluwa O. Adedoyin, Email: oreadedoyin@gmail.com.
Zhengqin Yang, Email: zhengqinyang@uabmc.edu.
Yanlin Jiang, Email: yjiang@uabmc.edu.
Zhang Li, Email: ZhangLi@uab.edu.
Michael R. Crowley, Email: mcrowley@uab.edu.
Subhashini Bolisetty, Email: sbolisetty@uabmc.edu.
Kurt A. Zimmerman, Email: zimmermk@uab.edu.
Michal Mrug, Email: mmrug@uab.edu.
Anupam Agarwal, Email: agarwal@uab.edu.
References
- 1.Lo LJ, et al. Dialysis-requiring acute renal failure increases the risk of progressive chronic kidney disease. Kidney Int. 2009;76(8):893–899. doi: 10.1038/ki.2009.289. [DOI] [PMC free article] [PubMed] [Google Scholar]
- 2.Chawla LS, Eggers PW, Star RA, Kimmel PL. Acute kidney injury and chronic kidney disease as interconnected syndromes. N Engl J Med. 2014;371(1):58–66. doi: 10.1056/NEJMra1214243. [DOI] [PMC free article] [PubMed] [Google Scholar]
- 3.Chawla LS, Kimmel PL. Acute kidney injury and chronic kidney disease: an integrated clinical syndrome. Kidney Int. 2012;82(5):516–524. doi: 10.1038/ki.2012.208. [DOI] [PubMed] [Google Scholar]
- 4.Lee BJ, et al. Non-recovery from dialysis-requiring acute kidney injury and short-term mortality and cardiovascular risk: a cohort study. BMC Nephrol. 2018;19(1):134. doi: 10.1186/s12882-018-0924-3. [DOI] [PMC free article] [PubMed] [Google Scholar]
- 5.Go AS, et al. Acute kidney injury and risk of heart failure and atherosclerotic events. Clin J Am Soc Nephrol. 2018;13(6):833–841. doi: 10.2215/CJN.12591117. [DOI] [PMC free article] [PubMed] [Google Scholar]
- 6.Heung M, et al. Acute kidney injury recovery pattern and subsequent risk of CKD: an analysis of veterans health administration data. Am J Kidney Dis. 2016;67(5):742–752. doi: 10.1053/j.ajkd.2015.10.019. [DOI] [PMC free article] [PubMed] [Google Scholar]
- 7.Ishani A, et al. Acute kidney injury increases risk of ESRD among elderly. J Am Soc Nephrol. 2009;20(1):223–228. doi: 10.1681/ASN.2007080837. [DOI] [PMC free article] [PubMed] [Google Scholar]
- 8.Thakar CV, Christianson A, Himmelfarb J, Leonard AC. Acute kidney injury episodes and chronic kidney disease risk in diabetes mellitus. Clin J Am Soc Nephrol. 2011;6(11):2567–2572. doi: 10.2215/CJN.01120211. [DOI] [PMC free article] [PubMed] [Google Scholar]
- 9.Belcher JM, et al. Association of AKI with mortality and complications in hospitalized patients with cirrhosis. Hepatology. 2013;57(2):753–762. doi: 10.1002/hep.25735. [DOI] [PMC free article] [PubMed] [Google Scholar]
- 10.Libório AB, Leite TT, Neves FM, Teles F, Bezerra CT. AKI complications in critically ill patients: association with mortality rates and RRT. Clin J Am Soc Nephrol. 2015;10(1):21–28. doi: 10.2215/CJN.04750514. [DOI] [PMC free article] [PubMed] [Google Scholar]
- 11.Wonnacott A, Meran S, Amphlett B, Talabani B, Phillips A. Epidemiology and outcomes in community-acquired versus hospital-acquired AKI. Clin J Am Soc Nephrol. 2014;9(6):1007–1014. doi: 10.2215/CJN.07920713. [DOI] [PMC free article] [PubMed] [Google Scholar]
- 12.Hobson C, et al. Cost and mortality associated with postoperative acute kidney injury. Ann Surg. 2015;261(6):1207–1214. doi: 10.1097/SLA.0000000000000732. [DOI] [PMC free article] [PubMed] [Google Scholar]
- 13.Zhang MZ, et al. CSF-1 signaling mediates recovery from acute kidney injury. J Clin Invest. 2012;122(12):4519–4532. doi: 10.1172/JCI60363. [DOI] [PMC free article] [PubMed] [Google Scholar]
- 14.Ernandez T, Mayadas TN. The changing landscape of renal inflammation. Trends Mol Med. 2016;22(2):151–163. doi: 10.1016/j.molmed.2015.12.002. [DOI] [PMC free article] [PubMed] [Google Scholar]
- 15.Hull TD, et al. Heme oxygenase-1 regulates myeloid cell trafficking in AKI. J Am Soc Nephrol. 2015;26(9):2139–2151. doi: 10.1681/ASN.2014080770. [DOI] [PMC free article] [PubMed] [Google Scholar]
- 16.Li L, et al. The chemokine receptors CCR2 and CX3CR1 mediate monocyte/macrophage trafficking in kidney ischemia-reperfusion injury. Kidney Int. 2008;74(12):1526–1537. doi: 10.1038/ki.2008.500. [DOI] [PMC free article] [PubMed] [Google Scholar]
- 17.Rabb H, et al. Inflammation in AKI: current understanding, key questions, and knowledge gaps. J Am Soc Nephrol. 2016;27(2):371–379. doi: 10.1681/ASN.2015030261. [DOI] [PMC free article] [PubMed] [Google Scholar]
- 18.Ferenbach DA, et al. Macrophage/monocyte depletion by clodronate, but not diphtheria toxin, improves renal ischemia/reperfusion injury in mice. Kidney Int. 2012;82(8):928–933. doi: 10.1038/ki.2012.207. [DOI] [PubMed] [Google Scholar]
- 19.Gandolfo MT, et al. Foxp3+ regulatory T cells participate in repair of ischemic acute kidney injury. Kidney Int. 2009;76(7):717–729. doi: 10.1038/ki.2009.259. [DOI] [PubMed] [Google Scholar]
- 20.Ascon M, et al. Renal ischemia-reperfusion leads to long term infiltration of activated and effector-memory T lymphocytes. Kidney Int. 2009;75(5):526–535. doi: 10.1038/ki.2008.602. [DOI] [PMC free article] [PubMed] [Google Scholar]
- 21.Burne MJ, et al. Identification of the CD4(+) T cell as a major pathogenic factor in ischemic acute renal failure. J Clin Invest. 2001;108(9):1283–1290. doi: 10.1172/JCI12080. [DOI] [PMC free article] [PubMed] [Google Scholar]
- 22.Burne-Taney MJ, Yokota-Ikeda N, Rabb H. Effects of combined T- and B-cell deficiency on murine ischemia reperfusion injury. Am J Transplant. 2005;5(6):1186–1193. doi: 10.1111/j.1600-6143.2005.00815.x. [DOI] [PubMed] [Google Scholar]
- 23.Huen SC, Moeckel GW, Cantley LG. Macrophage-specific deletion of transforming growth factor-β1 does not prevent renal fibrosis after severe ischemia-reperfusion or obstructive injury. Am J Physiol Renal Physiol. 2013;305(4):F477–F484. doi: 10.1152/ajprenal.00624.2012. [DOI] [PMC free article] [PubMed] [Google Scholar]
- 24.Humphreys BD. Mechanisms of renal fibrosis. Annu Rev Physiol. 2018;80:309–326. doi: 10.1146/annurev-physiol-022516-034227. [DOI] [PubMed] [Google Scholar]
- 25.Maarouf OH, et al. Paracrine Wnt1 drives interstitial fibrosis without inflammation by tubulointerstitial cross-talk. J Am Soc Nephrol. 2016;27(3):781–790. doi: 10.1681/ASN.2014121188. [DOI] [PMC free article] [PubMed] [Google Scholar]
- 26.Humphreys BD, et al. Fate tracing reveals the pericyte and not epithelial origin of myofibroblasts in kidney fibrosis. Am J Pathol. 2010;176(1):85–97. doi: 10.2353/ajpath.2010.090517. [DOI] [PMC free article] [PubMed] [Google Scholar]
- 27.Grgic I, et al. Targeted proximal tubule injury triggers interstitial fibrosis and glomerulosclerosis. Kidney Int. 2012;82(2):172–183. doi: 10.1038/ki.2012.20. [DOI] [PMC free article] [PubMed] [Google Scholar]
- 28.Yang L, Besschetnova TY, Brooks CR, Shah JV, Bonventre JV. Epithelial cell cycle arrest in G2/M mediates kidney fibrosis after injury. Nat Med. 2010;16(5):535–43. doi: 10.1038/nm.2144. [DOI] [PMC free article] [PubMed] [Google Scholar]
- 29.Ferenbach DA, Bonventre JV. Mechanisms of maladaptive repair after AKI leading to accelerated kidney ageing and CKD. Nat Rev Nephrol. 2015;11(5):264–276. doi: 10.1038/nrneph.2015.3. [DOI] [PMC free article] [PubMed] [Google Scholar]
- 30.Kramann R, et al. Perivascular Gli1+ progenitors are key contributors to injury-induced organ fibrosis. Cell Stem Cell. 2015;16(1):51–66. doi: 10.1016/j.stem.2014.11.004. [DOI] [PMC free article] [PubMed] [Google Scholar]
- 31.Kramann R, Wongboonsin J, Chang-Panesso M, Machado FG, Humphreys BD. Gli1+ pericyte loss induces capillary rarefaction and proximal tubular injury. J Am Soc Nephrol. 2017;28(3):776–784. doi: 10.1681/ASN.2016030297. [DOI] [PMC free article] [PubMed] [Google Scholar]
- 32.Hume DA. The mononuclear phagocyte system. Curr Opin Immunol. 2006;18(1):49–53. doi: 10.1016/j.coi.2005.11.008. [DOI] [PubMed] [Google Scholar]
- 33.Soos TJ, et al. CX3CR1+ interstitial dendritic cells form a contiguous network throughout the entire kidney. Kidney Int. 2006;70(3):591–596. doi: 10.1038/sj.ki.5001567. [DOI] [PubMed] [Google Scholar]
- 34.Kawakami T, et al. Resident renal mononuclear phagocytes comprise five discrete populations with distinct phenotypes and functions. J Immunol. 2013;191(6):3358–3372. doi: 10.4049/jimmunol.1300342. [DOI] [PMC free article] [PubMed] [Google Scholar]
- 35.Lever JM, et al. Parabiosis reveals leukocyte dynamics in the kidney. Lab Invest. 2018;98(3):391–402. doi: 10.1038/labinvest.2017.130. [DOI] [PMC free article] [PubMed] [Google Scholar]
- 36.Schulz C, et al. A lineage of myeloid cells independent of Myb and hematopoietic stem cells. Science. 2012;336(6077):86–90. doi: 10.1126/science.1219179. [DOI] [PubMed] [Google Scholar]
- 37.Stamatiades EG, et al. Immune monitoring of trans-endothelial transport by kidney-resident macrophages. Cell. 2016;166(4):991–1003. doi: 10.1016/j.cell.2016.06.058. [DOI] [PMC free article] [PubMed] [Google Scholar]
- 38.Mildner A, et al. Genomic characterization of murine monocytes reveals C/EBPβ transcription factor dependence of Ly6C- cells. Immunity. 2017;46(5):849–862.e7. doi: 10.1016/j.immuni.2017.04.018. [DOI] [PubMed] [Google Scholar]
- 39.Menezes S, et al. The heterogeneity of Ly6Chi monocytes controls their differentiation into iNOS+ macrophages or monocyte-derived dendritic cells. Immunity. 2016;45(6):1205–1218. doi: 10.1016/j.immuni.2016.12.001. [DOI] [PMC free article] [PubMed] [Google Scholar]
- 40.Kramann R, et al. Parabiosis and single-cell RNA sequencing reveal a limited contribution of monocytes to myofibroblasts in kidney fibrosis. JCI Insight. 2018;3(9):e99561. doi: 10.1172/jci.insight.99561. [DOI] [PMC free article] [PubMed] [Google Scholar]
- 41.Lin SL, et al. Macrophage Wnt7b is critical for kidney repair and regeneration. Proc Natl Acad Sci USA. 2010;107(9):4194–4199. doi: 10.1073/pnas.0912228107. [DOI] [PMC free article] [PubMed] [Google Scholar]
- 42.Bajpai G, et al. The human heart contains distinct macrophage subsets with divergent origins and functions. Nat Med. 2018;24(8):1234–1245. doi: 10.1038/s41591-018-0059-x. [DOI] [PMC free article] [PubMed] [Google Scholar]
- 43.Epelman S, et al. Embryonic and adult-derived resident cardiac macrophages are maintained through distinct mechanisms at steady state and during inflammation. Immunity. 2014;40(1):91–104. doi: 10.1016/j.immuni.2013.11.019. [DOI] [PMC free article] [PubMed] [Google Scholar]
- 44.Hulsmans M, et al. Macrophages facilitate electrical conduction in the heart. Cell. 2017;169(3):510–522.e20. doi: 10.1016/j.cell.2017.03.050. [DOI] [PMC free article] [PubMed] [Google Scholar]
- 45.Mass E, et al. Specification of tissue-resident macrophages during organogenesis. Science. 2016;353(6304):aaf4238. doi: 10.1126/science.aaf4238. [DOI] [PMC free article] [PubMed] [Google Scholar]
- 46.Smith CL, Blake JA, Kadin JA, Richardson JE, Bult CJ, Mouse Genome Database Group Mouse Genome Database (MGD)-2018: knowledgebase for the laboratory mouse. Nucleic Acids Res. 2018;46(D1):D836–D842. doi: 10.1093/nar/gkx1006. [DOI] [PMC free article] [PubMed] [Google Scholar]
- 47.Subramanian A, et al. Gene set enrichment analysis: a knowledge-based approach for interpreting genome-wide expression profiles. Proc Natl Acad Sci USA. 2005;102(43):15545–15550. doi: 10.1073/pnas.0506580102. [DOI] [PMC free article] [PubMed] [Google Scholar]
- 48.Mootha VK, et al. PGC-1alpha-responsive genes involved in oxidative phosphorylation are coordinately downregulated in human diabetes. Nat Genet. 2003;34(3):267–273. doi: 10.1038/ng1180. [DOI] [PubMed] [Google Scholar]
- 49.Jablonski KA, et al. Novel markers to delineate murine M1 and M2 macrophages. PLoS ONE. 2015;10(12):e0145342. doi: 10.1371/journal.pone.0145342. [DOI] [PMC free article] [PubMed] [Google Scholar]
- 50.DiRocco DP, Kobayashi A, Taketo MM, McMahon AP, Humphreys BD. Wnt4/β-catenin signaling in medullary kidney myofibroblasts. J Am Soc Nephrol. 2013;24(9):1399–1412. doi: 10.1681/ASN.2012050512. [DOI] [PMC free article] [PubMed] [Google Scholar]
- 51.Lindström NO, et al. Conserved and divergent features of mesenchymal progenitor cell types within the cortical nephrogenic niche of the human and mouse kidney. J Am Soc Nephrol. 2018;29(3):806–824. doi: 10.1681/ASN.2017080890. [DOI] [PMC free article] [PubMed] [Google Scholar]
- 52.Lindström NO, et al. Conserved and divergent features of human and mouse kidney organogenesis. J Am Soc Nephrol. 2018;29(3):785–805. doi: 10.1681/ASN.2017080887. [DOI] [PMC free article] [PubMed] [Google Scholar]
- 53.Lindström NO, et al. Conserved and divergent molecular and anatomic features of human and mouse nephron patterning. J Am Soc Nephrol. 2018;29(3):825–840. doi: 10.1681/ASN.2017091036. [DOI] [PMC free article] [PubMed] [Google Scholar]
- 54.Wynn TA, Vannella KM. Macrophages in tissue repair, regeneration, and fibrosis. Immunity. 2016;44(3):450–462. doi: 10.1016/j.immuni.2016.02.015. [DOI] [PMC free article] [PubMed] [Google Scholar]
- 55.Emambokus N, Vegiopoulos A, Harman B, Jenkinson E, Anderson G, Frampton J. Progression through key stages of haemopoiesis is dependent on distinct threshold levels of c-Myb. EMBO J. 2003;22(17):4478–4488. doi: 10.1093/emboj/cdg434. [DOI] [PMC free article] [PubMed] [Google Scholar]
- 56.A-Gonzalez N, et al. Phagocytosis imprints heterogeneity in tissue-resident macrophages. J Exp Med. 2017;214(5):1281–1296. doi: 10.1084/jem.20161375. [DOI] [PMC free article] [PubMed] [Google Scholar]
- 57.Gordillo M, Evans T, Gouon-Evans V. Orchestrating liver development. Development. 2015;142(12):2094–2108. doi: 10.1242/dev.114215. [DOI] [PMC free article] [PubMed] [Google Scholar]
- 58.Kotton DN, Morrisey EE. Lung regeneration: mechanisms, applications and emerging stem cell populations. Nat Med. 2014;20(8):822–832. doi: 10.1038/nm.3642. [DOI] [PMC free article] [PubMed] [Google Scholar]
- 59.Beers MF, Morrisey EE. The three R’s of lung health and disease: repair, remodeling, and regeneration. J Clin Invest. 2011;121(6):2065–2073. doi: 10.1172/JCI45961. [DOI] [PMC free article] [PubMed] [Google Scholar]
- 60.Königshoff M, Saglani S, Marsland BJ, Eickelberg O. Rebuilding a diseased lung: repair and regeneration. Eur Respir J. 2013;41(3):497–499. doi: 10.1183/09031936.00173012. [DOI] [PubMed] [Google Scholar]
- 61.Königshoff M, Eickelberg O. WNT signaling in lung disease: a failure or a regeneration signal? Am J Respir Cell Mol Biol. 2010;42(1):21–31. doi: 10.1165/rcmb.2008-0485TR. [DOI] [PubMed] [Google Scholar]
- 62.Dziedzic K, Pleniceanu O, Dekel B. Kidney stem cells in development, regeneration and cancer. Semin Cell Dev Biol. 2014;36:57–65. doi: 10.1016/j.semcdb.2014.08.003. [DOI] [PubMed] [Google Scholar]
- 63.Munro DAD, Hughes J. The origins and functions of tissue-resident macrophages in kidney development. Front Physiol. 2017;8:837. doi: 10.3389/fphys.2017.00837. [DOI] [PMC free article] [PubMed] [Google Scholar]
- 64.Edeling M, Ragi G, Huang S, Pavenstädt H, Susztak K. Developmental signalling pathways in renal fibrosis: the roles of Notch, Wnt and Hedgehog. Nat Rev Nephrol. 2016;12(7):426–439. doi: 10.1038/nrneph.2016.54. [DOI] [PMC free article] [PubMed] [Google Scholar]
- 65.Kawakami T, Ren S, Duffield JS. Wnt signalling in kidney diseases: dual roles in renal injury and repair. J Pathol. 2013;229(2):221–231. doi: 10.1002/path.4121. [DOI] [PubMed] [Google Scholar]
- 66.Venner JM, Famulski KS, Reeve J, Chang J, Halloran PF. Relationships among injury, fibrosis, and time in human kidney transplants. JCI Insight. 2016;1(1):e85323. doi: 10.1172/jci.insight.85323. [DOI] [PMC free article] [PubMed] [Google Scholar]
- 67.Stark K, Vainio S, Vassileva G, McMahon AP. Epithelial transformation of metanephric mesenchyme in the developing kidney regulated by Wnt-4. Nature. 1994;372(6507):679–683. doi: 10.1038/372679a0. [DOI] [PubMed] [Google Scholar]
- 68.Shan J, Jokela T, Peltoketo H, Vainio S. Generation of an allele to inactivate Wnt4 gene function conditionally in the mouse. Genesis. 2009;47(11):782–788. doi: 10.1002/dvg.20566. [DOI] [PubMed] [Google Scholar]
- 69.Bolte S, Cordelières FP. A guided tour into subcellular colocalization analysis in light microscopy. J Microsc. 2006;224(Pt 3):213–232. doi: 10.1111/j.1365-2818.2006.01706.x. [DOI] [PubMed] [Google Scholar]
- 70.Ewels P, Magnusson M, Lundin S, Käller M. MultiQC: summarize analysis results for multiple tools and samples in a single report. Bioinformatics. 2016;32(19):3047–3048. doi: 10.1093/bioinformatics/btw354. [DOI] [PMC free article] [PubMed] [Google Scholar]
- 71.Dobin A, et al. STAR: ultrafast universal RNA-seq aligner. Bioinformatics. 2013;29(1):15–21. doi: 10.1093/bioinformatics/bts635. [DOI] [PMC free article] [PubMed] [Google Scholar]
- 72.Love MI, Huber W, Anders S. Moderated estimation of fold change and dispersion for RNA-seq data with DESeq2. Genome Biol. 2014;15(12):550. doi: 10.1186/s13059-014-0550-8. [DOI] [PMC free article] [PubMed] [Google Scholar]
- 73.Pepin ME, et al. Antiretroviral therapy potentiates high-fat diet induced obesity and glucose intolerance. Mol Metab. 2018;12:48–61. doi: 10.1016/j.molmet.2018.04.006. [DOI] [PMC free article] [PubMed] [Google Scholar]
- 74.Chen EY, et al. Enrichr: interactive and collaborative HTML5 gene list enrichment analysis tool. BMC Bioinformatics. 2013;14:128. doi: 10.1186/1471-2105-14-128. [DOI] [PMC free article] [PubMed] [Google Scholar]
- 75.Kuleshov MV, et al. Enrichr: a comprehensive gene set enrichment analysis web server 2016 update. Nucleic Acids Res. 2016;44(W1):W90–W97. doi: 10.1093/nar/gkw377. [DOI] [PMC free article] [PubMed] [Google Scholar]
- 76.Takahashi N, Boysen G, Li F, Li Y, Swenberg JA. Tandem mass spectrometry measurements of creatinine in mouse plasma and urine for determining glomerular filtration rate. Kidney Int. 2007;71(3):266–271. doi: 10.1038/sj.ki.5002033. [DOI] [PubMed] [Google Scholar]
Associated Data
This section collects any data citations, data availability statements, or supplementary materials included in this article.


