Abstract
The Polar A300 fitness watch includes a feature termed the 5-minute fitness test. This feature claims to estimate maximal oxygen consumption (VO2max) in healthy adults. The purpose of this study was to assess the validity and reliability of the Polar A300 “Fitness Test” VO2max estimation feature. Nineteen recreationally active young adult males (n=9) and females (n=10) completed a Bruce protocol treadmill protocol to assess VO2max, followed by two separate 5-minute Polar Fitness Test (VO2max estimation) trials. A Pearson’s r test was used to determine the relationship between VO2max from the Bruce Test to each Polar watch VO2max estimate, as well as to a non-exercise VO2max prediction equation. Additionally, a One Way ANOVA assessed differences in absolute group means of the Polar results to the Bruce Test, and non-exercise prediction model. There was a statistically significant, moderate-strong relationship between the Polar and the criterion Bruce VO2max estimations with the first Polar Test (n=19; r=.635; p<.05), as well as the second (n=19; r=.645; p<.05). The average VO2max of the two Polar tests and the Bruce test show greatest positive correlation (n=19; r=0.655; p<0.001). The reliability of the Polar watch indicated significance between the test-retest results (n=19; r=.907; p<.05). Lastly, the positive correlation between the non-exercise predicted model and the Bruce Test was weaker than the polar predictions (n=19; r=.522; p<.05). Preliminary results conclude that the Polar A300 Fitness watch is a valid tool for estimation of VO2max.
Keywords: VO2max, Polar A300 fitness watch and activity tracker, fitness test, Bruce treadmill test, non-exercise prediction equation
INTRODUCTION
Numerous studies have shown that aerobic fitness results in short term and long term benefits, both physiologically and psychologically (6, 10, 12). Small improvements in one’s aerobic capacity have been linked to significant improvements in cardiovascular disease (CVD) risk profile in adolescents, adults, and older adults (5, 9, 13). This is crucial, because CVD is the leading cause of mortality in the United States, equaling more than 800,000 individuals, or one in every third death being associated with CVD, costing nearly $444 billion dollars in the US annually emphasizing the importance of decreasing the risk of this disease (15). Extending the benefits of cardiovascular fitness, research suggests that long-term aerobic fitness shows benefits of brain health on elderly individuals for a reduction of brain tissue loss and improved cognitive ability (4, 8). This information illustrates the importance of aerobic fitness, leading to the imperativeness of having the ability to measure fitness levels from a reliable fitness tool in order to track an individual’s progress and improvements for both a clinical and athletic training setting.
Maximal oxygen uptake (VO2max) is a popular and reliable method to quantitatively measure cardiovascular fitness. Many laboratory and field-based tests are used to determine this value, with the Bruce treadmill protocol and indirect calorimetry being the among the most common laboratory methods. However, participation in maximal exertion testing may not be appropriate, practical, or safe depending on one’s health risk profile. Additionally, a maximal treadmill test may not be appropriate for individuals such as elderly, injured, or any participant who is not capable of running on a treadmill until failure. Aside from the physical risk of completing maximal exertion testing, few individuals outside the research setting have access to physiological testing equipment and expertise necessary for safe and valid measurements. Due to the limitations of time, laboratory space, specialized equipment, and medical supervision at times, it is highly beneficial for the individual to have a device that can quickly analyze or predict VO2max. The Polar A300 is a fitness watch and activity tracker that has a fitness test feature that claims to “…measure your aerobic fitness at rest in just five minutes. The result evaluates your maximal oxygen uptake (VO2max)”, of healthy young adults (14). The fitness test feature uses a non-exercise assessment that includes laying supine for a period of five minutes, while wearing the heart rate monitor chest strap that continuously monitors resting heart rate variability. Upon completion of the five-minute test, a proprietary “fitness calculation” is used to predict VO2max based on heart rate, age, sex, height and body weight. While the practical application of this technology appears promising, no peer-reviewed studies have been published to confirm these claims. Therefore, this investigation will test the validity and reliability of the Polar A300 VO2max estimation.
The Bruce treadmill protocol (3) was employed in conjunction with indirect calorimetry to represent the criterion VO2max for each participant. The Bruce protocol is a standard graded exercise test, commonly used clinical and laboratory based assessments of cardiorespiratory fitness. Additionally, the Bruce protocol has been used in similar validation studies (7) and allow for easy comparison of results against past, and future investigations. In addition to performing physical tests to estimate VO2max, prediction equations can also be used to estimate these results. The University of Houston Non-exercise Prediction Equation (NEPM) is a common model that has been used to predict VO2max, using variables of gender, age, height, weight, BMI and a self-report physical activity rating (PAR) (11). The benefit of adding the NEPM to this investigation is to determine if the Polar estimation provides increased accuracy compared to a standard non-exercise model.
Finally, aerobic, cardiovascular fitness is a crucial component of overall health and quality of life. Therefore, having an accurate and reliable device to measure and track fitness levels will not only improve one’s health in a clinical setting such as decreasing the risk of CVD, heart attack, or stroke, but also for an athlete’s ability to reach optimal, peak performance throughout training. The purpose of this investigation is to test and analyze the claim of the Polar A300 fitness watch and activity tracker “Fitness Test” feature. This will be accomplished by comparing the final VO2max readings of the Polar to a Bruce protocol treadmill test. It was hypothesized that there would be a statistically significant relationship between the Polar A300 and the criterion Bruce treadmill test VO2max estimations.
METHODS
Participants
This study included healthy male (n=9) and female (n=10) individuals, mean age 21.84± 4.21 years. The health status of these individuals were disease free who were capable of performing the Bruce protocol treadmill test until failure. Exclusion criteria included individuals who could not safely perform the maximal Bruce treadmill test due to any cardiovascular, metabolic, respiratory or orthopedic limitations. The university’s Institutional Review Board (IRB) approved all investigational procedures.
Protocol
The procedures for this experiment included three meeting days, with each participant signing an informed consent form on the first day. Anthropometric and demographic data of height, weight, age, sex, and self-report training were recorded prior to a maximal exertion Bruce treadmill test. This session was followed by the next two meeting sessions that involved the Polar A300 5-minute Fitness Test. Each testing session was separated by 24–48 hours.
Maximal oxygen uptake was determined by indirect calorimetry (Cosmed Fitmate Pro) using a multistage Bruce treadmill protocol (3). Heart rate, Rating of Perceived Exertion (RPE) and oxygen consumption was recorded for each minute of exercise. RPE was measured using the Borg 6–20 RPE scale (1). Participants were instructed to terminate the test upon reaching volitional fatigue. Criteria for achieving true VO2max included participants reaching 90% or greater age predicted maximal heart rate, or an 18–20 rating on the Borg RPE scale.
The Polar A300 fitness test began with proper fitting of the Polar heart rate monitor chest strap. Prior to the test, the participant were instructed to lie supine on an athletic training table located in a quit laboratory room for approximately fifteen minutes. Resting heart rate was continuously recorded during this resting period. To initiate the Polar fitness test, the participant’s demographic information including age, gender, height, and weight, was entered into the Polar watch. At that time the watch was connected to the Polar Flow account electronically, the fitness test feature was activated and ‘start test’ was selected. The participants were instructed to remain still, relaxing until their heart rate was obtained. The participant was instructed to stay as still as possible and make limited movements and communication with others during the 5- minute assessment at which time the Polar watch measures heart rate variability during rest. The progress was visible on the watch screen, and once the test was completed, the estimated VO2max was reported and downloaded onto the Polar Flow web service for analysis. Lastly, test results were recorded and compared to the Polar ‘OwnIndex’ for comparison to other individuals of the same age and sex.
The non-exercise test equation for predicting VO2max from the University of Houston was used to provide an additional non-exercise model for comparison purposes (11). The equation used self-report variables of height, weight, gender, age, and physical activity rating (PAR) to predict VO2max. A thorough description of the prediction equation can be viewed in another source (11).
Statistical Analysis
Descriptive statistics are reported as means ± standard deviation (SD). Independent t-test were used to compare male vs. female characteristics. Pearson’s r tests were used to determine the relationship between VO2max readings of the Bruce Test to both of the Polar watch VO2max estimates, as well as the non-exercise VO2max prediction equation. Additionally, a One Way – Analysis of Variance (ANOVA) was used to determine the difference in absolute group means of the Polar VO2max results to the Bruce Test, and non-exercise prediction model. Significant main effects were examined with a Tukey post hoc procedure. Vassar stats were used to analyze this data, and statistical significance was accepted as p<0.05.
RESULTS
Descriptive characteristics for the 19 participants included in the investigation are reported in Table 1. The mean age was 21.4±4.2 years for total sample. The physical activity rating (PAR) for the NEPM from Houston University had a mean score of 5.4±1.5. This means that most of these participants are in relatively healthy fitness shape, as this number falls in between the two categories of: "Runs 1–5 miles per week or spends 30–60 minutes per week in comparable physical activity, and runs 5–10 miles per week or spends 1–3 hours per week in comparable physical activity".
Table 1.
Participant Characteristics.
| Females (n=11) | Males (n=8) | |
|---|---|---|
| Age (years) | 20.3±1.35* | 24.0±6.02 |
| Height(m) | 1.72±0.05 * | 1.86±0.04 |
| Weight (kg) | 71.0±8.44 * | 94.6±16.0 |
| BMI (kg·m2) | 27.18±4.12* | 23.97±2.30 |
| VO2max (ml/kg/min) (Bruce) | 48.03±8.11 | 49.62±6.56 |
| Physical Activity Rating (PAR for NEPM) | 5.91±1.45 | 4.88±1.64 |
(Values are means±SD)
Significantly different (p<0.05) than males
Table 1 above shows the participant characteristics of the n=19 MSUB volunteers that participated in this project. These numbers correlate back to the Polar fitness test self-report between "heavy (5–8 hours a week) and semi-pro (8–12 hours a week)", showing that the population was relatively more fit than the general population might be, as a zero in the PAR is classified as "Avoids walking or exercise (for example, always uses elevators, drives whenever possible instead of walking)," and a seven is classified as, "Runs more than 10 miles per week or spends more than 3 hours per week in comparable physical activity."
The absolute group mean VO2max recorded from each testing method is listed in Table 2 below. The One-Way ANOVA indicated that there was a significant difference between assessment methods (F(2,36)=9.7; p<0.001). After further analysis with a Tukey Test, it was found that there was no difference between the Bruce and Polar VO2max results, but they were both significantly higher than the NEPM.
Table 2.
Absolute group mean VO2max From Each Testing Method.
(Values are means±SD)
Significantly different (p<0.01) than NEPM
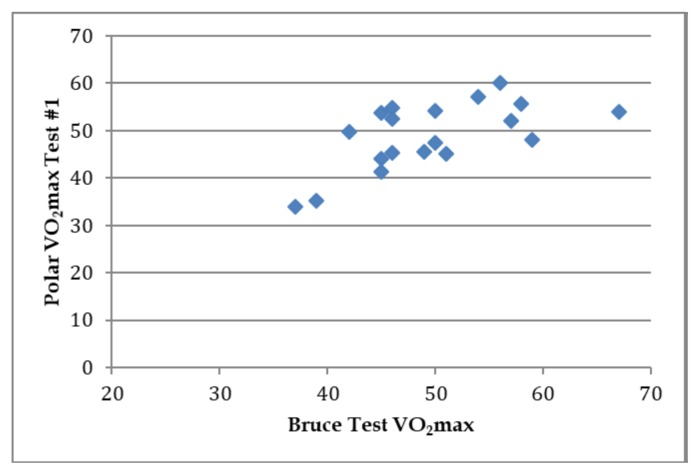
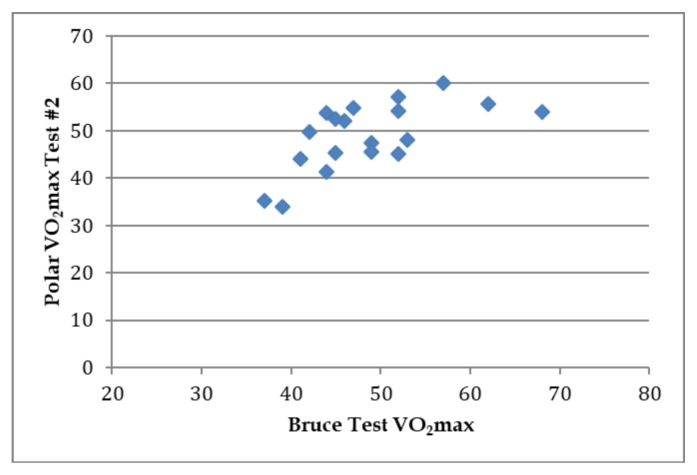
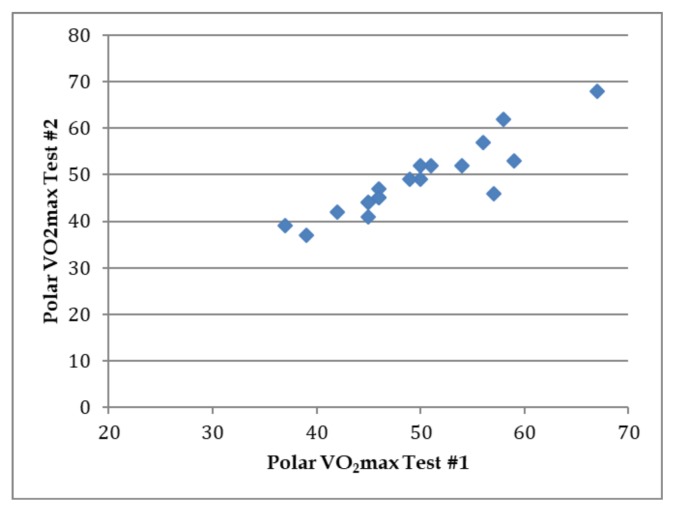
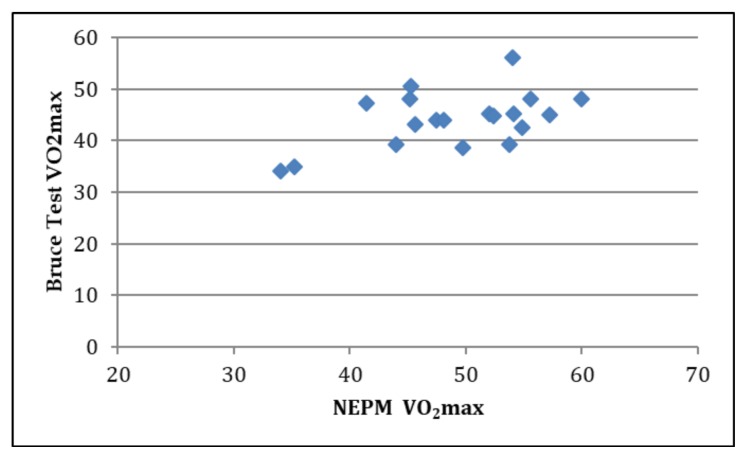
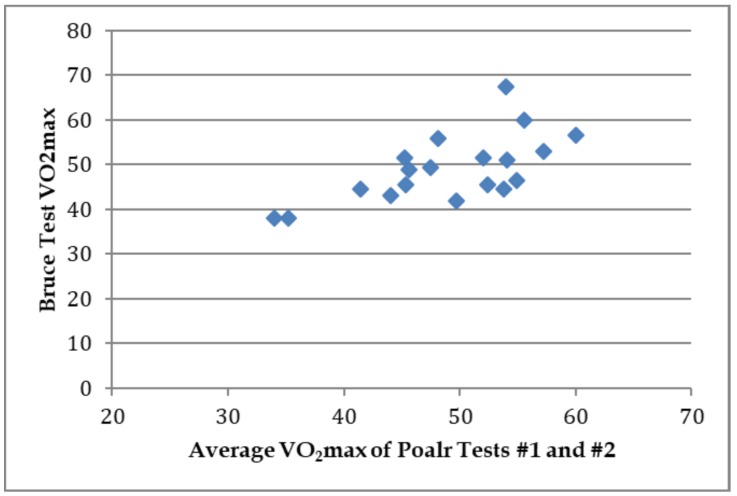
The primary analysis for this experiment was the correlation between the Bruce Treadmill Test and the Polar A300 Fitness Tests. Three separate Pearson's r correlations were completed to determine the relationships between the Bruce treadmill test with the Polar test #1, Polar test #2, and the average of the two Polar tests. The results showed a statistically significant relationship for all three analyses. The Bruce Test was significantly correlated to Polar test #1 (n=19; r=.635; p<0.05), and Polar test #2 (n=19; r=.645; p<.05) with a moderate to strong relationship. The strongest correlation occurred between the averages of the two Polar tests and the Bruce test (n=19; r=0.655; p<0.05). Additionally, the reliability within the Polar A300 watch also resulted in a statistically high correlation between the Polar test #1 and Polar test #2 tests with a r value of r=.907 (n=19; r=.907; p<.05), supporting the devices reliability. Lastly, the correlation between the NEPM resulted in an r value of r= 0.522 (n=19; r=.522; p<.05), showing the statistically significant relationship between the two, yet not as strong as the Bruce and Polar Test correlations. The figures displayed below represent the correlation between these statistics.
Figures 1 and 2 above show the results of the correlation between the Bruce Test and the Polar tests #1 and #2 show very similar results. Based on these preliminary findings, the Polar A300's Fitness Test is a valid estimate of one's VO2max.
Figure 1.
Correlation between Polar Test #1 VO2max versus the Bruce Test VO2max estimations (n=19; r=.635; p<0.05).
Figure 2.
Correlation between Polar Test #2 VO2max versus the Bruce Test VO2max estimations (n=19; r=.645; p<.05).
As for the average of the two Polar tests for each individual participant in figure three above, the correlation between these the averages and the Bruce test show an even stronger positive correlation as the two individual Polar test #1 and Polar test #2. This shows that using the average of multiple Polar Fitness Tests will result in a stronger positive correlation, and therefore a more valid VO2max estimate.
Figure 4 shows the strong positive correlation between the two separate Polar tests to demonstrate the level of reliability within the Polar A300's Fitness Test. With a statistically significant relationship between these variables, an r value of r=0.907, shows that if this test is conducted more than once, it would yield the same results within the calculation of these statistically significant results at p<0.001 (n=19; r=.907; p<.05). According to these results, the Polar watch is therefore a reliable tool for estimating VO2max in these two tests conducted.
Figure 4.
Correlation between Polar Tests #1 and #2 for the 19 participants for reliability testing of the Polar A300 (n=19; r=.907; p<.05).
Figure 5 displays the final Pearson's r correlation, showing a positive correlation between the Bruce test and the NEPM through Houston University. Although this relationship is still statistically significant with a p value of p<0.05, the correlation coefficient is lower at r=0.522 compared to the Bruce versus Polar test #1 at r=0.635, the Bruce verses Polar #2 at r=0.645, and the average of the two Polar Tests verses the Bruce test at r=0.655. This shows that the Polar A300's Fitness Test may prove to be a better predictor of VO2max when compared to the Bruce VO2max estimation. However, additional research is needed to validate the Polar test with different populations and in a larger sample.
Figure 5.
Correlation between the Bruce Test VO2max versus the Non Exercise Prediction Model for VO2max estimations (n=19; r=.522; p<.05).
DISCUSSION
Overall, this study successfully investigated the validity and reliability of the Polar A300's Fitness Test to predict VO2max in 19 healthy young adults. The Polar A300 may be a valid tool for VO2max estimations in therapy and training settings for individuals lacking access to professionals and possibly those not physically capable of performing a field or treadmill test. The reliability of the Polar A300 is statistically significant within itself, as the test-retest procedure suggests. Lastly, due to the NEPM having a weaker positive correlation than any of the Polar versus Bruce test correlations (n=19; r=.522; p<.05), initial results suggest the purchasing of the Polar A300 fitness watch may provide more accurate VO2max estimations.
As for the reliability within the Polar A300 watch itself, the statistically high correlation between the test-retest procedure between the Polar 1 and Polar 2 tests show the accuracy of the device within itself, with an r value of r=.0907 and a p value of p<0.001. Lastly, the correlation between the NEPM with an r value of r= 0.522 and a p value at p<0.001 (n=19; r=.522; p<.05) shows there is a statistically significant relationship between the two. However, this positive correlation is weaker than those with the Polar watch Fitness Tests. If future investigations support these findings, the polar test may become the preferred non-exercise VO2max estimation tool. In regards to the Polar watch Fitness test, it seems as if the validity of its VO2max estimations has improved through the course of this company's fitness watch and activity tracker history. This is seen through a study that tested the validity of the Polar 11 Heart Rate Monitor and fitness watch in 2011, which was one of the first methods for VO2max estimation with the fitness watch and activity tracker (7). The VO2max estimations from the Polar 11 were crossed with the results from the maximal treadmill test VO2max results for a correlation value of r=0.54, which is a weaker correlation than this experiments results (7). This shows the improvement of this company's VO2max estimations over time, and that they may become more valid as time progresses.
Although the correlation between the NEPM and the Bruce test did not have as strong of a correlation as with the two polar tests, it was still significant correlated with the Bruce test. A previous test that was conducted by Bradshaw et al., (2005), included testing the regression equation for the prediction of VO2max against a graded exercise test. The equation used here included VO2max (mL·kg − 1 · min − 1) = 48.0730 + (6.1779 x gender; women = 0, men = 1) − (0.2463 x age) − (0.6186 x BMI) + (0.7115 x PFA) + (0.6709 x PA−R), which resulted in a correlation value of r=0.91 for the prediction of the capability to walk, jog, or run certain distances as well as for the current physical activity level of the individual (2). These results, along with the One-Way ANOVA test signify that the NEPM may under-predict VO2max in fit young adults. This shows that this model may be a more accurate NEPM to be used in the future for assessments of aerobic fitness.
Limitations in this study were mainly associated with the sample population. Participants were non-randomized volunteers. The sample was delimited to healthy young adults limiting the generalizability to that demographic. Additionally, the participants self-reported their physical activity levels for the NEPM. This may not have presented significant error for this population, as the average aerobic fitness level for both males and females was above average indicating consistency with the self-reported activity levels. Finally, some of the participant's test results within the experiment showed large individual differences in the predicted and criterion Bruce test results. This shows possible limitations within the Polar A300's Fitness Test ability to predict VO2max in healthy young adults. Therefore, additional research is required for complete validity of this tools ability to estimate VO2max. Future investigations should include a larger, more diverse population with greater variability in age, cardiorespiratory fitness, physical activity patterns, and health status. An investigation specifically targeting a larger population of sedentary adults is warranted, as this segment of the population may be most likely to benefit from a valid and reliable non-exercise prediction of cardiorespiratory fitness.
In conclusion, this investigation presents preliminary data to validate the Polar A300's Fitness Test ability to predict VO2max in active young adults. The results indicate that this device provides an accurate and reliable estimation of VO2max in the sample population.
Figure 3.
Correlation between averages of Polar Tests #1 and #2 VO2max versus the Bruce Test VO2max estimations (n=19; r=0.655; p<0.05).
REFERENCES
- 1.Borg G. Human kinetics. 1998. Borg's perceived exertion and pain scales. [Google Scholar]
- 2.Bradshaw DI, George JD, Hyde A, LaMonte MJ, Vehrs PR, Hager RL, Yanowitz FG. An accurate VO2max nonexercise regression model for 18-65-year-old adults. Res Q Exerc Sport. 2005;76(4):426–432. doi: 10.1080/02701367.2005.10599315. [DOI] [PubMed] [Google Scholar]
- 3.Bruce RA, Kusumi F, Hosmer D. Maximal oxygen intake and nomographic assessment of functional aerobic impairment in cardiovascular disease. Am Heart J. 1973;85:546–562. doi: 10.1016/0002-8703(73)90502-4. [DOI] [PubMed] [Google Scholar]
- 4.Colcombe SJ, Erickson K, Raz N, Webb AG, Cohen NJ, McAuley E, Kramer AF. Aerobic fitness reduces brain tissue loss in aging humans. J Gerontol. 2003;58(2):M176–M180. doi: 10.1093/gerona/58.2.m176. [DOI] [PubMed] [Google Scholar]
- 5.Dencker M, Thorsson O, Karlsson MK, Lindén C, Wollmer P, Andersen LB. Aerobic fitness related to cardiovascular risk factors in young children. Eur J Pediatr. 2012;171(4):705–710. doi: 10.1007/s00431-011-1617-0. [DOI] [PubMed] [Google Scholar]
- 6.DiLorenzo TM, Bargman EP, Stucky-Ropp R, Brassington GS, Frensch PA, LaFontaine T. Long-term effects of aerobic exercise on psychological outcomes. Prev Med. 1999;28(1):75–85. doi: 10.1006/pmed.1998.0385. [DOI] [PubMed] [Google Scholar]
- 7.Esco MR, Mugu EM, Williford HN, McHugh AN, Bloomquist BE. Cross-validation of the polar fitness test TM via the polar f11 heart rate monitor in predicting vo2 max. J Exerc Physiol Online. 2011;24:5–1. [Google Scholar]
- 8.Etnier JL, Nowell PM, Landers DM, Sibley BA. A meta-regression to examine the relationship between aerobic fitness and cognitive performance. Brain Res Rev. 2006;52(1):119–130. doi: 10.1016/j.brainresrev.2006.01.002. [DOI] [PubMed] [Google Scholar]
- 9.Fernström M, Fernberg U, Eliason G, Hurtig-Wennlöf A. Aerobic fitness is associated with low cardiovascular disease risk: the impact of lifestyle on early risk factors for atherosclerosis in young healthy Swedish individuals–the Lifestyle, Biomarker, and Atherosclerosis study. Vascular Health Risk Managment. 2017;13:91. doi: 10.2147/VHRM.S125966. [DOI] [PMC free article] [PubMed] [Google Scholar]
- 10.Foulds H, Bredin S, Charlesworth S, Ivey A, Warburton D. Exercise volume and intensity: a dose-response relationship with health benefits. Eur J Appl Physiol. 2014;114(8):1563–1571. doi: 10.1007/s00421-014-2887-9. [DOI] [PubMed] [Google Scholar]
- 11.Jackson AS, Blair SN, Mahar MT, Wier LT, Ross RM, Stuteville JE. Prediction of functional aerobic capacity without exercise testing. Med Sci Sports Exerc. 1990;22(6):863–870. doi: 10.1249/00005768-199012000-00021. [DOI] [PubMed] [Google Scholar]
- 12.Miller K, McClave S, Jampolis M, Hurt R, Krueger K, Landes S, Collier B. The health benefits of exercise and physical activity. Current Nutr Report. 2016;5(3):204–212. [Google Scholar]
- 13.Orkaby AR, Forman DE. Physical activity and CVD in older adults: an expert’s perspective. Expert Rev Cardiovascular Ther. 2018;16(1):1–10. doi: 10.1080/14779072.2018.1419062. [DOI] [PubMed] [Google Scholar]
- 14.Polar. Fitness Test. 2015. Retrieved January 16, 2017 from http://support.polar.com/e_manuals/A300/Polar_A300_user_manual_English/Cont.
- 15.Yang Q, Cogswell ME, Flanders WD, Hong Y, Zhang Z, Loustalot F, Hu FB. Trends in cardiovascular health metrics and associations with all-cause and CVD mortality among US adults. J Am Med Assoc. 2012;307(12):1273–1283. doi: 10.1001/jama.2012.339. [DOI] [PMC free article] [PubMed] [Google Scholar]


