

Abstract
Purpose
In a preclinical drug screen, mithramycin was identified as a potent inhibitor of the Ewing sarcoma EWS–FLI1 transcription factor. We conducted a phase I/II trial to determine the dose-limiting toxicities (DLT), maximum tolerated dose (MTD), and pharmacokinetics (PK) of mithramycin in children with refractory solid tumors, and the activity in children and adults with refractory Ewing sarcoma.
Patients and methods
Mithramycin was administered intravenously over 6 h once daily for 7 days for 28 day cycles. Adult patients (phase II) initially received mithramycin at the previously determined recommended dose of 25 μg/kg/dose. The planned starting dose for children (phase I) was 17.5 μg/kg/dose. Plasma samples were obtained for mithramycin PK analysis.
Results
The first two adult patients experienced reversible grade 4 alanine aminotransferase (ALT)/aspartate aminotransferase (AST) elevation exceeding the MTD. Subsequent adult patients received mithramycin at 17.5 μg/kg/dose, and children at 13 μg/kg/dose with dexamethasone pretreatment. None of the four subsequent adult and two pediatric patients experienced cycle 1 DLT. No clinical responses were observed. The average maximal mithramycin plasma concentration in four patients was 17.8 ± 4.6 ng/mL. This is substantially below the sustained mithramycin concentrations ≥50 nmol/L required to suppress EWS–FLI1 transcriptional activity in preclinical studies. Due to inability to safely achieve the desired mithramycin exposure, the trial was closed to enrollment.
Conclusions
Hepatotoxicity precluded the administration of a mithramycin at a dose required to inhibit EWS–FLI1. Evaluation of mithramycin in patients selected for decreased susceptibility to elevated transaminases may allow for improved drug exposure.
Keywords: Ewing sarcoma, Mithramycin, EWS–FLI1
Introduction
Ewing sarcoma is the second most common malignant bone tumor of childhood [1]. Current treatment includes local therapy as well as risk-adapted chemotherapy and leads to long-term survival of 73% in patients with localized disease [2, 3]. In patients with metastatic disease at diagnosis, recurrent, or refractory disease the prognosis is poor with limited response to current salvage regimens.
Ewing sarcoma tumors have fusion oncogenic trascription factors generated by chromosomal translocations involving the EWS gene and one of the E26 transformation-specific (ETS) transcription factors [4, 5]. In 85% of cases of Ewing sarcoma, the EWS–FLI1 fusion transcription factor is generated by a t(11;22)(q24;q12) chromosomal translocation [5]. This transcription factor contains the DNA binding domain of FLI1 and the transactivating domain of EWS while losing the majority of the regulatory domains of both proteins [6]. This leads to a constitutively active transcription factor that modulates the expression of more than 500 genes [7]. EWS–FLI1 induces gene expression by binding to regions of the genome called GGAA microsatellites and at the same time represses gene expression displacing other ETS family members from chromatin [8, 9]. This aberrant genetic program clearly plays a role in the oncogenic phenotype and is hypothesized to drive malignant transformation [10–12]. Additionally, knockdown of EWS–FLI1 with antisense DNA, siRNA, or dominant negative methods is incompatible with Ewing sarcoma cell survival [13].
In an effort to identify molecules that inhibit EWS–FLI1, we previously performed a high throughput screen of more than 50,000 compounds and identified mithramycin as an inhibitor of EWS–FLI1 [14]. Mithramycin suppresses the activity of EWS–FLI1 at the promoter level, reverses expression of the EWS–FLI1 gene signature, and blocks the expression of key downstream targets such as ID2 and NR0B1 at the protein level [15–17]. In vitro suppression of EWS–FLI1 requires the sustained mithramycin exposure of 50–100 nM [14]. In addition, mithramycin showed excellent activity in Ewing sarcoma xenografts likely related to its ability to exceed these concentrations and to accumulation to 385 nmol/L in mouse tumors [14, 18]. The potential utility of mithramycin in Ewing sarcoma was also supported by early literature that reported a durable complete response in one of five patients with widely metastatic Ewing sarcoma, treated with mithramycin at a dose of 25 μg/kg/day over 5–10 days [19].
The clinical experience with mithramycin is extensive as more than 1500 patients treated with mithramycin are reported in the literature. Mithramycin underwent broad clinical evaluation in solid tumors and leukemias in the 1960s and was found to have some activity against leukemias, lymphomas, carcinomas and testicular cancer and was briefly used in the clinic for this tumor prior to the development of the current treatment regimen [20]. A formal maximum tolerated dose (MTD) has not been established. However, there are early reports of drug efficacy at 50 μg/kg/dose daily for 5 days [21]. A subsequent study of 58 patients receiving this dosing regimen reported significant toxicity consisting of anorexia, nausea and vomiting in 70% of patients [22]. Other frequently reported toxicities include elevated liver function tests, infusional fever, mucositis, bleeding tendencies, thrombocytopenia, electrolyte abnormalities, proteinuria and elevated BUN/creatinine [23]. There was no systematic investigation of these toxicities. The type and amount of supportive care these patients received are not clear. Hemorrhage was a rare but potentially severe complication and in one early study bleeding accounted for 3 deaths out of 84 patients treated [24]. A review of mithramycin use suggested that bleeding occurred early in treatment, at about day 4, and was dose related occurring in 5.4% of 1150 patients treated at 30 μg/kg/day or less [23]. It is notable that several responses were reported in patients with Ewing sarcoma receiving a dose of 25 μg/kg/day as an 8–24 h infusion for 5–7 days [19]. Mithramycin was previously approved for the treatment of hypercalcemia at a dose of 25 μg/kg over 6 h which could be repeated every 24–48 h [25, 26]. An assay with the requisite sensitivity was not available at the time these studies were performed; therefore, pharmacokinetic (PK) data, including the relationship between drug levels and response, were not available at the time we initiated our clinical trial. A sensitive assay for quantification of mithramycin has recently been developed [27].
We conducted a phase I/II trial to determine the dose-limiting toxicities (DLT), maximum tolerated dose (MTD), and pharmacokinetics (PK) of mithramycin in children with refractory solid tumors, and the activity in children and adults with refractory Ewing sarcoma.
Patients and methods
Patient population
Patients ≥12 months ≤17 years of age with evaluable refractory or recurrent extracranial solid tumors (phase 1) or >18 years of age with refractory, histologically confirmed Ewing sarcoma with documented EWS–FLI1 translocation and measurable disease (phase 2) were eligible. After determination of the recommended phase II dose for children, the phase II Ewing sarcoma cohort was to be expanded to include children ≥12 months ≤17. Other eligibility criteria included recovery from acute toxic effects of prior therapy, Karnofsky/Lansky performance score ≥50% or ECOG 1 or 2 (adults); interval from prior therapy ≥21 days for myelosuppressive chemotherapy or monoclonal antibody treatment; ≥7 days for hematopoietic growth factors; ≥2 weeks for local palliative radiation; ≥3 months from total body, craniospinal, or ≥50% radiation to the pelvis; ≥6 weeks from other substantial bone marrow radiation; ≥3 months from a stem cell transplant or rescue; and no evidence of active graft versus host disease; adequate renal function [age-adjusted normal serum creatinine, or GFR ≥70 mL/min/1.73m2]; and adequate liver function (total bilirubin ≤1.5 × institutional upper limit of normal (ULN), albumin ≥2 g/dL, and alanine aminotransferase (ALT) ≤110 U/L). Adequate bone marrow function was required and defined as an absolute neutrophil count (ANC) ≥1000/μL and hemoglobin ≥8.0 g/dL and transfusion independent platelet count of ≥75,000/μL.
This trial (NCT01610570) was approved by the NCI Institutional Review Board. All patients or their legal guardians signed a document of informed consent indicating their understanding of the investigational nature and risks of this study. Assent was obtained according to institutional guidelines.
Drug administration and study design
Mithramycin was manufactured and supplied by Fermentek Ltd (Jerusalem, Israel) to the NCI under an IND held by the Center for Cancer Research (NCI, Bethesda, MD). The NIH Clinical Center Pharmacy tested and vialed the drug. The initial starting dose for the phase II portion of the trial was the previously recommended dose of 25 μg/kg/day over 6-h iv infusion daily for 7 days. The planned initial dose level for the phase I portion of the trial was 17.5 μg/kg/day. The planned cycle duration was 28 days. A traditional 3 + 3 phase I dose-escalation scheme was used. Intra-patient dose escalation was not permitted.
Toxicity assessment and disease evaluations
Monitoring for mithramycin-related toxicity included physical examination with blood pressure measurement daily during drug administration as well as daily complete blood count (CBC) with differential; serum chemistries including electrolytes, calcium, phosphate, magnesium, creatinine, glucose, BUN, albumin, AST, ALT, total bilirubin, LDH, and total protein from day 2 through day 7 of mithramycin administration; then twice weekly during cycles 1–3. Due to reports of excessive bleeding in previous studies, coagulation studies including PT, PTT, thrombin time, and fibrinogen were preformed prior to mithramycin administration and then on days 3, 4 or 5, and days 7, 8, or 9 of every cycle. Urinalysis was performed prior to every cycle and a pregnancy test was performed prior to every cycle for women of child-bearing age. Adverse events were graded according to the Common Terminology Criteria for Adverse Events (CTCAE) version 4.0.
Response was evaluated using Response Criteria in Solid Tumors guideline version 1.1 [28] at baseline and after every even numbered treatment cycle.
Definition of DLT and MTD
Hematologic DLT was defined as any grade 4 neutropenia (<500/μL) or thrombocytopenia (<25,000/μL) refractory to platelet transfusion, any grade 2 bleeding not promptly (within 6 h of appropriate intervention) corrected with blood product support. Non-hematologic DLTs were any mithramycin-related grade ≥3 toxicity with the exception of grade 3 nausea, vomiting, or diarrhea that was controlled by symptomatic treatment within 72 h, asymptomatic grade 3 elevation of serum transaminases that return to ≤grade 1 within 14 days of completing mithramycin administration, and asymptomatic electrolyte abnormalities that are correctable to grade 2 or less within 48 h.
Patients were considered fully evaluable for toxicity and determination of MTD provided they developed a DLT anytime during cycle 1 or did not develop a DLT and received at least 85% of the planned mithramycin dose during cycle 1.
Pharmacokinetics
Pharmacokinetic (PK) sampling of mithramycin was planned for pediatric patients enrolled on the phase I portion of the study. However, after dose-limiting hepatotoxicity was observed in the first two adult patients, PK analysis was sub-sequently performed prior to and at the completion of the first dose of mithramycin during cycle 1 on both the phase I and phase II portions of the trial in consenting patients. Additionally, trough and end of infusion samples were obtained with the day 2, 4, and 7 doses and 24 h after the day 7 dose of mithramycin. Mithramycin plasma concentrations were measured using a high-performance liquid chromatography tandem mass spectroscopic (HPLC/MS-MS) method with an assay range of 0.5–500 ng/mL that has been previously described [27].
All PK analyses were performed using Phoenix 6.3 with WinNonlin noncompartmental analysis (NCA) to calculate PK parameters such as the maximum plasma concentration (CMAX), area under the curve extrapolated to infinity (AUCINF; day 1 dose only) and AUC for the dosing interval (AUCTAU), clearance at steady state (CLSS), half-life (HL), and volume of distribution at steady state (VSS). All statistical analyses were performed and graphs created using Microsoft Excel v2010 and GraphPad Prism v6 (GraphPad Software, San Diego, CA).
Evaluation of NROB1 expression in tumor biopsies
We planned to obtain biopsies prior to treatment and on day 4 (±1 day) during cycle 1 of mithramycin in adult patients (≥18 years) who have disease that could be safely biopsied percutaneously. However, none of the adult patients on this study had disease that was deemed accessible.
Results
Patient characteristics
Two patients with Ewing sarcoma enrolled on the phase I portion, and six patients enrolled on the phase II portion from July 2012 through March 2014, all were eligible and evaluable for toxicity. Table 1 shows characteristics of the eight eligible patients.
Table 1.
Baseline and on study patient characteristics
| Pt. no | Phase | Dose (mcg/kg) | Age (year) | Sex (F, M) | BSA (m2) | PS (%) | Prior chemotherapy regimens | Dose-limiting toxicities event grade cycle (CTCv4) (N) | Number of cycles (N) | ||
|---|---|---|---|---|---|---|---|---|---|---|---|
| 1 | 2 | 25/17.5 | 35.9 | M | 1.95 | 90 | 3 | AST/ALT elevation | 4 | 1 | 2 |
| 2 | 2 | 25/17.5 | 24.0 | F | 1.69 | 90 | 4 | AST/ALT elevation | 4 | 1 | 2 |
| 3 | 2 | 17.5/13 | 19.3 | M | 1.76 | 90 | 6 | AST/ALT elevation | 3/4 | 1/2 | 4 |
| 4 | 1 | 13 | 12 | M | 1.24 | 100 | 3 | – | – | – | 2 |
| 5 | 2 | 17.5 | 22.11 | F | 1.45 | 80 | 3 | – | – | – | 2 |
| 6 | 1 | 13 | 13 | M | 1.57 | 90 | 2 | – | – | – | 1 |
| 7 | 2 | 17.5 | 21 | F | 1.66 | 90 | 5 | – | – | – | 2 |
| 8 | 2 | 17.5 | 21 | M | 1.94 | 90 | 4 | – | – | – | 2 |
PS performance score: Karnofsky if ≥16 years old, Lansky if <16 years old; BSA body surface area
Toxicity and MTD
Two adult patients with Ewing sarcoma were initially enrolled on the phase II portion of the study at a dose of 25 μg/kg/dose. Both patients developed dose-limiting hepatotoxicity after two doses of mithramycin with asymptomatic grade 4 elevation of aspartate aminotransferase (AST) and alanine aminotransferase (ALT) peaking between 2000 and 10,000 U/L (Fig. 1). This was accompanied by mild gamma-glutamy1 transferase (GGT) elevation in one patient and lactate dehydrogenase (LDH) elevation in both patients. Bilirubin remained normal and hepatic synthetic function was minimally abnormal transiently. Both patients also had fever and nausea but no other new symptoms. Mithramycin was held after the day 2 dose for both patients and AST and ALT returned to baseline levels within 26 days of holding the drug. These patients received mithramycin after recovery from toxicity at a reduced dose of 17.5 μg/kg/dose with dexamethasone prophylaxis as described below and did not experience a subsequent DLT.
Fig. 1.
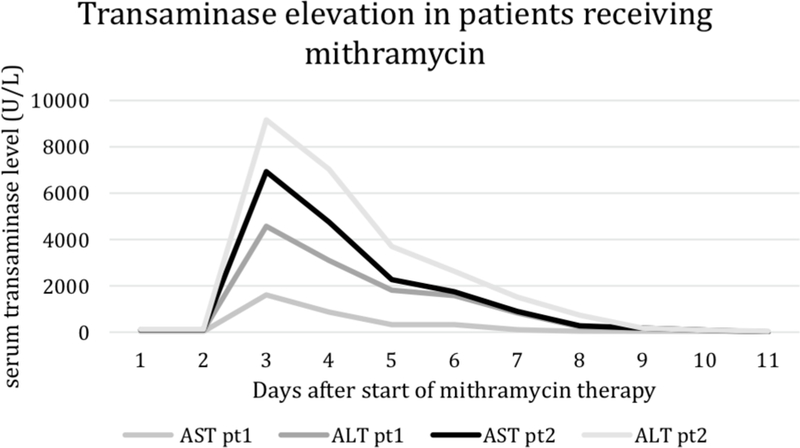
Alanine aminotransferase (ALT) and aspartate aminotransferase (AST) levels during cycle 1 of the initial two adult patients enrolled on the phase II portion of the study at a mithramycin dose of 25 μg/kg/dose. Both patients developed dose-limiting hepatotoxicity after two doses of mithramycin with AST and ALT peaking between 2000 and 10,000 U/L
Because of the hepatotoxicity seen in the initial two patients, the starting dose for the adult phase II component of the trial was decreased to 17.5 μg/kg/day for 7 days, and the starting dose for the pediatric phase I portion of the trial to 13 μg/kg/dose daily for 7 days. In addition, all subsequent patients on the trial received pretreatment with dexamethasone (2.5 mg/m2) every 12 h starting 12 h before the first dose and continuing until 24 h the final dose of mithramycin.
Four adult patients received a dose of 17.5 μg/kg/dose for 7 days on the phase II portion of the trial with concomitant dexamethasone and all four completed the initial seven-day course of mithramycin without experiencing DLT. One adult patient experienced grade 3 transaminase elevation with cycle 1 and then developed grade 4 transaminase elevation following the fourth dose of cycle 2. The mithramycin dose for this patient was reduced to 13 μg/kg/dose for cycles 3 and 4. Two pediatric patients received a dose of 13 μg/kg/day for 7 days on the phase I portion of the trial without experiencing DLT. The most frequent toxicities included increased ALT (8/8 patients), increased AST (8/8 patients), and decreased lymphocytes (8/8 patients) (Table 2).
Table 2.
Number of patients with possibly, probably, or definitively mithramycin related toxicities (dose-limiting and non-dose-limiting, highest grade/patient) during cycle 1
| Dose level (mg/m2/dose) | 13 (n = 2) |
17.5 (n = 4) |
25 (n = 2) |
|||||||||
|---|---|---|---|---|---|---|---|---|---|---|---|---|
| Toxicity grade CTCAEv4 | 1 | 2 | 3 | 4 | 1 | 2 | 3 | 4 | 1 | 2 | 3 | 4 |
| Gastrointestinal toxicity | ||||||||||||
| Nausea | 2 | 1 | ||||||||||
| Sore throat | 1 | |||||||||||
| Hepatic toxicity | ||||||||||||
| AST ↑ | 1 | 1 | 1 | 1 | 2 | 2 | ||||||
| ALT ↑ | 1 | 1 | 1 | 1 | 2 | 2 | ||||||
| Metabolic/laboratory | ||||||||||||
| toxicity | ||||||||||||
| Albumin ↓ | 1 | 1 | 1 | |||||||||
| Calcium ↓ | 2 | 1 | ||||||||||
| Magnesium ↑ | 2 | 1 | 2 | |||||||||
| Glucose ↑ | 2 | 1 | 1 | |||||||||
| Phosphorus ↓ | 1 | 1 | 1 | |||||||||
| Potassium ↑ | 1 | 1 | ||||||||||
| Constitutional toxicity | ||||||||||||
| Fatigue | 1 | 2 | 1 | |||||||||
| Fever | 2 | |||||||||||
| Hematologic toxicity | ||||||||||||
| White blood cell ↓ | 1 | 1 | 2 | 1 | 1 | |||||||
| Neutrophil count ↓ | 1 | 1 | 1 | |||||||||
| Lymphocyte count ↓ | 2 | 4 | 1 | 1 | ||||||||
| Anemia | 2 | 2 | 1 | |||||||||
| Platelets ↓ | 2 | 2 | ||||||||||
| aPTT ↑ | 1 | |||||||||||
| PT ↑ | 2 | |||||||||||
| Neurologic toxicity | ||||||||||||
| Headache | 1 | 2 | ||||||||||
| Dizziness | 2 | |||||||||||
| Pain | ||||||||||||
| Back pain | 1 | |||||||||||
| Extremity pain | 1 | 2 | ||||||||||
| Pain (other) | 3 | |||||||||||
| Vascular disorders | ||||||||||||
| Flushing | 1 | 1 | ||||||||||
| Renal/genitourinary | ||||||||||||
| toxicity | ||||||||||||
| Proteinuria | 1 | |||||||||||
Pharmacokinetics
Four patients had pharmacokinetic sampling during mithramycin administration. Figure 2 shows the mean plasma concentration–time profiles for patients studied at 13 μg/kg/dose (n = 2) and 17.5 μg/kg/dose (n = 2) levels. There was negligible accumulation with repeated daily doses. Because of the low number of patients in each group, statistical differences between the two dose levels (13 and 17.5 μg/kg/dose) could not be determined. However, plasma concentrations and the resulting PK parameters were comparable between both dose groups and were combined as one group (Table 3). The half-life was approximately 6–8 h with maximum plasma concentration achieved (CMAX) of 15–20 ng/mL (14–18 nmol/L).
Fig. 2.
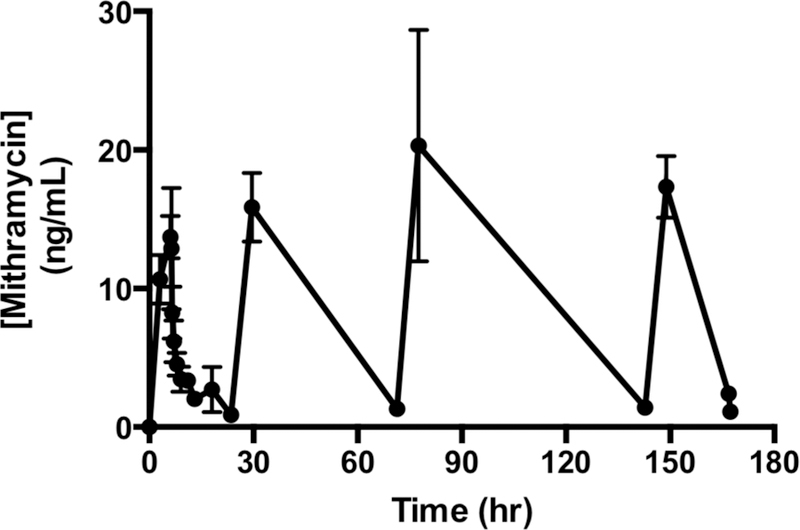
Mean (standard deviation) plasma mithramycin concentrations vs time during cycle 1 for patients 4, 5, 6, and 7
Table 3.
Summary of pharmacokinetic data for cycle 1 of mithramycin, patients 4, 5, 6, and 7
| Mean (±SD) (n = 4) | |
|---|---|
| 17.8 ± 4.6 | |
| AUCINF (h*ng/mL) | 1544 ± 754 |
| AUCTAU (h*ng/mL) | 394 ± 94 |
| T1/2(h) | 6.8 ± 2.3 |
| CLss (L/h) | 1.9 ± 0.8 |
| Vss (L) | 293 ± 88 |
Dose normalized parameters used absolute doses (ug), not dose level (ug/kg)
CMAX maximum plasma concentration, AUCINF area under the plasma concentration vs time curve extrapolated to infinity during the C1D1 dose, AUCTAU AUC over a dosing interval, T1/2 (half-life), CLss clearance at steady state, Vss volume of distribution at steady state
Response
Of eight patients enrolled on the study, six received two abbreviated or completed cycles of mithramycin, one patient received one cycle and one patient received four cycles prior to experiencing progressive disease. No complete or partial responses were achieved in these patients.
Discussion
In a high throughput screen, we identified mithramycin as a potent inhibitor of EWS–FLI1. This finding and prior clinical data indicating responsiveness in other cancers and in particular in a patient with Ewing sarcoma prompted the clinical development of mithramycin for Ewing sarcoma. The goal of this study was to determine the phase II dose of mithramycin in children and assess the activity of mithramycin in children and adults with Ewing sarcoma.
The previously reported phase II dose of 25 μg/kg/dose IV over 6 h daily for 7 days to be repeated every 28 days was not tolerated. Early onset (day 2) of asymptomatic grade 4 AST/ALT elevation was the only observed DLT and precluded administration for 7 days. Prior trials have reported hepatotoxicity with mithramycin administration. However, transaminase elevation was not consistently observed [23]. Of note, hepatic failure resulting in death after mithramycin has been reported [29]. Following dose reduction and the addition of dexamethasone, mithramycin was better tolerated, with only mild AST/ALT elevation in seven of eight patients. One adult patient developed grade 4 transaminitis with the second cycle of mithramycin at a dose of 17.5 μg/kg/dose. While hemorrhage was reported as a severe complication of earlier trials of mithramycin, possibly due to thrombocytopenia, we did not observe any bleeding and only mild myelosuppression.
Drug-induced liver injury (DILI) is a common dose-limiting toxicity in the evaluation of new pharmaceuticals. We explored the correlation of mithramycin-induced hepatotoxicity with single nucleotide polymorphisms (SNP) in several genes encoding transporter proteins regulating bile flow (Figg and colleagues, manuscript in preparation). Further analysis of mithramycin-induced hepatic toxicity may identify subpopulations of patients that could better tolerate this therapy.
Pharmacokinetic analysis was an important component of this study, and resulted in the first in human PK data with a sensitive and specific assay. This analysis demonstrated a maximal mithramycin concentration (CMAX) of 14–18 nmol/L, a biphasic elimination following cessation of infusion that is consistent with a previous PK study [30] and a terminal half-life of approximately 6–8 h.
Our preclinical data suggest that significant suppression of EWS–FLI1 transcription is not achieved until concentrations of 50–100 nM are reached and sustained for between 8 and 18 h. The pharmacokinetic analysis from the four patients on the trial indicates that a concentration of mithramycin that would be expected to suppress EWS–FLI1 to achieve a clinical response was not attained with this dosing regimen. Responses in two patients with metastatic Ewing sarcoma were reported in 1973 [19]. These patients were treated at a dose of 25 μg/kg/day delivered over 8–24 h, but were able to tolerate longer courses of treatment (5 and 10 days) compared to patients on this trial. Neither serum transaminase or bilirubin values were reported for these patients. Due to our inability to safely escalate mithramycin, we closed our trial to enrollment.
In contrast to the patients in the current study, liver toxicity was not seen in preclinical murine studies. Serum levels of 385 nmol/L were achieved in mouse models [18] well above the 50–100 nmol/L required to suppress EWS–FLI1 activity. More recently, we have found that other species such as the rat experience mithramycin-associated hepatotoxicity similar to that seen in humans. Alternative routes or schedules of administration may improve the therapeutic index of mithramycin in Ewing sarcoma patients.
This study represents the first systematic study of mithramycin in children and the first study of the PK of mithramycin. Overall, mithramycin was well tolerated with the exception of the significant hepatic toxicity. Interestingly, the same effect was seen with trabectedin another compound linked to the suppression of EWS–FLI1 [18]. As is the case with mithramycin, the transaminitis associated with trabectedin is mitigated by pretreatment with dexamethasone [31]. Variation in the bile salt export pump (BSEP) may cause specific populations to be more susceptible to this drug toxicity. A better understanding of the mechanisms of mithramycin-induced hepatotoxicity as well as the effect of dexamethasone in blunting this effect will be critical for the further clinical development of this class of drugs.
Finally, this study highlights the need for the evaluation of target suppression in patients. We have ongoing efforts aimed at developing these correlative biomarkers for Ewing sarcoma [32]. The study was opened with the goal of obtaining tissue biopsies before and after drug treatment in adult patients with accessible disease. Unfortunately, none of the patients in this study had disease that was deemed accessible. Therefore, we must infer the lack of target suppression based on the previously discussed low serum levels of mithramycin and lack of response. However, a definitive answer to this question would aid in future development efforts for this class of compounds. Indeed, these data would help guide the selection of second-generation mithramycin analogs that offer the hope of therapeutic suppression of EWS–FLI1 based on an improved toxicity profile [18].
Acknowledgements
We thank the patients and their families who participated in this trial, Linda Ellison-Dejewski for research nursing support, Natasha Brunson for assistance with data management. Dr. Seth Steinberg for assistance with the statistical design of the study, and Jeff Roth for technical support in the performance of pharmacokinetic assays.
This work was supported in part by the Intramural Research Program of the Center for Cancer Research National Cancer Institute National Institutes of Health.
Footnotes
Compliance with ethical standards
Conflict of interest The authors declare that they have no conflicts of interest relating to this study.
Ethical approval All procedures performed in studies involving human participants were in accordance with the ethical standards of the institutional and/or national research committee and with the 1964 Helsinki Declaration and its later amendments or comparable ethical standards.
Informed consent Informed consent was obtained from all individual participants included in the study.
References
- 1.Esiashvili N, Goodman M, Marcus RB Jr (2008) Changes in incidence and survival of Ewing sarcoma patients over the past 3 decades: surveillance epidemiology and end results data. J Pediatr Hematol Oncol 30:425–130. 10.1097/MPH.0b013e31816e22f3 [DOI] [PubMed] [Google Scholar]
- 2.Gaspar N et al. (2015) Ewing sarcoma: current management and future approaches through collaboration. J Clin Oncol 33:3036–3046. 10.1200/JCO.2014.59.5256 [DOI] [PubMed] [Google Scholar]
- 3.Womer RB et al. (2012) Randomized controlled trial of interval-compressed chemotherapy for the treatment of localized Ewing sarcoma: a report from the Children’s Oncology Group. J Clin Oncol 30:4148–1154. 10.1200/JCO.2011.41.5703 [DOI] [PMC free article] [PubMed] [Google Scholar]
- 4.Delattre O et al. (1994) The Ewing family of tumors—a subgroup of small-round-cell tumors defined by specific chimeric transcripts. N Engl J Med 331:294–299. 10.1056/NEJM199408043310503 [DOI] [PubMed] [Google Scholar]
- 5.Delattre O et al. (1992) Gene fusion with an ETS DNA-binding domain caused by chromosome translocation in human tumours. Nature 359:162–165. 10.1038/359162a0 [DOI] [PubMed] [Google Scholar]
- 6.Bailly RA et al. (1994) DNA-binding and transcriptional activation properties of the EWS–FLI-1 fusion protein resulting from the t(11;22) translocation in Ewing sarcoma. Mol Cell Biol 14:3230–3241 [DOI] [PMC free article] [PubMed] [Google Scholar]
- 7.Kauer M et al. (2009) A molecular function map of Ewing’s sarcoma. PLoS One 4:e5415 10.1371/journal.pone.0005415 [DOI] [PMC free article] [PubMed] [Google Scholar]
- 8.Riggi N et al. (2014) EWS–FLI1 utilizes divergent chromatin remodeling mechanisms to directly activate or repress enhancer elements in Ewing sarcoma. Cancer Cell 26:668–681. 10.1016/j.ccell.2014.10.004 [DOI] [PMC free article] [PubMed] [Google Scholar]
- 9.Gangwal K et al. (2008) Microsatellites as EWS/FLI response elements in Ewing’s sarcoma. Proc Natl Acad Sci USA 105:10149–10154. 10.1073/pnas.0801073105 [DOI] [PMC free article] [PubMed] [Google Scholar]
- 10.Riggi N, Stamenkovic I (2007) The biology of Ewing sarcoma. Cancer Lett 254:1–10. 10.1016/j.canlet2006.12.009 [DOI] [PubMed] [Google Scholar]
- 11.Hu-Lieskovan S et al. (2005) EWS–FLI1 fusion protein up-regulates critical genes in neural crest development and is responsible for the observed phenotype of Ewing’s family of tumors. Cancer Res 65:4633–4644. 10.1158/0008-5472.CAN-04-2857 [DOI] [PubMed] [Google Scholar]
- 12.May WA et al. (1997) EWS/FLI1-induced manic fringe renders NIH 3T3 cells tumorigenic. Nat Genet 17:495–197. 10.1038/ng1297-495 [DOI] [PubMed] [Google Scholar]
- 13.Maksimenko A, Malvy C (2005) Oncogene-targeted antisense oligonucleotides for the treatment of Ewing sarcoma. Expert Opin Ther Targets 9:825–830. 10.1517/14728222.9.4.825 [DOI] [PubMed] [Google Scholar]
- 14. Grohar PJ et al. (2011) Identification of an inhibitor of the EWS–FLI1 oncogenic transcription factor by high-throughput screening. J Natl Cancer Inst 103:962–978. 10.1093/jnci/djrl56 [DOI] [PMC free article] [PubMed] [Google Scholar]
- 15.Mendiola M et al. (2006) The orphan nuclear receptor DAX1 is up-regulated by the EWS/FLI1 oncoprotein and is highly expressed in Ewing tumors. Int J Cancer 118:1381–1389. 10.1002/ijc.21578 [DOI] [PubMed] [Google Scholar]
- 16.Kinsey M, Smith R, Lessnick SL (2006) NR0B1 is required for the oncogenic phenotype mediated by EWS/FLI in Ewing’s sarcoma. Mol Cancer Res 4:851–859. 10.1158/1541-7786.MCR-06-0090 [DOI] [PubMed] [Google Scholar]
- 17.Nishimori H et al. (2002) The Id2 gene is a novel target of transcriptional activation by EWS–ETS fusion proteins in Ewing family tumors. Oncogene 21:8302–8309. 10.1038/sj.one.1206025 [DOI] [PubMed] [Google Scholar]
- 18.Osgood CL et al. (2016) Identification of mithramycin analogues with improved targeting of the EWS–FLI1 transcription factor. Clin Cancer Res 22:4105–1118. 10.1158/1078-0432.CCR-15-2624 [DOI] [PMC free article] [PubMed] [Google Scholar]
- 19.Kofman S, Perlia CP, Economou SG (1973) Mithramycin in the treatment of metastatic Ewing’s sarcoma. Cancer 31:889–893 [DOI] [PubMed] [Google Scholar]
- 20.Kennedy BJ, Torkelson JL (1995) Long-term follow-up of stage III testicular carcinoma treated with mithramycin (plicamycin). Med Pediatr Oncol 24:327–328 [DOI] [PubMed] [Google Scholar]
- 21.Curreri AR, Ansfield FJ (1960) Mithramycin-human toxicology and preliminary therapeutic investigation. Cancer Chemother Rep 8:18–22 [PubMed] [Google Scholar]
- 22.Spear PW (1963) Clinical trial with mithramycin. Cancer Chemother Rep 29:109–110 [PubMed] [Google Scholar]
- 23.Mithramycin (mithracin) (1971) For intravenous use. Clin Pharmacol Ther 12:310–313 [PubMed] [Google Scholar]
- 24.Kofman S, Eisenstein R (1963) Mithramycin in the treatment of disseminated cancer. Cancer Chemother Rep 32:77–96 [PubMed] [Google Scholar]
- 25.Bilezikian JP (1992) Management of acute hypercalcemia. N Engl J Med 326:1196–1203. 10.1056/NEJM199204303261806 [DOI] [PubMed] [Google Scholar]
- 26.Perlia CP et al. (1970) Mithramycin treatment of hypercalcemia. Cancer 25:389–394 [DOI] [PubMed] [Google Scholar]
- 27.Roth J et al. (2014) Quantitative determination of mithramycin in human plasma by a novel, sensitive ultra-HPLC-MS/MS method for clinical pharmacokinetic application. J Chromatogr B Analyt Technol Biomed Life Sci 970:95–101. 10.1016/j.jchromb.2014.08.021 [DOI] [PMC free article] [PubMed] [Google Scholar]
- 28.Eisenhauer EA et al. (2009) New response evaluation criteria in solid tumours: revised RECIST guideline (version 1.1). Eur J Cancer 45:228–247. 10.1016/j.ejca.2008.10.026 [DOI] [PubMed] [Google Scholar]
- 29.Fraisse F, Marche C, Gibert C, Coquin Y, Vachon F (1980) Acute hepatic necrosis and hemorrhagic syndrome leading to a fatal outcome during treatment of hypercalcemia with mithramycin (author’s transl). Ann Med Interne (Paris) 131:281–284 [PubMed] [Google Scholar]
- 30.Fang K et al. (1992) Determination of plicamycin in plasma by radioimmunoassay. TherDrug Monit 14:255–260 [DOI] [PubMed] [Google Scholar]
- 31.Grosso F et al. (2006) Steroid premedication markedly reduces liver and bone marrow toxicity of trabectedin in advanced sarcoma. Eur J Cancer 42:1484–1490. 10.1016/j.ejca.2006.02.010 [DOI] [PubMed] [Google Scholar]
- 32.Osgood CL et al. (2016) 18F-FLT positron emission tomography (PET) is a pharmacodynamic marker for EWS–FLI1 activity and Ewing sarcoma. Sci Rep 6:33926 10.1038/srep33926 [DOI] [PMC free article] [PubMed] [Google Scholar]