

Introduction
Vitamin D (vitamin D2 and vitamin D3) derived from sunlight exposure, diet or supplementation are converted to vitamin D2 (calciferol) and vitamin D3 (cholecalciferol) (25 (OH) D3) by vitamin D-25 hydroxylase (CYP2R1) in the liver, and subsequently converted to the biologically active 1,25-dihydroxyvitamin D2 and 1,25-dihydroxyvitamin D3 (25 (OH)2 D3) by CYP27B1 in the kidney and other tissue1,2. Circulating total concentrations of vitamin D3 but not concentrations of active 1,25-dihydroxyvitamin D3 are used to define vitamin D status in part because of differences in total concentrations and half-life between the two metabolites1. For the skeletal actions of vitamin D serum concentrations of vitamin D3 ≥ 30 ng/ml defines vitamin D sufficiency whereas concentrations < 30 ng/ml are insufficient and levels < 20 ng/ml are deficient 1,3. Guidelines recommend higher serum concentrations for the extra-skeletal, pleiotropic actions of vitamin D in the range of 30–50 ng/ml2. However, the use of serum concentrations of vitamin D3 as a biomarker of vitamin D status has been questioned owing to uncertainties in methods of measuring total concentrations of vitamin D34.
Serum concentrations of vitamin D3 are tightly bound (~85%) to vitamin D binding protein (VDBP) and loosely bound to albumin (~15%) with < 1% in the unbound or free form 5,6. The role VDBP plays in promoting bone health and in regulating extra-skeletal function is controversial. Vitamin D3 bound to VDBP can bind to megalin, a transmembrane receptor located in the kidney and other tissue, undergo internalization through endocytosis, and be metabolized to1,25-dihydroxyvitamin D3 in proximal tubular cells7. Alternatively, the free hormone hypothesis predicts that only free concentrations of vitamin D3 diffuse across the cell membrane and undergo metabolism to 1,25-dihydroxyvitamin D3 which activates the vitamin D receptor6,8. Consequently free vitamin D3 concentrations are considered better markers of vitamin D status than total serum concentrations. Indeed several recent studies report that bone density and markers of bone turnover, as well as atopy and lung function in children with asthma are better correlated with bioavailable (free vitamin D3 + bound to albumin) or with calculated or directly measured free vitamin D3 concentrations than to total vitamin D3 concentrations9–13.
The free hormone hypothesis also predicts that inter-patient variability in VDBP concentrations influence total concentrations and the unbound fraction of vitamin D3 in serum and have little effect on free concentrations6,8. Several factors including diseases, pregnancy, obesity and genetic variation14;15 influence serum concentrations of VDBP and therefore contribute to the variability in serum concentrations of vitamin D3. Variation in the GC gene encodes different VDBP isoforms: Gc1F, Gc1S and Gc2, which have different binding affinities for vitamin D16. Specific genetic variants in GC show significant differences in allele frequencies between different ancestral populations that may contribute to lower VDBP concentrations and lower total vitamin D3 concentrations in ethnic populations with a significant African ancestry (i.e. African Americans and some Hispanic ethnic groups) compared to European Americans 10,17,18.
Hypovitaminosis D has been associated with increased risk of asthma, reduced lung function, increased airway responsiveness, asthma exacerbations and reduced responsiveness to glucocorticoids in children and adults with asthma19–24. We published a randomized, double-masked, placebo-controlled multi-center trial of vitamin D3 supplementation in vitamin D3-insufficient participants (total serum vitamin D3 concentrations < 30 ng/ml) with persistent asthma taking inhaled corticosteroids25. The objective of the VIDA Trial was to determine if vitamin D supplementation improves the clinical efficacy of inhaled corticosteroids. We found that vitamin D supplementation did not reduce the rates of first treatment failure or exacerbation. However, for those participants who achieved vitamin D sufficiency, i.e., serum concentrations ≥ 30 ng/ml (82%) overall rates of treatment failure and exacerbations were lower compared to placebo, thus supporting the notion that vitamin D supplementation may improve the efficacy of inhaled corticosteroids. The objective of the present VIDA analysis was to determine associations between free vitamin D3 concentrations and treatment failure while reducing ICS in VIDA participants.
Methods
Study Design.
Details of the VIDA trial design are published25. Briefly, 408 vitamin D insufficient adults (serum levels < 30 ng/ml at baseline) with asthma were randomly assigned to receive either placebo (N=207) or a single oral dose of vitamin D3,100,000 IU followed by 4000 IU daily (Cholecalciferol, BioTech Pharmacal; N=201) added to inhaled ciclesonide, 320 µg daily and levalbuterol as needed. This initial phase of 12 weeks was followed by a reduction in the ciclesonide dose by 50% if the participant’s symptoms were well-controlled. Adherence to dosing with ciclesonide and vitamin D was monitored electronically as described25. Blood for vitamin D3 determination was drawn from each participant at baseline and at 12 (visit 6), 20 (visit 8) and 28 (visit 10) weeks after baseline. The present study explored associations between free concentrations of vitamin D3 and outcomes in 200 participants assigned to receive active vitamin D3 supplement. Free concentrations of vitamin D3 were not measured in participants taking placebo.
Quantification of free vitamin D3 Concentrations and Binding to Serum Proteins.
Free or unbound concentrations (Cf) of vitamin D3 in serum were quantified by ELISA (Free 25OH Vitamin D ELISA; Future Diagnostic Solutions; DIAsource ImmunoAssays®; Belgium) https://www.alpco.com/pdfs/38/38-KARF1991.pdf 26,27. Total serum concentrations (Ctot) of vitamin D3, which is the sum of Cf + the concentration bound to serum proteins (Cb), were quantified using the DiaSorin LIAISON vitamin D assay as previously described25. The free fraction of vitamin D3 (fu) in serum was calculated as: fu = Cf/Ctot. The bound fraction of vitamin D3 in serum (fb) is 1-fu and the percent of vitamin D3 unbound and bound to serum proteins are fu * 100 and fb * 100, respectively. VDBP concentrations were not quantified in the VIDA study.
Outcome measures.
Outcome measures in the present study included treatment failure, which was defined as previously described and included changes in peak expiratory flow, FEV 1 < 80% of baseline, increase in levalbuterol dose; addition of inhaled corticosteroid or oral or parenteral corticosteroids, and emergency department or hospitalization for asthma with corticosteroid use. Other outcomes included asthma exacerbations which were defined as failure to respond to a rescue algorithm, and FEV1 <50% of baseline25.
Statistical Analyses.
The relationship between free and total concentrations of vitamin D3 was evaluated with the Pearson correlation coefficient and corresponding 95% confidence interval. Analysis of variance (ANOVA) was used to compare free, total and the free fraction of vitamin D3 between racial and ethnic groups, genders, and BMI groups, as well as to compare free levels and change in free levels between those who achieved and did not achieve vitamin D3 sufficiency as defined by change in total concentrations after 12 weeks of supplementation. The association between free concentrations of vitamin D3 and time to first treatment failure was evaluated with Kaplan-Meier survival curves and the logrank test. An additional analysis was performed to evaluate this association allowing for multiple events per person, which was performed using Poisson regression with adjustment for clinical center, BMI, and race, and reported in terms of event rate per person-year. Time to first exacerbation and total exacerbations were analyzed according to the same approaches as treatment failures. Statistical significance was determined as p<0.05.
Results
Baseline vitamin D3 concentrations and serum protein binding, The mean (SD) Cf, Ctot and fu of vitamin D3 in serum at baseline were 4.73 (1.54) pg/ml, 19.4 (6.57) ng/ml and 2.57 × 10⁻⁴ (8.0*10–5), respectively, indicating that on average 0.03% and 99.97% of vitamin D3 respectively, were free and bound to serum proteins (VDBP and albumin). Figure 1 shows that vitamin D3 Cf and Ctot are highly correlated (r = 0.77, 95%CI (0.71, 0.82)). Table 1 compares free vitamin D3 concentrations and serum protein binding by race, sex and BMI. Compared to non-Hispanic White participants Cf of vitamin D3 was lower in African Americans and Hispanic participants. The fu of vitamin D3 in serum varied among different races and shows that the binding of vitamin D3 to serum proteins was higher among White and Hispanic participants compared to Black participants (Table 1). The mean (SD) vitamin D3 Cf and fu were higher in males compared to females: 5.08 (1.41) vs. 4.57 (1.58) pg/ml (p=0.026); and 2.82*10−4 (1.04*10−4) vs. 2.46*10−4 (0.63*10−4) (p=0.003). In addition to race/ethnicity and gender, body mass index influenced the Cf of vitamin D3. The mean (SD) Cf of vitamin D3 at baseline in participants with BMI < 25 was 5.45 (1.86) pg/ml and was higher than those with BMI > than 25, which was 4.54(1.39) pg/ml (p = 0.004). The inverse relationship between BMI and Cf at baseline is shown in Figure 2 (Rho = −0.3, 95% CI (−0.4, - 0.2); p < 0.001).
Figure 1.
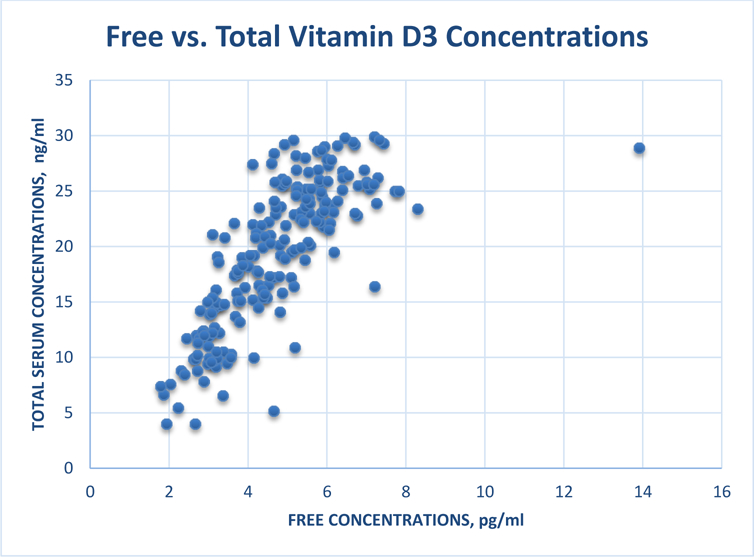
Relationship between free concentrations and total serum concentrations of vitamin D3 at baseline in VIDA participants.
Table 1.
Comparison of baseline free vitamin D3 concentrations and binding to serum proteins by race, sex and BMI in VIDA participants.
| DEMOGRAPHICS (number) | MEAN (SD) | |
|---|---|---|
| Cf, pg/ml | fu*104 | |
| Race | ||
| Black (64) | 4.10 (1.33) | 2.79 (1.14) |
| White (103) | 5.16 (1.65) | 2.49 (0.55) |
| Hispanic (19) | 4.38 (1.11) | 2.38 (0.43) |
| Overall p-value (Pair-wise p-values) | p<0.001 (<0.001 W vs B 0.038 W vs H) | p=0.031 (0.018 W vs B) |
| Sex | ||
| Female (135) | 4.57 (1.58) | 2.46 (0.63) |
| Male (65) | 5.08 (1.41) | 2.82 (1.04) |
| p-value | 0.026 | 0.003 |
| BMI | ||
| <25 (43) | 5.45 (1.86) | 2.55 (0.92) |
| >25 (157) | 4.54 (1.39) | 2.58 (0.77) |
| p-value | <0.001 | 0.85 |
Figure 2.
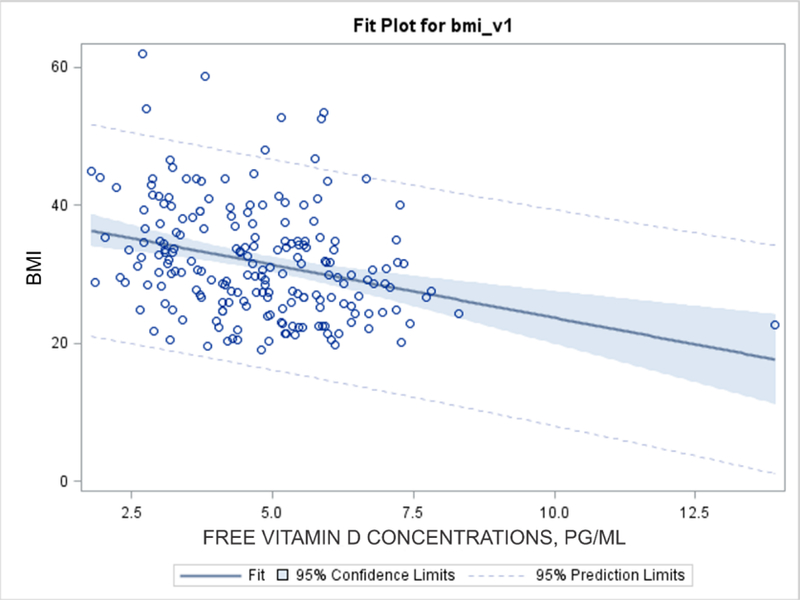
Relationship between body mass index (BMI) and free concentrations of vitamin D3 at baseline in VIDA participants.
Free vitamin D3 concentrations and binding to serum proteins after supplementation. The Cf of vitamin D3 increased from baseline and reached a plateau in most participants by visit 6 (12 weeks) following the administration of loading and maintenance doses of vitamin D3 (Figure 3). The mean (SD) Cf increased from 4.73 (1.54) pg/ml at baseline to 10.4 (3.13), 11.1 (3.53) and 10.8 (3.37) pg/ml at visits 6, 8 (20 weeks) and 10 (28 weeks), respectively, representing fold-changes in Cf of 2.2 – 2.3 over baseline. We focused our analyses on V6 (12 weeks after dose administration) because Cf and the change in Cf at V6 were not different than those at V8 and V10, thus following the same approach as in the original analyses25. There was substantial variability in Cf at baseline and at visits 6, 8 and 10 (Figure 3).
Figure 3.
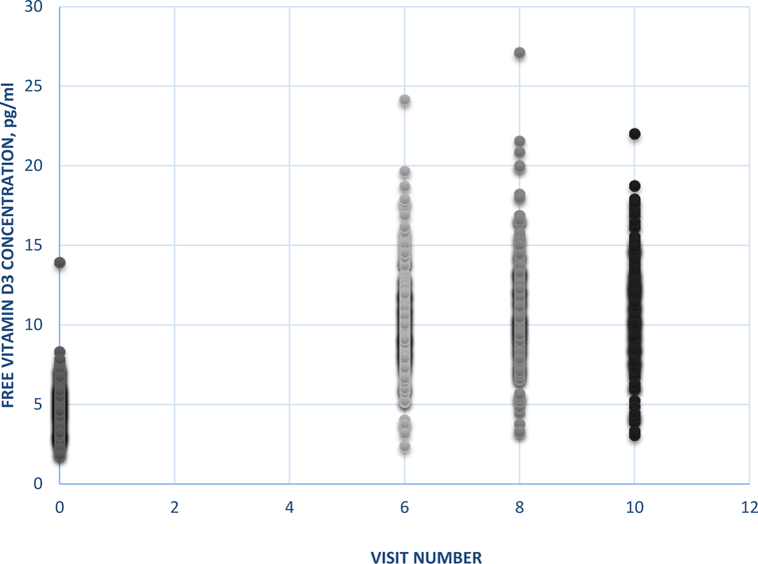
Free vitamin D3 concentrations at baseline and at visits 6, 8 and 10 following the administration of a loading and maintenance doses of vitamin D3 in VIDA participants taking vitamin D3.
As previously reported 157 of 201 participants achieved sufficiency (defined as serum concentrations (Ctot) ≥ 30 ng/ml) following 12 weeks of vitamin D3 25. Table 2 compares vitamin D3 Cf and binding between sufficient and insufficient participants. The mean vitamin D3 Cf at baseline and the mean change in Cf from baseline to 12 weeks of supplementation were lower in insufficient compared to sufficient participants, which suggests that insufficient participants were relatively resistant to supplementation. The binding of vitamin D3 to serum protein was similar between insufficient and sufficient participants at baseline (Table 2). However, following 6 weeks of supplementation the vitamin D3 percent free was 20% higher among insufficient compared to sufficient participants: 0.029% vs. 0.024% (p<0.001) (Table 2) indicating that the binding of vitamin D3 to serum protein increased in sufficient participants during supplementation.
Table 2.
Comparison of vitamin D3 free concentrations and binding to serum proteins in insufficient (serum concentrations < 30 ng/ml) and sufficient (serum concentrations ≥ 30 ng/ml) VIDA participants at baseline and following 12 weeks (visit 6) of vitamin D3 supplementation.
| MEAN (SD) PARAMETER | VITAMIN D STATUS | p value | |
|---|---|---|---|
| Ctot < 30 ng/ml (n=35) | Ctot ≥30 ng/ml (n=162) | ||
| Cf, pg/ml baseline | 4.15 (1.30) | 4.85 (1.57) | 0.016 |
| fu, baseline*10−4 | 2.78 (1.25) | 2.54 (0.67) | 0.11 |
| Cf, pg/ml visit 6 | 7.01 (2.23) | 11.1 (2.81) | <0.001 |
| Change Cf, pg/ml visit 6 | 2.86 (2.01) | 6.24 (2.81) | <0.001 |
| fu, visit 6*10−4 | 2.93 (0.59) | 2.43 (0.41) | < 0.001 |
Association between Cf and outcomes. There were no significant associations between treatment failures or exacerbations and Cf or the change in Cf from baseline to visit 6 (see table A1 in the appendix). In order to further explore the relationship between outcomes and vitamin D3 levels we stratified the participants into three groups based on Cf of vitamin D3 achieved at visit 6: low, < 9 pg/ml (N=65), medium, 9 – 12 pg/ml (N=84) and high, > 12 pg/ml (N=48). There were no significant associations between treatment outcomes and Cf (Table 3) or changes in Cf from baseline (table A1 in the appendix) in patients with asthma participating in the VIDA trial. For participants with vitamin D3 Cf < 9, 9–12 and > 12 pg/ml: overall treatment failure rates were 0.60 (95%CI 0.46–0.78), 0.53 (95%CI 0.40–0.70) and 0.69 (95%CI 0.54–0.90)/person-year (p=0.51), respectively; and the overall exacerbation rates were 0.28 (95%CI 0.17–0.48), 0.15 (95%CI 0.08–0.30) and 0.42 (95%CI 0.27–0.66)/person-year (p=0.22). We found no significant associations between time to first treatment failure or time to first exacerbation and free levels of vitamin D3, and found no significant associations between changes in FEV1 and free levels or changes in free levels (table A1 in the appendix).
Table 3.
Association analyses of outcomes in patients with asthma participating in the VIDA trial stratified by groups of free vitamin D3 concentrations 12 weeks (visit 6) following the beginning of supplementation.
| TREATMENT OUTCOMES | VITAMIN D3 Cf, pg/ml (number of participants) | p value | ||
|---|---|---|---|---|
| <9 (65) | 9 – 12 (84) | >12 (48) | ||
| Overall treatment failure rate/person-yr | 0.60 | 0.53 | 0.69 | 0.51 |
| Overall exacerbation rate/person-yr | 0.28 | 0.15 | 0.42 | 0.22 |
DISCUSSION
The primary finding of this VIDA trial analysis revealed no associations between Cf or changes in Cf and the outcomes following vitamin D3 supplementation. Overall rates of treatment failure and exacerbation tended to decrease at Cf levels 9–12 pg/ml but increased at levels > 12 pg/ml (Table 3) and none of the changes were significant. This observation is not consistent with the VIDA finding that vitamin D supplementation improved the efficacy of inhaled corticosteroids when participants achieved levels ≥ 30 ng/ml. The inconsistency between free and total level associations with response outcomes was unexpected given the predictions of the free hormone hypothesis and the strong relationship between Cf and Ctot (Figure 1). Additionally our observation does not agree with those of others reporting that free levels are better associated with skeletal markers, atopy and lung function in children with asthma compared to total levels9–13. We conclude that free concentrations of vitamin D3 were inferior to total concentrations in associating responsiveness to vitamin D supplementation in the VIDA trial. Our findings warrant further studies to explore the relationship between free vs. total vitamin D concentrations as biomarkers of skeletal and extra-skeletal actions vitamin D supplementation in patients with asthma.
Two additional findings are of major importance. First, baseline free vitamin D3 concentrations differed by race, ethnicity, sex and body size (Table 1). Several studies report that Ctot of vitamin D3 are lower among African Americans compared to non-Hispanic Whites despite having superior bone health18,28–30, which has been referred to as a paradox29. To address this paradox Powe et al.10 calculated bioavialable concentrations of vitamin D3 (Cf + vitamin D3 bound to albumin) from Ctot and VDBP concentrations and reported that bioavailable concentrations were better related to circulating parathyroid concentrations than serum concentrations (Ctot) of vitamin D3. Lower Ctot of vitamin D3 in African Americans were attributed to lower VDBP concentrations as a consequence of ancestral differences in the allele frequencies of polymorphisms in the GC gene in these individuals of African descent compared to Whites. However, these results have been questioned owing to technical problems inherent in the VDBP assay used in their studies that led to overestimation of Cf and bioavailable concentrations 31–34. More recent studies have measured Cf directly (thereby avoiding issues related to VDBP binding) in patients and reported that Cf of vitamin D3 are generally lower in African Americans depending on physiological or disease state18,26,35. For example, directly measured Cf were identical in African American and White healthy post menopausal women18 while in patients with Type 2 Diabetes 35 directly measured Cf were lower in African Americans compared to Whites. The results of our study show that Cf of vitamin D3 in African Americans with moderate asthma on ICS are lower compared to Whites at baseline (Table 1). Fitzpatrick sun-reactive skin typing and melanin index, non-laboratory techniques, can also discern vitamin D deficiency among black and white children 36. Additionally, our data show that vitamin D3 Cf in Hispanics with asthma are lower compared to Whites. There is evidence that vitamin D status may contribute to the racial and ethnic disparity of the asthma burden37. Future studies in this important area of research should evaluate vitamin D status by directly measuring Cf of vitamin D3.
In addition to race and ethnicity, BMI and sex contributed to the variability in Cf of vitamin D3 at baseline (Table 1). Previous studies have reported an inverse relationship between Ctot vitamin D3 and BMI (see (https://www.ncbi.nlm.nih.gov/books/NBK56061/) and Cf and obesity15. Ours is the first to report that Cf of vitamin D3 was lower among overweight or obese participants with asthma compared to those with BMI values < 25 (Table 1; Figure 1). Lower dietary intake of vitamin D or reduced sunlight exposure probably contributed to reduced free concentrations of vitamin D3 in overweight or obese individuals compared to non-obese individuals. Our study showed that Cf of vitamin D3 were lower in females compared to males. Interestingly, the prevalence of asthma in adults is higher in females than males38. The clinical relevance of and the mechanisms underlying the sex differences in Cf of vitamin D3 are unknown and require further investigation.
Another major finding of our study is the apparent resistance of some participants to supplementation. We found that Cf of vitamin D3 at baseline and at visit 6, and the change in Cf from baseline to 12 weeks were higher in VIDA participants who achieved serum concentrations ≥ 30 ng/ml compared to participants with total levels < 30 ng/ml at similar supplementation doses (Table 2). These differences suggest that participants with serum levels < 30 ng/ml were resistant to vitamin D3 supplementation compared to participants with serum levels ≥ 30 ng/ml. The mechanisms underlying resistance are unknown and may be related to pharmacogenetics or genetic variants in vitamin D metabolic pathway genes, which alter the pharmacokinetics of Cf vitamin D3. For instance, several genome-wide studies have identified loci in CYP2R1, the gene encoding the enzyme that converts vitamin D to vitamin D3, and other vitamin D pathway genes that have been associated with low Ctot of vitamin D317,39–42. Genetic loci in vitamin D3 pathway genes provide a rationale as a determinant for therapeutic responsiveness to supplementation therapy and the observed inter-ethnic differences in attainable concentrations. We are performing pharmacogenetic studies of biologic candidate gene variants in the vitamin D3 metabolic pathway to identify a role for gene variation as a determinant of the inter-individual variability of Cf observed in our study.
In the present study Cf and Ctot were highly correlated (Figure 1, r=0.77), as reported in other studies12,13,26, yet, outcomes were associated with Ctot levels > 30 ng/ml 25 but not with Cf levels (Table 3). The reason(s) underlying this finding is not clear. Cf is related to Ctot by: Cf=fu*Ctot, thus, the variation in depicted Figure 1 is related to the interpatient variability in fu, which is determined by the concentration of VDBP (and to a much lesser extent, albumin) and its association constant for vitamin D3. At baseline fu values were similar among participants with Ctot levels < 30 ng/ml and those > 30 ng/ml (Table 2). However, after supplementation, fu values were ~ 20% lower (higher binding to plasma proteins) in participants with Ctot > 30 ng/ml compared to participants with levels < 30 ng/ml (2.43 × 10⁻⁴ vs. 2.93 × 10⁻⁴). The free hormone hypothesis predicts that reductions in fu (increased binding) reduces Ctot but has no influence on Cf 6,8. Thus it is possible that the differences in fu between those achieving Ctot < 30 ng/ml and those with levels > 30 ng/ml may have contributed to the differences in outcomes vs. Ctot and outcomes vs. Cf associations. Alternatively, the increased binding of vitamin D3 in participants with Ctot levels > 30 ng/ml may have reflected increased VDBP and increased transport of VDBP-vitamin D3 complex into tissue.
The determination of vitamin D status (sufficiency, insufficiency, deficiency) relies on levels of parathyroid hormone (PTH) and Ctot of vitamin D3. Vitamin D sufficiency was defined when PTH levels plateued at their nadir of ~ 30 pg/ml, which occurred at Ctot of vitamin D3 of 30–40 ng/ml1. Sufficiency based on free concentrations of vitamin D3 is unknown but may be estimated. For example, Walsh et al reported that the directly measured Cf of vitamin D3 was 10.6 pmol/L (4.24 pg/ml) in their population of healthy Caucasians in the UK, while Ctot and PTH levels were 15–23 ng/ml and 41–42 pg/ml, respectively15. For PTH levels to decline from 40 pg/ml (insufficiency) to 30 pg/ml (sufficiency) required a doubling of Ctot of vitamin D3 from 15 ng/ml to 30 ng/ml1. Since Cf and Ctot are highly correlated (Figure 1) we speculate that a doubling of Cf from 4–5 pg/ml to ~9 pg/ml will reduce PTH from 40 to 30 pgml and achieve sufficiency. Our estimate that the Cf of vitamin D3 of 9 pg/ml defines vitamin D sufficiency was the basis for analyzing VIDA outcomes at 3 stratifications: <9 pg/ml, 9–12 pg/ml and >12 pg/ml (table 3).
Our study has several possible limitations. First, the VIDA trial may be inadequately powered as discussed in the original publication25. In support of this potential limitation, a recent meta-analysis of clinical trials of vitamin D3 supplementation which includes the VIDA trial concluded that vitamin D3 supplementation reduced the risk of asthma exacerbations43. Second, vitamin D3 Cf were not quantified in VIDA participants who took placebo thereby reducing our power to detect a relationship between Cf and outcomes. However, we did not detect a trend for an association between Cf and outcomes suggesting that quantifying Cf and including them in our analysis would not have influenced the outcome. Lastly, insufficient dosing of vitamin D may contribute to the failure of supplementation to alter treatment failure and exacerbation rates.
In summary, the present analysis explored associations between Cf vitamin D3 and outcomes of the VIDA trial. We observed no associations between Cf vitamin D3 and rates of treatment failure and exacerbations. Cf vitamin D3 were lower in African Americans and Hispanics, in overweight participants and in females. We recommend that future studies of vitamin D supplementation in patients with asthma quantify both free and total levels of vitamin D3.
Acknowledgments
Funding: This study was conducted with the support of grants HL098102, U10HL098096, UL1TR000150, UL1TR000430, UL1TR000050, HL098075, UL1TR001082, HL098090, HL098177, UL1TR000439, HL098098, UL1TR000448, HL098107, HL098112, HL098103, UL1TR000454, and HL098115 that were awarded by the National Heart, Lung, and Blood Institute. Ciclesonide and levalbuterol were provided without cost by Sunovion Pharmaceuticals Inc.
ABBREVIATIONS
- VDBP
Vitamin D binding protein
- CYP2R1
Cytochrome P450 2R1
- 25 (OH)2 D3
1,25-dihydroxyvitamin D3
- CYP27B1
Cytochrome P450 27B1
- GC
Group-specific component
- IU
International unit
- Cf
Free (Unbound) concentration
- Cb
Bound concentration
- Ctot
Total concentration
- fu
Unbound fraction
- fb
Bound fraction
- FEV1
Forced expiratory volume in 1 second
Table A1. P values of associations between outcomes and predictors in participants with asthma.
| Outcome | Predictor | Type | P-value* |
|---|---|---|---|
| Treatment failures | Cf Change in Cf Change in Cf categorical |
Continuous Continuous <5 vs. 5–9 vs. ≥9 |
0.51 0.99 0.21 |
| Exacerbations | Cf Change in Cf Change in Cf categorical |
Continuous Continuous <5 vs. 5–9 vs. ≥9 |
0.85 0.85 0.39 |
| Time to first treatment failure | Cf categorical | <9 vs. 9–12 vs. ≥12 | 0.19 |
| Time to first exacerbation | Cf categorical | <9 vs. 9–12 vs. ≥12 | 0.07 |
| Change in %predicted FEV1 | Cf Change in Cf |
Correlation (r=0.07) Correlation (r=−0.06) |
0.36 0.43 |
Treatment failures and exacerbations were modeled using Poisson regression and the associations were adjusted for center, BMI and race; time to first event was evaluated using the Logrank test; associations between change in FEV1 and free Vitamin D measures were based on Pearson correlation.
Footnotes
Publisher's Disclaimer: This is a PDF file of an unedited manuscript that has been accepted for publication. As a service to our customers we are providing this early version of the manuscript. The manuscript will undergo copyediting, typesetting, and review of the resulting proof before it is published in its final form. Please note that during the production process errors may be discovered which could affect the content, and all legal disclaimers that apply to the journal pertain.
Conflicts of interest: none
REFERENCES
- 1.Holick MF. Vitamin D status: measurement, interpretation, and clinical application. Ann Epidemiol February 2009;19(2):73–78. [DOI] [PMC free article] [PubMed] [Google Scholar]
- 2.Pludowski P, Holick MF, Grant WB, et al. Vitamin D supplementation guidelines. J Steroid Biochem Mol Biol January 2018;175:125–135. [DOI] [PubMed] [Google Scholar]
- 3.Holick MF. The vitamin D deficiency pandemic and consequences for nonskeletal health: mechanisms of action. Mol Aspects Med December 2008;29(6):361–368. [DOI] [PMC free article] [PubMed] [Google Scholar]
- 4.LeFevre ML. Screening for vitamin D deficiency in adults: U.S. Preventive Services Task Force recommendation statement. Ann Intern Med January 20 2015;162(2):133–140. [DOI] [PubMed] [Google Scholar]
- 5.Bouillon R, Van Assche FA, Van Baelen H, Heyns W, De Moor P. Influence of the vitamin D-binding protein on the serum concentration of 1,25-dihydroxyvitamin D3. Significance of the free 1,25-dihydroxyvitamin D3 concentration. J Clin Invest March 1981;67(3):589–596. [DOI] [PMC free article] [PubMed] [Google Scholar]
- 6.Bikle DD, Gee E, Halloran B, Kowalski MA, Ryzen E, Haddad JG. Assessment of the free fraction of 25-hydroxyvitamin D in serum and its regulation by albumin and the vitamin D-binding protein. J Clin Endocrinol Metab October 1986;63(4):954–959. [DOI] [PubMed] [Google Scholar]
- 7.Chun RF, Peercy BE, Orwoll ES, Nielson CM, Adams JS, Hewison M. Vitamin D and DBP: the free hormone hypothesis revisited. J Steroid Biochem Mol Biol October 2014;144 Pt A:132–137. [DOI] [PMC free article] [PubMed] [Google Scholar]
- 8.Mendel CM. The free hormone hypothesis: a physiologically based mathematical model. Endocr Rev August 1989;10(3):232–274. [DOI] [PubMed] [Google Scholar]
- 9.Powe CE, Ricciardi C, Berg AH, et al. Vitamin D-binding protein modifies the vitamin D-bone mineral density relationship. J Bone Miner Res July 2011;26(7):1609–1616. [DOI] [PMC free article] [PubMed] [Google Scholar]
- 10.Powe CE, Evans MK, Wenger J, et al. Vitamin D-binding protein and vitamin D status of black Americans and white Americans. N Engl J Med November 21 2013;369(21):1991–2000. [DOI] [PMC free article] [PubMed] [Google Scholar]
- 11.Johnsen MS, Grimnes G, Figenschau Y, Torjesen PA, Almas B, Jorde R. Serum free and bio-available 25-hydroxyvitamin D correlate better with bone density than serum total 25-hydroxyvitamin D. Scand J Clin Lab Invest April 2014;74(3):177–183. [DOI] [PubMed] [Google Scholar]
- 12.Lai JC, Bikle DD, Lizaola B, Hayssen H, Terrault NA, Schwartz JB. Total 25(OH) vitamin D, free 25(OH) vitamin D and markers of bone turnover in cirrhotics with and without synthetic dysfunction. Liver Int October 2015;35(10):2294–2300. [DOI] [PMC free article] [PubMed] [Google Scholar]
- 13.Pollard SL, Lima JJ, Mougey E, et al. Free 25(OH)D concentrations are associated with atopy and lung function in children with asthma. Ann Allergy Asthma Immunol May 19 2017. [DOI] [PMC free article] [PubMed] [Google Scholar]
- 14.Yousefzadeh P, Shapses SA, Wang X. Vitamin D Binding Protein Impact on 25-Hydroxyvitamin D Levels under Different Physiologic and Pathologic Conditions. Int J Endocrinol 2014;2014:981581. [DOI] [PMC free article] [PubMed] [Google Scholar]
- 15.Walsh JS, Evans AL, Bowles S, et al. Free 25-hydroxyvitamin D is low in obesity, but there are no adverse associations with bone health. Am J Clin Nutr June 2016;103(6):1465–1471. [DOI] [PubMed] [Google Scholar]
- 16.Arnaud J, Constans J. Affinity differences for vitamin D metabolites associated with the genetic isoforms of the human serum carrier protein (DBP). Hum Genet September 1993;92(2):183–188. [DOI] [PubMed] [Google Scholar]
- 17.Batai K, Murphy AB, Shah E, et al. Common vitamin D pathway gene variants reveal contrasting effects on serum vitamin D levels in African Americans and European Americans. Hum Genet November 2014;133(11):1395–1405. [DOI] [PMC free article] [PubMed] [Google Scholar]
- 18.Aloia J, Mikhail M, Dhaliwal R, et al. Free 25(OH)D and the Vitamin D Paradox in African Americans. J Clin Endocrinol Metab September 2015;100(9):3356–3363. [DOI] [PMC free article] [PubMed] [Google Scholar]
- 19.Sutherland ER, Goleva E, Jackson LP, Stevens AD, Leung DY. Vitamin D Levels, Lung Function and Steroid Response in Adult Asthma. Am J Respir Crit Care Med 2010. [DOI] [PMC free article] [PubMed] [Google Scholar]
- 20.Paul G, Brehm JM, Alcorn JF, Holguin F, Aujla SJ, Celedon JC. Vitamin D and asthma. Am J Respir Crit Care Med January 15 2012;185(2):124–132. [DOI] [PMC free article] [PubMed] [Google Scholar]
- 21.Wu AC, Tantisira K, Li L, Fuhlbrigge AL, Weiss ST, Litonjua A. Effect of vitamin D and inhaled corticosteroid treatment on lung function in children. Am J Respir Crit Care Med September 15 2012;186(6):508–513. [DOI] [PMC free article] [PubMed] [Google Scholar]
- 22.Yao TC, Tu YL, Chang SW, et al. Suboptimal vitamin D status in a population-based study of Asian children: prevalence and relation to allergic diseases and atopy. PLoS One 2014;9(6):e99105. [DOI] [PMC free article] [PubMed] [Google Scholar]
- 23.Man L, Zhang Z, Zhang M, et al. Association between vitamin D deficiency and insufficiency and the risk of childhood asthma: evidence from a meta-analysis. Int J Clin Exp Med 2015;8(4):5699–5706. [PMC free article] [PubMed] [Google Scholar]
- 24.Confino-Cohen R, Brufman I, Goldberg A, Feldman BS. Vitamin D, asthma prevalence and asthma exacerbations: a large adult population-based study. Allergy December 2014;69(12):1673–1680. [DOI] [PubMed] [Google Scholar]
- 25.Castro M, King TS, Kunselman SJ, et al. Effect of vitamin D3 on asthma treatment failures in adults with symptomatic asthma and lower vitamin D levels: the VIDA randomized clinical trial. JAMA May 2014;311(20):2083–2091. [DOI] [PMC free article] [PubMed] [Google Scholar]
- 26.Schwartz JB, Lai J, Lizaola B, et al. A comparison of measured and calculated free 25(OH) vitamin D levels in clinical populations. J Clin Endocrinol Metab May 2014;99(5):1631–1637. [DOI] [PMC free article] [PubMed] [Google Scholar]
- 27.Heureux N Vitamin D Testing-Where Are We and What Is on the Horizon? Adv Clin Chem 2017;78:59–101. [DOI] [PubMed] [Google Scholar]
- 28.Looker AC, Pfeiffer CM, Lacher DA, Schleicher RL, Picciano MF, Yetley EA. Serum 25-hydroxyvitamin D status of the US population: 1988–1994 compared with 2000–2004. Am J Clin Nutr 2008;88(6):1519–1527. [DOI] [PMC free article] [PubMed] [Google Scholar]
- 29.Aloia JF. African Americans, 25-hydroxyvitamin D, and osteoporosis: a paradox. Am J Clin Nutr August 2008;88(2):545S–550S. [DOI] [PMC free article] [PubMed] [Google Scholar]
- 30.Freishtat RJ, Iqbal SF, Pillai DK, et al. High prevalence of vitamin D deficiency among inner-city African American youth with asthma in Washington, DC. J Pediatr 2010;156(6):948–952. [DOI] [PMC free article] [PubMed] [Google Scholar]
- 31.Hollis BW, Bikle DD. Vitamin D-binding protein and vitamin D in blacks and whites. N Engl J Med February 27 2014;370(9):879–880. [DOI] [PMC free article] [PubMed] [Google Scholar]
- 32.Bouillon R, Jones K, Schoenmakers I. Vitamin D-binding protein and vitamin D in blacks and whites. N Engl J Med February 27 2014;370(9):879. [DOI] [PubMed] [Google Scholar]
- 33.Hoofnagle AN, Eckfeldt JH, Lutsey PL. Vitamin D-Binding Protein Concentrations Quantified by Mass Spectrometry. N Engl J Med October 8 2015;373(15):1480–1482. [DOI] [PMC free article] [PubMed] [Google Scholar]
- 34.Nielson CM, Jones KS, Chun RF, et al. Free 25-Hydroxyvitamin D: Impact of Vitamin D Binding Protein Assays on Racial-Genotypic Associations. J Clin Endocrinol Metab May 2016;101(5):2226–2234. [DOI] [PMC free article] [PubMed] [Google Scholar]
- 35.Alzaman NS, Dawson-Hughes B, Nelson J, D’Alessio D, Pittas AG. Vitamin D status of black and white Americans and changes in vitamin D metabolites after varied doses of vitamin D supplementation. Am J Clin Nutr July 2016;104(1):205–214. [DOI] [PMC free article] [PubMed] [Google Scholar]
- 36.Khalid AT, Moore CG, Hall C, et al. Utility of sun-reactive skin typing and melanin index for discerning vitamin D deficiency. Pediatr Res September 2017;82(3):444–451. [DOI] [PMC free article] [PubMed] [Google Scholar]
- 37.Hill TD, Graham LM, Divgi V. Racial disparities in pediatric asthma: a review of the literature. Curr Allergy Asthma Rep February 2011;11(1):85–90. [DOI] [PubMed] [Google Scholar]
- 38.McHugh MK, Symanski E, Pompeii LA, Delclos GL. Prevalence of asthma among adult females and males in the United States: results from the National Health and Nutrition Examination Survey (NHANES), 2001–2004. J Asthma October 2009;46(8):759–766. [DOI] [PMC free article] [PubMed] [Google Scholar]
- 39.Wang TJ, Zhang F, Richards JB, et al. Common genetic determinants of vitamin D insufficiency: a genome-wide association study. Lancet July 17 2010;376(9736):180–188. [DOI] [PMC free article] [PubMed] [Google Scholar]
- 40.Ahn J, Yu K, Stolzenberg-Solomon R, et al. Genome-wide association study of circulating vitamin D levels. Hum Mol Genet 2010. [DOI] [PMC free article] [PubMed] [Google Scholar]
- 41.Nissen J, Rasmussen LB, Ravn-Haren G, et al. Common variants in CYP2R1 and GC genes predict vitamin D concentrations in healthy Danish children and adults. PLoS One 2014;9(2):e89907. [DOI] [PMC free article] [PubMed] [Google Scholar]
- 42.Zhang M, Zhao LJ, Zhou Y, et al. SNP rs11185644 of RXRA gene is identified for dose-response variability to vitamin D3 supplementation: a randomized clinical trial. Sci Rep January 12 2017;7:40593. [DOI] [PMC free article] [PubMed] [Google Scholar]
- 43.Martineau AR, Cates CJ, Urashima M, et al. Vitamin D for the management of asthma. Cochrane Database Syst Rev September 5 2016;9:CD011511. [DOI] [PMC free article] [PubMed] [Google Scholar]