Abstract
The aim of the present study was to identify the important mRNAs, micro (mi)RNAs and long non-coding (lnc)RNAs that are associated with osteosarcoma recurrence. The GSE3905 dataset, which contains two sub-datasets (GSE39040 and GSE39055), was downloaded from the Gene Expression Omnibus (GEO). Prognosis-associated RNAs were identified by performing Cox regression univariate analysis and were subsequently used to construct a competing endogenous (ce)RNA regulatory network for Gene Set Enrichment Analysis (GSEA). Kaplan-Meier survival analysis was used to determine the associations between expression levels and survival prognosis. In addition, another independent miRNA profile, GSE79181, was downloaded from GEO for validation. Among the differentially expressed RNAs, 417 RNAs (5 lncRNAs, 19 miRNAs, and 393 mRNAs) were observed to be associated with prognosis. The GSEA for the ceRNA regulatory network revealed that ‘Mitogen-activated protein kinase (MAPK) signaling pathway’, ‘Chemokine signaling pathway’ and ‘Spliceosome’ were markedly associated with osteosarcoma. In addition, three lncRNAs [long intergenic non-protein coding RNA 28 (LINC00028), LINC00323, and small nucleolar RNA host gene 1 (SNHG1)] and two miRNAs (hsa-miR-124 and hsa-miR-7) regulating three mRNAs [Ras-related protein Rap-1b (RAP1B), activating transcription factor 2 (ATF2) and protein phosphatase Mg2+/Mn2+ dependent 1B (PPM1B)] participated in the MAPK signaling pathway. The Kaplan-Meier survival analysis also demonstrated that samples with lower expression levels of LINC00323 and SNHG1 had better prognosis, and samples with increased expression levels of LINC00028, hsa-miR-124 and hsa-miR-7 had better prognosis. Overexpression of RAP1B, ATF2 and PPM1B was positively associated with osteosarcoma recurrence. The roles of hsa-miR-124 and hsa-miR-7 in osteo-sarcoma recurrence were also validated using GSE79181. Thus, in conclusions, the three lncRNAs (LINC00028, LINC00323 and SNHG1), two miRNAs (hsa-miR-124 and hsa-miR-7) and three mRNAs (RAP1B, ATF2, and PPM1B) were associated with osteosarcoma recurrence.
Keywords: osteosarcoma, recurrence, competing endogenous RNA network
Introduction
Osteosarcoma is the most common primary malignant bone tumor and often exhibits locally invasive growth. Osteosarcoma is commonly characterized by an appendicular primary tumor with a high rate of pulmonary metastases (1). In addition, osteosarcoma is a genetically unstable and highly malignant mesenchymal tumor of the bone characterized by structural chromosomal alterations (2,3).
Improved understanding of the molecular mechanisms underlying osteosarcoma would support the development of effective and targeted therapies. Many previous studies have reported molecular mechanisms underlying osteosarcoma that were involved in the progression and metastasis of osteosarcoma (4-8). Inhibiting Wnt/β-catenin signaling and targeting c-Met, a Wnt-regulated proto-oncogene, have shown to be useful in the treatment of osteosarcoma (4,5). The Notch pathway has a vital role in regulating tumor angiogenesis and vasculogenesis in osteosarcoma (6). Wilms' tumor gene 1 has been reported to act as a tumor promoter in osteosarcoma by regulating cell cycle and apoptotic machinery (7). Recently, COP9 signalosome subunit 3 (COPS3), another oncogene overexpressed in osteosarcoma, was revealed to be involved in osteosarcoma metastasis by interacting with Beclin1 and Raf-1 through autophagy (8). In addition, some studies have reported the roles of long non-coding RNAs (lncRNAs) in the progression, metastasis, and prognosis of osteosarcoma (9-16). A previous study also demonstrated that lncRNAs may function as competing endogenous RNAs (ceRNAs) to sponge microRNAs (miRNAs), thereby regulating miRNA targets (17).
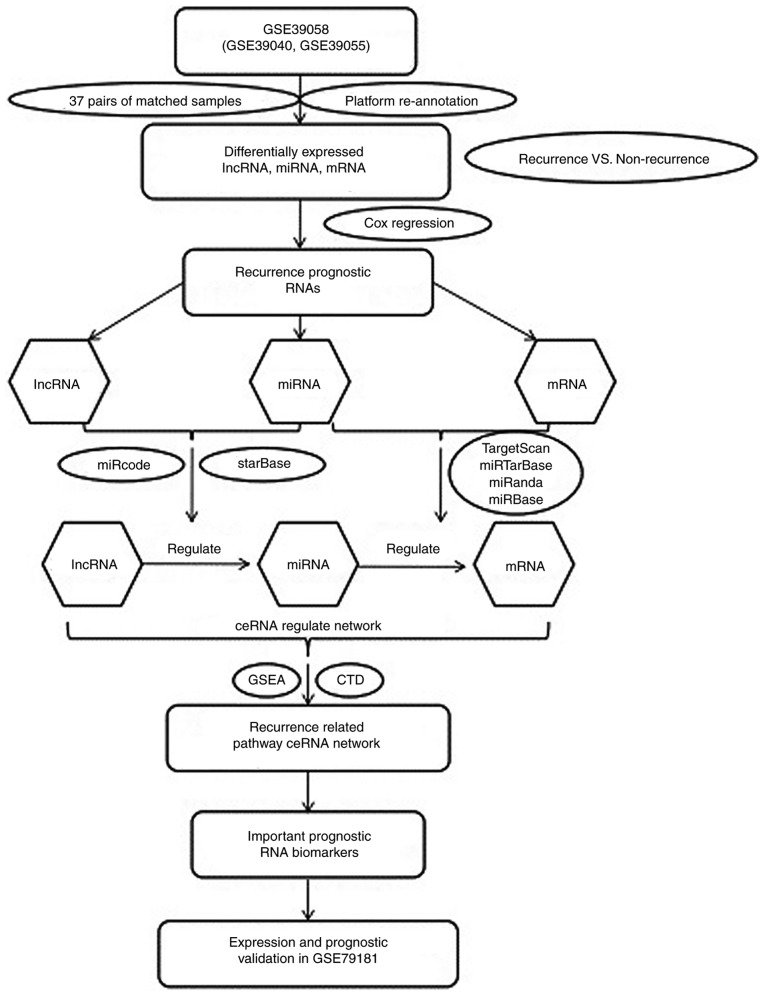
Hedgehog signaling in mature osteoblasts is responsible for the pathogenesis of osteoblastic osteosarcoma through the overexpression of yes-associated protein 1 and lncRNA H19 (9). The lncRNA small nucleolar RNA host gene 1 (SNHG12) could upregulate the expression of Notch2 to promote osteosarcoma metastasis by acting as a sponge of miR-195-5p (10). The lncRNA focally amplified lncRNA on chromosome 1 has been shown to be a negative prognostic biomarker and exhibit an important pro-oncogenic effect on osteosarcoma progression by targeting epithelial-mesenchymal transition (11). Decreased expression levels of the lncRNA maternally expressed 3 (MEG3) has been reported to be an independent predictor of shorter overall survival in patients with osteosarcoma, suggesting that MEG3 lncRNA may be a useful biomarker for the prognosis of osteosarcoma (12). In addition, lncRNA MEG3 could promote osteosarcoma cell growth and metastasis in vitro by acting as a sponge of miR-127 (13). In a two-stage and case-control study of 900 osteosarcoma cases and 900 controls among the Chinese population, those with the rs7958904 CC genotype had a significantly lower expression level of the lncRNA HOX transcript antisense RNA than those with other genotypes, as well as a lower risk of osteosarcoma (14). The upregulation of lncRNA taurine upregulated 1 was also revealed to be strongly associated with poor prognosis and was an independent prognostic indicator for overall progression-free survival in osteosarcoma (15). Patients with osteosarcoma and high expression levels of lncRNA HOXA distal transcript antisense RNA had poorer overall survival than those with low expression levels (16). The majority of prognostic miRNAs were located at 14q32 in a study by Kelly et al (18); their gene targets displayed deregulation patterns associated with outcomes based on their developed miRNA models, with independent predictive values for recurrence and overall survival from formalin-fixed, paraffin-embedded human osteosarcoma diagnostic biopsy specimens. However, the roles of the lncRNAs were not investigated. In the present study, the GSE3905 dataset was downloaded to identify prognosis-associated RNAs for ceRNA regulatory network construction. In addition, the important pathways were determined using Gene Set Enrichment Analysis (GSEA). Kaplan-Meier survival analysis was conducted to determine the associations between the expression levels and survival prognosis. Furthermore, another independent miRNA profile, GSE79181, was downloaded from Gene Expression Omnibus (GEO) for validation (Fig. 1).
Figure 1.
Flow chart of the analysis performed in the present study. GSE39058 was downloaded in order to identify prognosis-associated lncRNAs, miRNAs and mRNAs for ceRNA regulatory network construction. Important pathways were searched using GSEA. Kaplan-Meier survival analysis was conducted to determine the associations between the expression levels and survival prognosis. In addition, another independent dataset GSE79181 was also downloaded for validation. GSEA, Gene Set Enrichment Analysis; lncRNA, long non-coding RNA; miRNA, microRNA; ceRNA, competing endogenous RNA; CTD, Comparative Toxicogenomics Database.
Materials and methods
Microarray data and preprocessing
The expression profile of GSE39058 (18), containing two subdatasets (GSE39040 and GSE39055), was downloaded from GEO (www.ncbi.nlm.nih.gov/geo/). The small non-coding RNA (miRNA) profile of GSE39040, containing 65 human osteosarcoma biopsy specimens, was generated using the platform GPL15762 (Illumina Human v2 MicroRNA Expression BeadChip; Illumina, Inc., San Diego, CA, USA) and the expression profile of GSE39055 containing 37 human osteosarcoma biopsy specimens was based on the platform of GPL14951 (Illumina HumanHT-12 WG-DASL V4.0 R2 Expression BeadChip); Illumina, Inc.). The paired miRNA and mRNA profiles of 37 biopsy specimens were used for further analysis. The probe names in the gene expression profiles were converted into gene names. In addition, the mean value of a gene symbol matched with multiple probes was calculated using the function in R software (version 3.4.1) (19). Subsequently, the microarray data were normalized using the preprocessCore package in R software (version 3.4.1) (19). The Linear Models for Microarray Analysis (Limma) package (version 3.32.5) in R software (20) was used for log2 conversion and the sequencing data were normalized using the quantile method (21).
Differential expression analysis and hierarchical clustering
The mRNAs and lncRNAs in the GSE39055 dataset were annotated using the Transcript ID, RefSeq ID and location, supported by the GPL14951 (Illumina HumanHT-12 WG-DASL V4.0; Illumina, Inc.) platform and HUGO Gene Nomenclature Committee (www.genenames.org), which has 3,859 lncRNAs and 19,180 protein-coding genes (22). The 37 biopsy specimens of the paired miRNA and mRNA profile were divided into recurrent (n=18) and non-recurrent (n=19) osteosarcoma samples based on the clinical information. The Limma package (20) was used to perform differential expression analysis between recurrent and non-recurrent osteosarcoma samples. The P-values were adjusted for false discovery rate (FDR) using the Benjamini-Hochberg method (23). The thresholds for screening differentially expressed mRNAs, miRNAs and lncRNA were set as FDR<0.05 and |log2 fold-change (FC)|>0.585. In addition, the expression values of screened differentially expressed RNAs were hierarchically clustered using the pheatmap package (version 1.0.8) (24) in R based on the encyclopedia of distances (25) to observe the differences in expression levels spontaneously.
Screening prognosis-associated RNAs
The expression levels of differentially expressed RNAs and the prognostic information of each sample were collected. The survival package (26) in R was used to identify the prognosis-associated mRNAs, miRNAs and lncRNAs by Cox regression univariate analysis, and P<0.05 was used as the cut-off criterion. Subsequently, the Database for Annotation, Visualization and Integrated Discovery (version 6.8) (27) was used to perform Gene Ontology (GO) functional [biology process (BP), molecular function (MF) and cellular component (CC)] and Kyoto Encyclopedia of Genes and Genomes (KEGG) pathway enrichment analysis for prognosis-associated mRNAs, with a threshold of P<0.05.
ceRNA regulatory network construction and analysis
The identified prognosis-associated lncRNAs and miRNAs were used to select lncRNA-miRNA regulatory relationships from the associations in miRcode (version 11; www.mircode.org/) and starBase (version 2.0; starbase.sysu.edu.cn/index.php) (28). In addition, the miRNA-mRNA regulatory associations were selected based on the regulatory information in TargetScan (release 7.1; www.targetscan.org/vert_71/) (29), miRTarBase (release 6.0; mirtarbase.mbc.nctu.edu.tw) (30), miRanda (version 2.0; www.microrna.org/microrna/home.do) (31) and miRBase (release 21; www.mirbase.org/) (32). The ceRNA regulatory network was constructed by integrating the lncRNA-miRNA and miRNA-mRNA regulatory relationships via Cytoscape (version 3.4; www.cytoscape.org/) (33).
The genes in the constructed ceRNA regulatory network were used for GSEA (2017 update; software.broadinstitute.org/gsea/index.jsp) to identify the important KEGG pathways (34). Subsequently, the KEGG pathways directly associated with osteosarcoma were screened by searching the term ‘osteosarcoma’ in the Comparative Toxicogenomics Database (CTD; 2017 update; ctd.mdibl.org/) (35).
Validation of prognosis-associated RNAs
The important RNAs participating in the KEGG pathways directly associated with osteosarcoma were used to classify the samples into high- and low-expression groups based on the expression levels. Kaplan-Meier survival analysis, conducted with R software (version 3.4.1), was used to determine the associations between the expression levels and survival prognosis. Another independent miRNA profile, GSE79181, containing 25 osteosarcoma samples was downloaded from GEO (www.ncbi.nlm.nih.gov/geo/) to validate the reliability of the important molecules.
Results
DEGs screening and hierarchical clustering
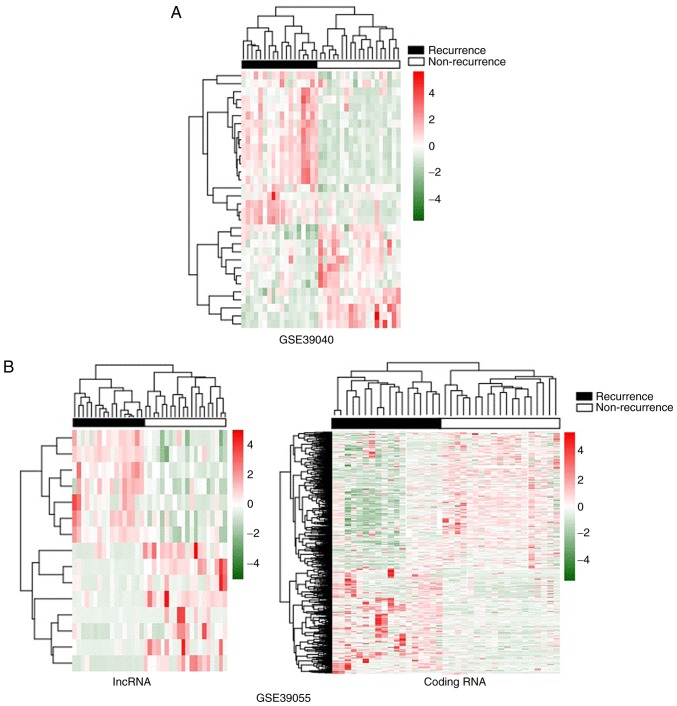
Following data preprocessing, 15 differentially expressed lncRNAs (8 down-regulated and 7 upregulated lncRNAs) and 837 differentially expressed mRNAs (362 downregulated and 475 upregulated mRNAs) were identified in the GSE30955 profile. In addition, 32 differentially expressed miRNAs, including 13 down-regulated and 19 upregulated miRNAs, were revealed in the GSE39040 profile. The expression values of differentially expressed miRNAs, lncRNAs, and mRNAs were hierarchically clustered, and the color contrast indicated a significant difference in the expression levels between the recurrent and non-recurrent osteosarcoma samples (Fig. 2).
Figure 2.
Hierarchical clustering analysis of screened differentially expressed RNAs. The color contrast indicates the marked differences in the expression levels between the recurrent and non-recurrent osteosarcoma samples. (A) Heatmap for GSE39040 using the differentially expressed miRNAs. (B) Heatmap for GSE39055 using the differentially expressed lncRNAs and mRNAs separately. lncRNA, long non-coding RNA; miRNA, microRNA.
Prognosis-associated mRNAs, miRNAs and lncRNAs
Among the selected differentially expressed RNAs, 417 RNAs (5 lncRNAs, 19 miRNAs and 393 mRNAs) were revealed to be associated with prognosis. The functional enrichment analysis for prognosis-associated mRNAs demonstrated that these 393 mRNAs were markedly involved with 10, 8 and 2 GO terms in the BP, CC and MF categories, respectively (Table I). These functions were mainly associated with ‘chromatin organization’ and ‘transcription regulator’. Furthermore, 9 KEGG pathways were enriched for prognosis-associated mRNAs, such as ‘transforming growth factor-β signaling pathway’ (P= 0.0258), ‘Wnt signaling pathway’ (P= 0.0366) and ‘Oxidative phosphorylation’ (P=0.0493; Table II).
Table I.
Gene Ontology functional enrichment analysis in terms of biology process, cellular component and molecular function for the prognosis-associated mRNAs.
| Category | Term | Count | P-Value | Genes |
|---|---|---|---|---|
| BP | GO:0043009~chordate embryonic development | 16 | 0.0033 | MAFG, NBN, SYVN1, ADA, HOXA2, HOXA3, HOXC9, MEOX2, HOXA5, HOXB8, NCOA6, APBA3, DAD1, MAPK8IP3, ROR2, MED1 |
| GO:0048568~embryonic organ development | 10 | 0.0086 | HOXA2, HOXC9, HOXA3, HOXB8, HOXA5, MYO7A, ROR2, VAX2, ADA, MED1 | |
| GO:0003002~regionalization | 10 | 0.0195 | HOXA2, HOXC9, HOXA3, BTG2, MEOX2, HOXB8, HOXA5, ROR2, VAX2, LRP5 | |
| GO:0051276~chromosome organization | 18 | 0.0208 | MEAF6, NBN, HIST1H1D, HIST1H2BF, HP1BP3, HIST1H1A, EZH2, CENPE, TSPYL1, CHMP1A, EYA2, HDAC2, NCAPG, PRDM5, CHD1,TLK1, RNF40, KDM5D | |
| GO:0001501~skeletal system development | 13 | 0.0296 | ESRRA, AEBP1, BMP1, TUFT1, ATP6V1B1, HOXA2, HOXA3, HOXC9, HOXB8, HOXA5, ETS2, COMP, ROR2 | |
| GO:0006351~transcription, DNA-dependent | 12 | 0.0367 | TAF11, TAF1B, MED7, CCNK, TAF1A, ETS1, ANG, NCOA6, NFIX, POLR2D, MED1, TAF1L | |
| GO:0032774~RNA biosynthetic process | 12 | 0.0399 | TAF11, TAF1B, MED7, CCNK, TAF1A, ETS1, ANG, NCOA6, NFIX, POLR2D, MED1, TAF1L | |
| GO:0045597~positive regulation of cell differentiation | 10 | 0.0448 | IKZF1, ETS1, VHL, MAPT, KITLG, SEMA4D, SOCS5, NTN1, BOC, ADA | |
| GO:0006325~chromatin organization | 14 | 0.0458 | MEAF6, HIST1H1D, HP1BP3, HIST1H2BF, HIST1H1A, EZH2, TSPYL1, EYA2, HDAC2, PRDM5, CHD1, TLK1, RNF40, KDM5D | |
| GO:0048598~embryonic morphogenesis | 12 | 0.0495 | HOXA2, EYA2, HOXC9, HOXA3, HOXB8, HOXA5, MYO7A, CRABP2, ROR2, VAX2, MED1, LRP5 | |
| CC | GO:0044463~cell projection part | 15 | 0.0002 | PLD2, BBS5, PARD3, TTLL6, KLC2, GAS8, ADA, SPAG16, PCSK1, CC2D2A, CYBRD1, MAPK8IP3, PEBP1, SLC5A6, CNTNAP1 |
| GO:0042995~cell projection | 26 | 0.0017 | BBS5, PARD3, MYO7A, CLSTN1, TTLL6, KLC2, ADA, SPAG16, PCSK1, ANG, MAPT, SLC4A7, CNTNAP1, PLD2, DBNL, ARHGEF7, NPY1R, GAS8, THY1, GRM2, CC2D2A, CYBRD1, PEBP1, MAPK8IP3, SLC5A6, GAP43 | |
| GO:0005694~chromosome | 19 | 0.0030 | TCP1, NBN, HIST1H1D, PRPF4B, IKZF1, HIST1H2BF, PPP2R5A, HP1BP3, HIST1H1A, AKAP8L, CENPE, TRIM66, CHMP1A, HDAC2, RIF1, NCAPG, PPP2CB, CHD1, RNF40 | |
| GO:0044427~chromosomal part | 15 | 0.0158 | TCP1, NBN, HIST1H1D, IKZF1, HIST1H2BF, HP1BP3, PPP2R5A, HIST1H1A, CENPE, TRIM66,HDAC2, RIF1, NCAPG, PPP2CB, CHD1 | |
| GO:0005578~proteinaceous extracellular matrix | 13 | 0.0195 | ASPN, COL4A2, HMCN1, ADAMTSL2, LAMC3, ANG, FBLN2, COMP, TIMP4, MMP3, NTN1, MFAP5, SPON1 | |
| GO:0043005~neuron projection | 13 | 0.0306 | ARHGEF7, NPY1R, KLC2, ADA, THY1, PCSK1, GRM2, ANG, MAPT, MAPK8IP3, PEBP1, CNTNAP1, GAP43 | |
| GO:0031012~extracellular matrix | 13 | 0.0322 | ASPN, COL4A2, HMCN1, ADAMTSL2, LAMC3, ANG, FBLN2, COMP, TIMP4, MMP3, NTN1, MFAP5, SPON1 | |
| GO:0005730~nucleolus | 21 | 0.0440 | UTP23, MEAF6, PNMA3, NBN, SYVN1, TAF1A, TSR1, HNRNPA1, PNN, TSPYL1, NOP14, STAT6, DIS3, KRT17, ANG, RPL9, NCOA6, PQBP1, LIAS, HNRNPH1, ARL4A | |
| MF | GO:0043565~sequence-specific DNA binding | 22 | 0.0116 | MAFG, TSHZ3, ERF, ESRRA, IKZF1, TFE3, VAX2, NFIX, ATF2, STAT6, ATF5, HOXA2, HDAC2, HOXA3, HOXC9, MEOX2, HOXA5, ETS1, HOXB8, ETS2, PRDM5, CREB3L4 |
| GO:0030528~transcription regulator activity | 41 | 0.0440 | TAF1B, TSHZ3, AEBP1, TAF1A, TFE3, E2F8, EZH2, CNOT3, NFIX, MXI1, ATF2, ZNF75D, KCNIP3, STAT6, TRIM66, HOXA2, HOXC9, HOXA3, HOXA5, PQBP1, CREB3L4, TAF1L, MAFG, ERF, ESRRA, IKZF1, VAX2, AFF1, MSRB2, TAF11, MED7, ATF5, HDAC2, MEOX2, ETS1, HOXB8, ETS2, PRDM5, NCOA6, ID4, MED1 |
GO, Gene Ontology; BP, biology process; CC, cellular component; MF, molecular function.
Table II.
Nine enriched Kyoto Encyclopedia of Genes and Genomes pathways for prognosis-associated mRNAs.
| KEGG Pathway | Count | P-Value | Genes |
|---|---|---|---|
| hsa00520:Amino sugar and nucleotide sugar metabolism | 3 | 0.0224 | GMPPB, PGM3, FUK |
| hsa00603:Glycosphingolipid biosynthesis | 2 | 0.0249 | GBGT1, B3GALNT1 |
| hsa04350:TGF-β signaling pathway | 4 | 0.0258 | AMHR2, COMP, PPP2CB, ID4 |
| hsa04144:Endocytosis | 6 | 0.0316 | PRKCZ, PLD2, PARD3, RAB11FIP3, ACAP2, AGAP1 |
| hsa04310:Wnt signaling pathway | 5 | 0.0366 | PPP2R5A, PPP2CB, PRICKLE2, PLCB1, LRP5 |
| hsa03020:RNA polymerase | 2 | 0.0437 | POLR2D, POLR2J2 |
| hsa04070:Phosphatidylinositol signaling system | 3 | 0.0445 | DGKQ, PLCD4, PLCB1 |
| hsa03040:Spliceosome | 4 | 0.0473 | PQBP1, MAGOHB, THOC2, HNRNPA1 |
| hsa00190:Oxidative phosphorylation | 4 | 0.0493 | NDUFB4, ATP6V1E2, ATP6V1B1, COX17 |
KEGG, Kyoto Encyclopedia of Genes and Genomes; TGF-β, transforming growth factor-β.
ceRNA regulatory network construction and analysis
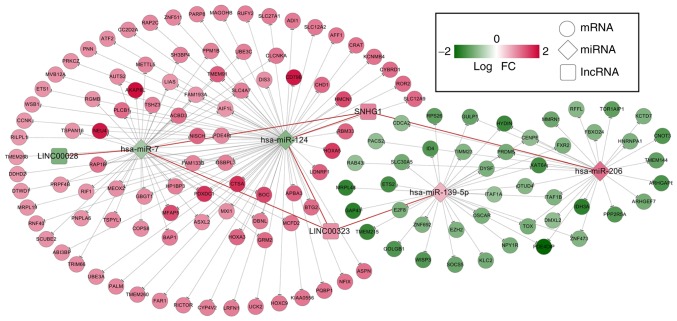
A total of 65 lncRNA-miRNA regulatory relationships associated with the 5 prognosis-associated lncRNAs were identified in miRcode and starBase. In addition, 7 lncRNA-miRNA regulatory relationships associated with the 19 prognosis-associated miRNAs were further screened, which involved three lncRNAs [long intergenic non-protein coding RNA 28 (LINC00028), LINC00323 and SNHG1] and four miRNAs (hsa-miR-124, hsa-miR-139-5p, hsa-miR-7, and hsa-miR-206). Furthermore, 172 miRNA-mRNA regulatory relationships were obtained for these four miRNAs using TargetScan, miRBase, miRanda, and miRTarBase. Finally, the 7 lncRNA-miRNA and 172 miRNA-mRNA regulatory relationships were used to construct the ceRNA regulatory network, which included 3 lncRNAs, 4 miRNAs and 143 mRNAs (Fig. 3).
Figure 3.
Constructed ceRNA regulatory network using prognosis-associated RNAs. The ceRNA regulatory network included 7 lncRNA-miRNA and 172 miRNA-mRNA regulatory associations, which involved 3 lncRNAs, 4 miRNAs and 143 mRNAs. Red nodes indicate the upregulated RNAs, and green indicate the downregulated RNAs. lncRNA, long non-coding RNA; miRNA/miR, microRNA; ceRNA, competing endogenous RNA; FC, fold change.
The GSEA for the ceRNA regulatory network revealed that three KEGG pathways [‘Mitogen-activated protein kinase (MAPK) signaling pathway’, ‘Chemokine signaling pathway’ and ‘Spliceosome’] were markedly associated with osteosarcoma (Table III). Furthermore, ‘MAPK signaling pathway’ involving three genes [Ras-related protein Rap-1b (RAP1B), activating transcription factor 2 (ATF2) and protein phosphatase Mg2+/Mn2+ dependent 1B (PPM1B)] was also demonstrated to be associated with osteosarcoma by searching the CTD. Based on the ceRNA regulatory network, two miRNAs (hsa-miR-124 and hsa-miR-7) and three lncRNAs (LINC00028, LINC00323, and SNHG1) could regulate the three mRNAs (RAP1B, ATF2, and PPM1B) that participate in the MAPK signaling pathway (Fig. 4).
Table III.
Gene Set Enrichment Analysis for the competing endogenous RNA regulatory network.
| Name | Enrichment score | Normalized enrichment score | Nominal P-value | Genes |
|---|---|---|---|---|
| MAPK_SIGNALING_PATHWAY | 0.5145 | 1.1238 | 0.0324 | RAP1B, ATF2, PPM1B |
| CHEMOKINE_SIGNALING_PATHWAY | 0.4710 | 1.0218 | 0.0423 | RAP1B, PLCB1, PRKCZ |
| SPLICEOSOME | 0.3188 | 0.6929 | 0.0485 | MAGOHB, PQBP1 |
MAPK, mitogen-activated protein kinase; RAP1B, Ras-related protein Rap-1b; ATF2, activating transcription factor 2; PPM1B, protein phosphatase Mg2+/Mn2+ dependent 1B; PLCB1, phospholipase Cβ1; PRKCZ, protein kinase Cζ; MAGOHB, Mago homolog B exon junction complex subunit; PQBP1, polyglutamine binding protein 1.
Figure 4.
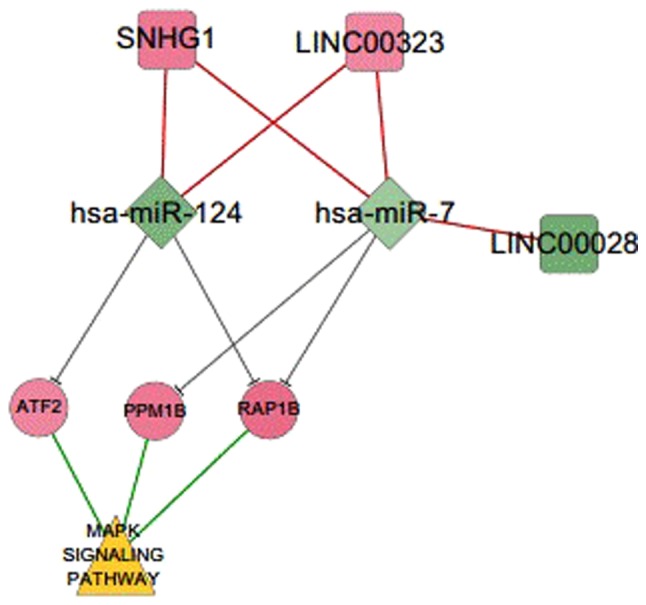
ceRNA regulatory network associated with the MAPK signaling pathway. Two miRNAs (hsa-miR-124 and hsa-miR-7) and three lncRNAs (LINC00028, LINC00323, and SNHG1) could regulate three mRNAs (RAP1B, ATF2 and PPM1B) that participate in the MAPK signaling pathway. lncRNA, long non-coding RNA; miRNA/miR, microRNA; ceRNA, competing endogenous RNA; LINC, long intergenic non-protein coding RNA; SNHG1, small nucleolar RNA host gene 1; RAP1B, Ras-related protein Rap-1b; ATF2, activating transcription factor 2; PPM1B, protein phosphatase Mg2+/Mn2+ dependent 1B; MAPK, mitogen-activated protein kinase.
Validation of prognosis-associated RNAs
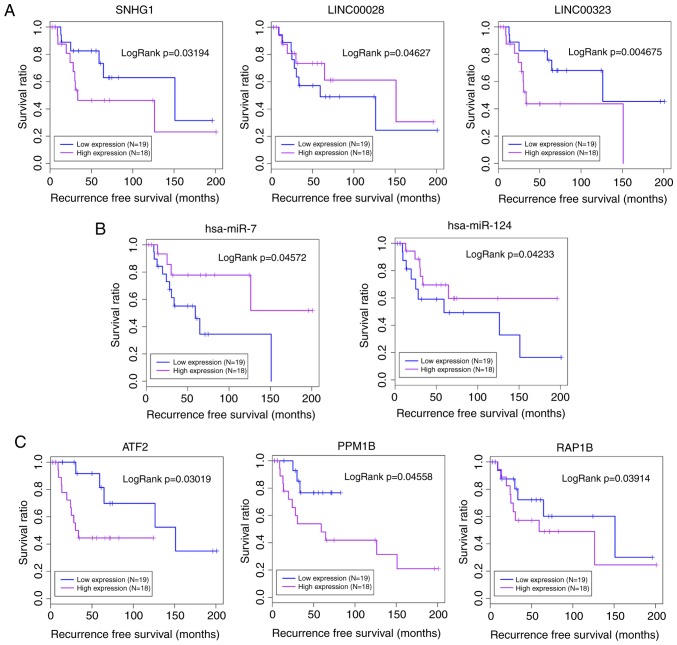
The samples were classified into high- and low-expression groups based on the expression levels of three mRNAs (RAP1B, ATF2, and PPM1B), two miRNAs (hsa-miR-124 and hsa-miR-7), and three lncRNAs (LINC00028, LINC00323, and SNHG1). Kaplan-Meier survival analysis revealed that samples with lower expression levels of LINC00323 and SNHG1 had better prognosis, and increased expression levels of LINC00028, hsa-miR-124, and hsa-miR-7 were associated with better prognosis. The overexpression of RAP1B, ATF2 and PPM1B was also positively associated with osteosarcoma recurrence (Fig. 5).
Figure 5.
Kaplan-Meier survival analysis for lncRNAs, miRNAs and mRNAs associated with the mitogen-activated protein kinase signaling pathway. (A) Lower expression levels of LINC00323 and SNHG1, and increased expression levels of LINC00028 were associated with better prognosis. (B) Samples with increased expression levels of hsa-miR-124 and hsa-miR-7 had better prognosis. (C) The overexpression of RAP1B, ATF2, and PPM1B was positively associated with osteosarcoma recurrence. lncRNA, long non-coding RNA; miRNA/miR, microRNA; ceRNA, competing endogenous RNA; LINC, long intergenic non-protein coding RNA; SNHG1, small nucleolar RNA host gene 1; RAP1B, Ras-related protein Rap-1b; ATF2, activating transcription factor 2; PPM1B, protein phosphatase Mg2+/Mn2+ dependent 1B.
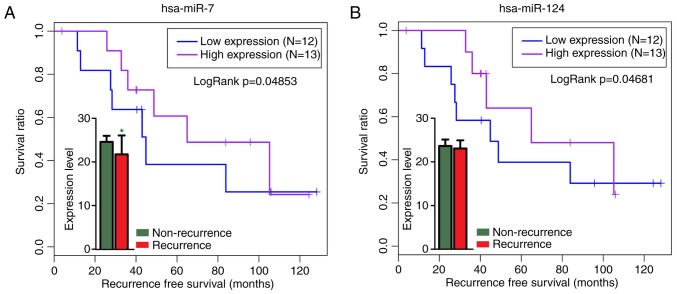
The expression level of hsa-miR-7 was significantly down-regulated in the osteosarcoma recurrent samples (P=0.02346) of another independent miRNA profile, GSE79181 (Fig. 6A). Kaplan-Meier survival analysis revealed that hsa-miR-124 (P=0.04681) and hsa-miR-7 (P=0.04853) were markedly associated with osteosarcoma recurrence (Fig. 6) using GSE79181. These results were in accordance with the GSE39040 analysis results.
Figure 6.
Kaplan-Meier survival analysis of hsa-miR-124 and hsa-miR-7 with osteosarcoma recurrence using GSE79181 for validation. (A) hsa-miR-7 was significantly downregulated in the osteosarcoma recurrent samples. (B) hsa-miR-124 was markedly associated with osteosarcoma recurrence. Data are presented as the mean ± standard deviation. *P<0.05 vs. non-recurrence. miR, microRNA.
Discussion
Understanding the mechanisms underlying osteosarcoma pathogenesis is necessary to determine novel biomarkers for the development of novel treatment strategies, particularly for metastases, as the prognosis of osteosarcoma is still poor (36). A number of previous studies have suggested that the dysregulated expression of lncRNAs could independently predict the outcomes of patients with osteosarcoma (37,38). In the present study, 417 RNAs (5 lncRNAs, 19 miRNAs and 393 mRNAs) were revealed to be associated with prognosis among the total number of differentially expressed RNAs identified. Subsequently, the prognosis-associated RNAs were used to construct a ceRNA regulatory network for GSEA. The GSEA for the ceRNA regulatory network revealed that ‘MAPK signaling pathway’, ‘Chemokine signaling pathway’ and ‘Spliceosome’ were markedly associated with osteosarcoma. In addition, the MAPK signaling pathway was also demonstrated to be associated with osteosarcoma via the CTD.
MAPK is an insulin-mitogen activated protein (Ser/Thr) kinase, and activated MAPK can transmit extracellular signals to regulate cell growth, migration and apoptosis (39). Many studies have reported the significant roles of the MAPK signaling pathway in osteosarcoma (40,41). The expression level of S100 calcium binding protein A9 (S100A9) was increased in human osteosarcoma tissues and associated with survival rate, and the downregulation of S100A9 inhibited osteosarcoma cell proliferation through the inactivation of the MAPK and NF-κB signaling pathways (42). Increased expression levels of phospholipase A2 group XVI could enhance osteosarcoma metastasis by activating the MAPK signaling pathway (43). Delphinidin treatment could inhibit cell migration and prevented epithelial-to-mesenchymal transition via the MAPK signaling pathway in osteosarcoma cell lines (44). Onzin overexpression could also contribute to more aggressive osteosarcoma metastatic phenotypes through the C-X-C motif chemokine 5-MAPK signaling pathway (45).
In the constructed ceRNA regulatory network, three lncRNAs (LINC00028, LINC00323 and SNHG1) and two miRNAs (hsa-miR-124 and hsa-miR-7) regulating three mRNAs (RAP1B, ATF2 and PPM1B) participated in the MAPK signaling pathway. In addition, samples with increased expression levels of hsa-miR-124 and hsa-miR-7 had better prognosis. Expression levels of miR-124 in the metastatic osteosarcoma tissues were revealed to be significantly lower than those observed in non-metastatic tissues, and miR-124 could function as a tumor suppressor miRNA in osteosarcoma through the inhibition of Rac family small guanosine triphosphatase 1 expression (46). In addition, miR-7 expression was decreased in osteosar-coma tissues and low miR-7 expression was associated with poor prognosis (47). Furthermore, the roles of hsa-miR-124 and hsa-miR-7 in osteosarcoma recurrence were also validated using another independent miRNA profile in the present study.
Kaplan-Meier survival analysis revealed that samples with lower expression levels of LINC00323 and SNHG1 had better prognosis, which were consistent with a study by Wang et al (48), which demonstrated that SNHG1 was upregulated in osteosarcoma tissues and cell lines, and high SNHG1 expression predicted poor overall survival in patients with osteosarcoma; these findings were consistent with the present results. Wang et al (48) reported that SNHG1 increased human nin one binding protein (an oncogene) by acting as a ceRNA to sponge miR-326, promoting cell growth, migration and invasion in osteosarcoma, while the present study revealed that SNHG1 increased ATF2, PPM1B and RAP1B by sponging miR-124 and miR-7 as a ceRNA. In addition, high SNHG1 expression was also positively associated with the metastasis of osteosarcoma, and miR-577 could act as a ceRNA of SNHG1 by targeting WNT2B which served an oncogenic role in osteosarcoma cells by activating the Wnt/β-catenin signaling pathway (49). Therefore, the present study showed that the SNHG1/miR-124 and miR-7/RAP1B, ATF2 and PPM1B/MAPK signaling pathway regulatory network may provide a potential novel therapeutic strategy for osteosarcoma treatment.
In conclusion, three lncRNAs (LINC00028, LINC00323 and SNHG1) and two miRNAs (hsa-miR-124 and hsa-miR-7) regulating three mRNAs (RAP1B, ATF2 and PPM1B) participated in MAPK signaling pathway, as identified by the ceRNA regulatory network, and were associated with osteosarcoma recurrence. However, the prognosis prediction value based on the expressions of these important RNAs still requires further confirmation based on clinical experiments in an independent cohort of patients with non-recurrent and recurrent osteosarcoma.
Acknowledgments
Not applicable.
Funding
No funding was received.
Availability of data and materials
The datasets used and/or analyzed during the present study are available from the corresponding author on reasonable request.
Authors' contributions
SZ and HF contributed to the study design. SZ, LD, XL and HF searched for and downloaded the gene expression profiles from the Gene Expression Omnibus database. SZ, LD, XL and HF performed the analysis and interpretation of the microarray dataset. SZ and HF critically revised the manuscript for important intellectual content. All authors read and approved the final manuscript.
Ethics approval and consent to participate
Not applicable.
Patient consent for publication
Not applicable.
Competing interests
The authors declare that they have no competing interests.
References
- 1.Geller DS, Gorlick R. Osteosarcoma: A review of diagnosis, management, and treatment strategies. Clin Adv Hematol Oncol. 2010;8:705–718. [PubMed] [Google Scholar]
- 2.He H, Ni J, Huang J. Molecular mechanisms of chemoresistance in osteosarcoma (Review) Oncol Lett. 2014;7:1352–1362. doi: 10.3892/ol.2014.1935. [DOI] [PMC free article] [PubMed] [Google Scholar]
- 3.Liu JJ, Liu S, Wang JG, Zhu W, Hua YQ, Sun W, Cai ZD. Telangiectatic osteosarcoma: A review of literature. Onco Targets Ther. 2013;6:593–602. doi: 10.2147/OTT.S41351. [DOI] [PMC free article] [PubMed] [Google Scholar]
- 4.McQueen P, Ghaffar S, Guo Y, Rubin EM, Zi X, Hoang BH. The Wnt signaling pathway: Implications for therapy in osteosarcoma. Expert Rev Anticancer Ther. 2011;11:1223–1232. doi: 10.1586/era.11.94. [DOI] [PubMed] [Google Scholar]
- 5.Lin CH, Ji T, Chen CF, Hoang BH. Wnt signaling in osteosarcoma. Adv Exp Med Biol. 2014;804:33–45. doi: 10.1007/978-3-319-04843-7_2. [DOI] [PubMed] [Google Scholar]
- 6.McManus MM, Weiss KR, Hughes DP. Understanding the role of Notch in osteosarcoma. Adv Exp Med Biol. 2014;804:67–92. doi: 10.1007/978-3-319-04843-7_4. [DOI] [PubMed] [Google Scholar]
- 7.Graziano AC, Cardile V, Avola R, Vicario N, Parenti C, Salvatorelli L, Magro G, Parenti R. Wilms' tumor gene 1 silencing inhibits proliferation of human osteosarcoma MG-63 cell line by cell cycle arrest and apoptosis activation. Oncotarget. 2017;8:13917–13931. doi: 10.18632/oncotarget.14715. [DOI] [PMC free article] [PubMed] [Google Scholar]
- 8.Zhang F, Yan T, Guo W, Sun K, Wang S, Bao X, Liu K, Zheng B, Zhang H, Ren T. Novel oncogene COPS3 interacts with beclin1 and Raf-1 to regulate metastasis of osteosarcoma through autophagy. J Exp Clin Cancer Res. 2018;37:135. doi: 10.1186/s13046-018-0791-6. [DOI] [PMC free article] [PubMed] [Google Scholar]
- 9.Chan LH, Wang W, Yeung W, Deng Y, Yuan P, Mak KK. Hedgehog signaling induces osteosarcoma development through Yap1 and H19 overexpression. Oncogene. 2014;33:4857–4866. doi: 10.1038/onc.2013.433. [DOI] [PubMed] [Google Scholar]
- 10.Zhou S, Yu L, Xiong M, Dai G. LncRNA SNHG12 promotes tumorigenesis and metastasis in osteosarcoma by upregulating Notch2 by sponging miR-195-5p. Biochem Biophys Res Commun. 2018;495:1822–1832. doi: 10.1016/j.bbrc.2017.12.047. [DOI] [PubMed] [Google Scholar]
- 11.Wang Y, Zhao Z, Zhang S, Li Z, Li D, Yang S, Zhang H, Zeng X, Liu J. LncRNA FAL1 is a negative prognostic biomarker and exhibits pro-oncogenic function in osteosarcoma. J Cell Biochem. 2018;119:8481–8489. doi: 10.1002/jcb.27074. [DOI] [PubMed] [Google Scholar]
- 12.Tian ZZ, Guo XJ, Zhao YM, Fang Y. Decreased expression of long non-coding RNA MEG3 acts as a potential predictor biomarker in progression and poor prognosis of osteosarcoma. Int J Clin Exp Pathol. 2015;8:15138–15142. [PMC free article] [PubMed] [Google Scholar]
- 13.Wang Y, Kong D. Knockdown of lncRNA MEG3 inhibits viability, migration, and invasion and promotes apoptosis by sponging miR-127 in osteosarcoma cell. J Cell Biochem. 2018;119:669–679. doi: 10.1002/jcb.26230. [DOI] [PubMed] [Google Scholar]
- 14.Zhou Q, Chen F, Fei Z, Zhao J, Liang Y, Pan W, Liu X, Zheng D. Genetic variants of lncRNA HOTAIR contribute to the risk of osteosarcoma. Oncotarget. 2016;7:19928–19934. doi: 10.18632/oncotarget.7957. [DOI] [PMC free article] [PubMed] [Google Scholar]
- 15.Ma B, Li M, Zhang L, Huang M, Lei JB, Fu GH, Liu CX, Lai QW, Chen QQ, Wang YL. Upregulation of long non-coding RNA TUG1 correlates with poor prognosis and disease status in osteosarcoma. Tumour Biol. 2016;37:4445–4455. doi: 10.1007/s13277-015-4301-6. [DOI] [PubMed] [Google Scholar]
- 16.Li F, Cao L, Hang D, Wang F, Wang Q. Long non-coding RNA HOTTIP is up-regulated and associated with poor prognosis in patients with osteosarcoma. Int J Clin Exp Pathol. 2015;8:11414–11420. [PMC free article] [PubMed] [Google Scholar]
- 17.Salmena L, Poliseno L, Tay Y, Kats L, Pandolfi PP. A ceRNA hypothesis: The rosetta stone of a hidden RNA language. Cell. 2011;146:353–358. doi: 10.1016/j.cell.2011.07.014. [DOI] [PMC free article] [PubMed] [Google Scholar]
- 18.Kelly AD, Haibe-Kains B, Janeway KA, Hill KE, Howe E, Goldsmith J, Kurek K, Perez-Atayde AR, Francoeur N, Fan JB, et al. MicroRNA paraffin-based studies in osteosarcoma reveal reproducible independent prognostic profiles at 14q32. Genome Med. 2013;5:2. doi: 10.1186/gm406. [DOI] [PMC free article] [PubMed] [Google Scholar]
- 19.Bolstad B. PreprocessCore: A collection of pre-processing functions. R package version 1. 2013 [Google Scholar]
- 20.Smyth GK. Limma: Linear models for microarray data Bioinformatics computational biology Solutions Using R Bioconductor. Springer; 2005. pp. 397–420. [Google Scholar]
- 21.Rao Y, Lee Y, Jarjoura D, Ruppert AS, Liu CG, Hsu JC, Hagan JP. A comparison of normalization techniques for microRNA microarray data. Stat Appl Genet Mol Biol. 2008;7:Article22. doi: 10.2202/1544-6115.1287. [DOI] [PubMed] [Google Scholar]
- 22.Yates B, Braschi B, Gray KA, Seal RL, Tweedie S, Bruford EA. Genenames.org: The HGNC and VGNC resources in 2017. Nucleic Acids Res. 2017;45:D619–D625. doi: 10.1093/nar/gkw1033. [DOI] [PMC free article] [PubMed] [Google Scholar]
- 23.Benjamini Y, Hochberg Y. Controlling the false discovery rate: A practical and powerful approach to multiple testing. J Royal Stat Soc Series B. 1995;57:289–300. [Google Scholar]
- 24.Wang L, Cao C, Ma Q, Zeng Q, Wang H, Cheng Z, Zhu G, Qi J, Ma H, Nian H, Wang Y. RNA-seq analyses of multiple meristems of soybean: Novel and alternative transcripts, evolutionary and functional implications. BMC Plant Biol. 2014;14:169. doi: 10.1186/1471-2229-14-169. [DOI] [PMC free article] [PubMed] [Google Scholar]
- 25.Gosling C. Encyclopedia of distances. Reference Rev. 2009;24:1–583. [Google Scholar]
- 26.Wang P, Wang Y, Hang B, Zou X, Mao JH. A novel gene expression-based prognostic scoring system to predict survival in gastric cancer. Oncotarget. 2016;7:55343–55351. doi: 10.18632/oncotarget.10533. [DOI] [PMC free article] [PubMed] [Google Scholar]
- 27.Huang Da W, Sherman BT, Lempicki RA. Systematic and integrative analysis of large gene lists using DAVID bioinformatics resources. Nature Protoc. 2009;4:44–57. doi: 10.1038/nprot.2008.211. [DOI] [PubMed] [Google Scholar]
- 28.Li JH, Liu S, Zhou H, Qu LH, Yang JH. starBase v2.0: Decoding miRNA-ceRNA, miRNA-ncRNA and protein-RNA interaction networks from large-scale CLIP-Seq data. Nucleic Acids Res. 2014;42:D92–D97. doi: 10.1093/nar/gkt1248. [DOI] [PMC free article] [PubMed] [Google Scholar]
- 29.Agarwal V, Bell GW, Nam JW, Bartel DP. Predicting effective microRNA target sites in mammalian mRNAs. Elife. 2015;12:4. doi: 10.7554/eLife.05005. [DOI] [PMC free article] [PubMed] [Google Scholar]
- 30.Lee YY, Kim TJ, Kim JY, Choi CH, Do IG, Song SY, Sohn I, Jung SH, Bae DS, Lee JW, Kim BG. Genetic profiling to predict recurrence of early cervical cancer. Gynecol Oncol. 2013;131:650–654. doi: 10.1016/j.ygyno.2013.10.003. [DOI] [PubMed] [Google Scholar]
- 31.Jeggari A, Marks DS, Larsson E. miRcode: A map of putative microRNA target sites in the long non-coding transcriptome. Bioinformatics. 2012;28:2062–2063. doi: 10.1093/bioinformatics/bts344. [DOI] [PMC free article] [PubMed] [Google Scholar]
- 32.Kozomara A, Griffiths-Jones S. miRBase: Annotating high confidence microRNAs using deep sequencing data. Nucleic Acids Res. 2014;42:D68–D73. doi: 10.1093/nar/gkt1181. [DOI] [PMC free article] [PubMed] [Google Scholar]
- 33.Shannon P, Markiel A, Ozier O, Baliga NS, Wang JT, Ramage D, Amin N, Schwikowski B, Ideker T. Cytoscape: A software environment for integrated models of biomolecular interaction networks. Genome Res. 2003;13:2498–2504. doi: 10.1101/gr.1239303. [DOI] [PMC free article] [PubMed] [Google Scholar]
- 34.Subramanian A, Tamayo P, Mootha VK, Mukherjee S, Ebert BL, Gillette MA, Paulovich A, Pomeroy SL, Golub TR, Lander ES, Mesirov JP. Gene set enrichment analysis: A knowledge-based approach for interpreting genome-wide expression profiles. Proc Natl Acad Sci USA. 2005;102:15545–15550. doi: 10.1073/pnas.0506580102. [DOI] [PMC free article] [PubMed] [Google Scholar]
- 35.Davis AP, Grondin CJ, Johnson RJ, Sciaky D, King BL, McMorran R, Wiegers J, Wiegers TC, Mattingly CJ. The comparative toxicogenomics database: Update 2017. Nucleic Acids Res. 2017;45:D972–D978. doi: 10.1093/nar/gkw838. [DOI] [PMC free article] [PubMed] [Google Scholar]
- 36.He JP, Hao Y, Wang XL, Yang XJ, Shao JF, Guo FJ, Feng JX. Review of the molecular pathogenesis of osteosarcoma. Asian Pac J Cancer Prev. 2014;15:5967–5976. doi: 10.7314/APJCP.2014.15.15.5967. [DOI] [PubMed] [Google Scholar]
- 37.Wang B, Su Y, Yang Q, Lv D, Zhang W, Tang K, Wang H, Zhang R, Liu Y. Overexpression of long non-coding RNA HOTAIR promotes tumor growth and metastasis in human osteosarcoma. Mol Cells. 2015;38:432–440. doi: 10.14348/molcells.2015.2327. [DOI] [PMC free article] [PubMed] [Google Scholar] [Retracted]
- 38.Zhang Q, Geng PL, Yin P, Wang XL, Jia JP, Yao J. Down-regulation of long non-coding RNA TUG1 inhibits osteo-sarcoma cell proliferation and promotes apoptosis. Asian Pac J Cancer Prev. 2013;14:2311–2325. doi: 10.7314/APJCP.2013.14.4.2311. [DOI] [PubMed] [Google Scholar]
- 39.Sui X, Kong N, Ye L, Han W, Zhou J, Zhang Q, He C, Pan H. p38 and JNK MAPK pathways control the balance of apoptosis and autophagy in response to chemotherapeutic agents. Cancer Lett. 2014;344:174–179. doi: 10.1016/j.canlet.2013.11.019. [DOI] [PubMed] [Google Scholar]
- 40.Chen HJ, Lin CM, Lee CY, Shih NC, Peng SF, Tsuzuki M, Amagaya S, Huang WW, Yang JS. Kaempferol suppresses cell metastasis via inhibition of the ERK-p38-JNK and AP-1 signaling pathways in U-2 OS human osteosarcoma cells. Oncol Rep. 2013;30:925–932. doi: 10.3892/or.2013.2490. [DOI] [PubMed] [Google Scholar]
- 41.Cheng DD, Zhu B, Li SJ, Yuan T, Yang QC, Fan CY. Down-regulation of RPS9 inhibits osteosarcoma cell growth through inactivation of MAPK signaling pathway. J Cancer. 2017;8:2720–2728. doi: 10.7150/jca.19130. [DOI] [PMC free article] [PubMed] [Google Scholar]
- 42.Cheng S, Zhang X, Huang N, Qiu Q, Jin Y, Jiang D. Down-regulation of S100A9 inhibits osteosarcoma cell growth through inactivating MAPK and NF-κB signaling pathways. BMC Cancer. 2016;16:253. doi: 10.1186/s12885-016-2294-1. [DOI] [PMC free article] [PubMed] [Google Scholar]
- 43.Li L, Liang S, Wasylishen AR, Zhang Y, Yang X, Zhou B, Shan L, Han X, Mu T, Wang G, Xiong S. PLA2G16 promotes osteosarcoma metastasis and drug resistance via the MAPK pathway. Oncotarget. 2016;7:18021–18035. doi: 10.18632/oncotarget.7694. [DOI] [PMC free article] [PubMed] [Google Scholar]
- 44.Kang HM, Park BS, Kang HK, Park HR, Yu SB, Kim IR. Delphinidin induces apoptosis and inhibits epithelial-to-mesenchymal transition via the ERK/p38 MAPK-signaling pathway in human osteosarcoma cell lines. Environ Toxicol. 2018;33:640–649. doi: 10.1002/tox.22548. [DOI] [PMC free article] [PubMed] [Google Scholar]
- 45.Zhang Y, Hu Q, Li G, Li L, Liang S, Zhang Y, Liu J, Fan Z, Li L, Zhou B, et al. ONZIN upregulation by mutant p53 contributes to osteosarcoma metastasis through the CXCL5-MAPK signaling pathway. Cell Physiol Biochem. 2018;48:1099–1111. doi: 10.1159/000491976. [DOI] [PubMed] [Google Scholar]
- 46.Geng S, Zhang X, Chen J, Liu X, Zhang H, Xu X, Ma Y, Li B, Zhang Y, Bi Z, Yang C. The tumor suppressor role of miR-124 in osteosarcoma. PLoS one. 2014;9:e91566. doi: 10.1371/journal.pone.0091566. [DOI] [PMC free article] [PubMed] [Google Scholar] [Retracted]
- 47.Shouying L, Changxi Z, Changbao Z, Qiuhe S, Ming W, Ye L, Huaijie A. Low-expression of miR-7 promotes cell proliferation and exhibits prognostic value in osteosarcoma patients. Int J Clin Exp Pathol. 2017;10:9035–9041. [PMC free article] [PubMed] [Google Scholar]
- 48.Wang J, Cao L, Wu J, Wang Q. Long non-coding RNA SNHG1 regulates NOB1 expression by sponging miR-326 and promotes tumorigenesis in osteosarcoma. Int J Oncol. 2018;52:77–88. doi: 10.3892/ijo.2017.4187. [DOI] [PMC free article] [PubMed] [Google Scholar]
- 49.Jiang Z, Jiang C, Fang J. Up-regulated lnc-SNHG1 contributes to osteosarcoma progression through sequestration of miR-577 and activation of WNT2B/Wnt/β-catenin pathway. Biochem Biophys Res Commun. 2018;495:238–245. doi: 10.1016/j.bbrc.2017.11.012. [DOI] [PubMed] [Google Scholar]
Associated Data
This section collects any data citations, data availability statements, or supplementary materials included in this article.
Data Availability Statement
The datasets used and/or analyzed during the present study are available from the corresponding author on reasonable request.


