. 2019 Mar 12;8:e41431. doi: 10.7554/eLife.41431

Figure 2. Temporal proteomic analysis of HIV infection in primary T cells.

(A) Overview of time course proteomic experiment. Control (pale grey, resting/activated/mock) and experimental (dark grey, resting/activated; red, LNGFR+, HIV-infected, selected; blue, LNGFR-, uninfected, flow-through) cells are indicated for each condition/time point. (B) Magnetic sorting of HIV-infected (red, LNGFR+, selected) cells used for (A). Corresponding uninfected (LNGFR-, flow-through) cells are shown in Figure 2—figure supplement 1A. Cells were separated using AFMACS at the indicated time points post-infection with HIV-AFMACS, stained with anti-LNGFR and anti-CD4 antibodies and analysed by flow cytometry. Mock-infected cells are shown in grey. (C) Expression profiles of illustrative restriction factors regulated by T cell activation and HIV infection (tetherin) or T cell activation alone (SAMHD1) in cells from (A–B). Relative abundances (bars, fraction of maximum) and log2(ratio)s of abundances (lines) in experimental (Expt):control (Ctrl) cells are shown for each condition/time point and coloured as in (A) (summarised in the key). (D) Expression profiles of illustrative accessory protein targets (CD4, Nef/Vpu; SERINC5, Nef; SNAT1, Vpu; APOBEC3G, Vif; PPP2R5D, Vif; UNG, Vpr) in cells from (A–B). Axes, scales and colours are as in (C). Expression profiles of other accessory protein targets are shown in Figure 2—figure supplement 1B. (E) Patterns of temporal regulation of Vpr vs other accessory protein (Vif/Nef/Vpu) targets in cells from (A–B). Log2(ratio)s of abundances in experimental (Expt):control (Ctrl) cells are shown for 45 accessory protein targets (as in Figure 2—figure supplement 3A). Colours are as in (C), and average profiles (mean, black lozenges/dotted lines) are highlighted for each group of targets.

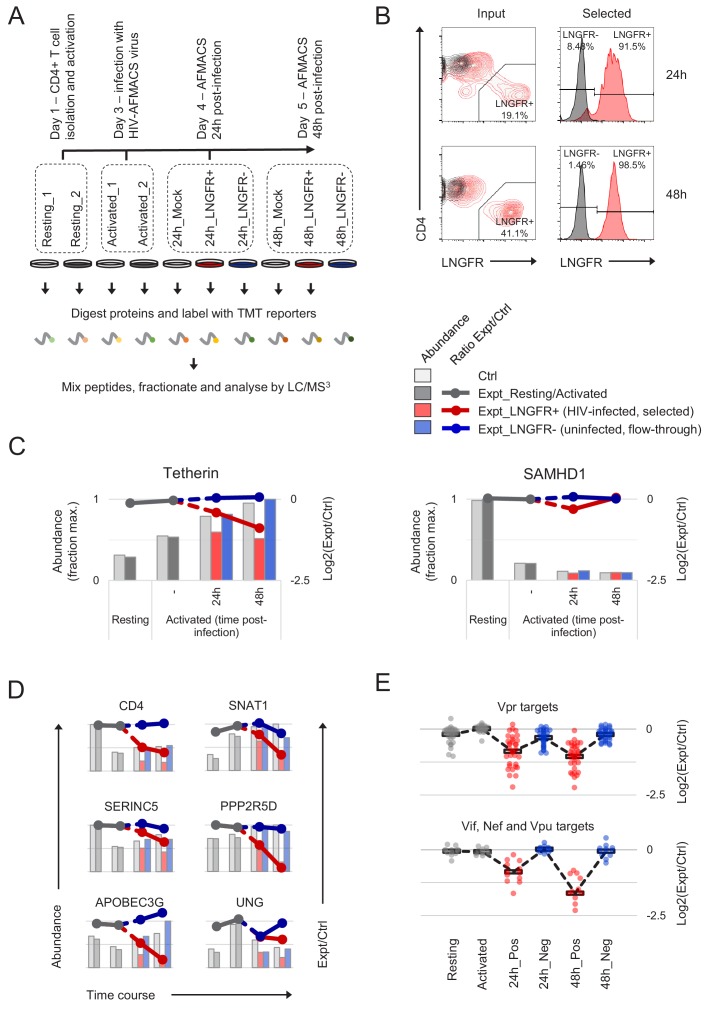
Figure 2—source data 1. Functional proteomic atlas of HIV-infection in primary human CD4+ T cells.
Interactive spreadsheet enabling generation of temporal profiles of protein abundance for any quantitated genes of interest (‘Gene search and plots’ worksheet). Time course data (cells from Figure 2A) are presented as in Figure 2C, with relative protein abundances (fraction of maximum) for each condition depicted by bars, and log2(ratio)s of protein abundances in paired experimental/control cells from each condition/time point depicted by lines (grey, resting/activated; red, LNGFR+, infected; blue, LNGFR-, uninfected). Single time point data (cells from Figure 3A) are presented as in Figure 3D, with relative protein abundances (fraction of maximum, mean plus 95% CIs) for each condition depicted by bars (grey, mock; red, WT HIV; green, ΔVif HIV). The number of unique peptides is shown for each protein/experiment, with most confidence reserved for proteins with values > 1. For the single time point experiment, p values (unadjusted) and q values (Benjamini-Hochberg FDR-adjusted) are shown (highlighted in gold if <0.05). Complete (unfiltered) proteomic datasets (‘Time course dataset’ and ‘Single time point dataset’ worksheets) are also included.
DOI: 10.7554/eLife.41431.006

Figure 2.

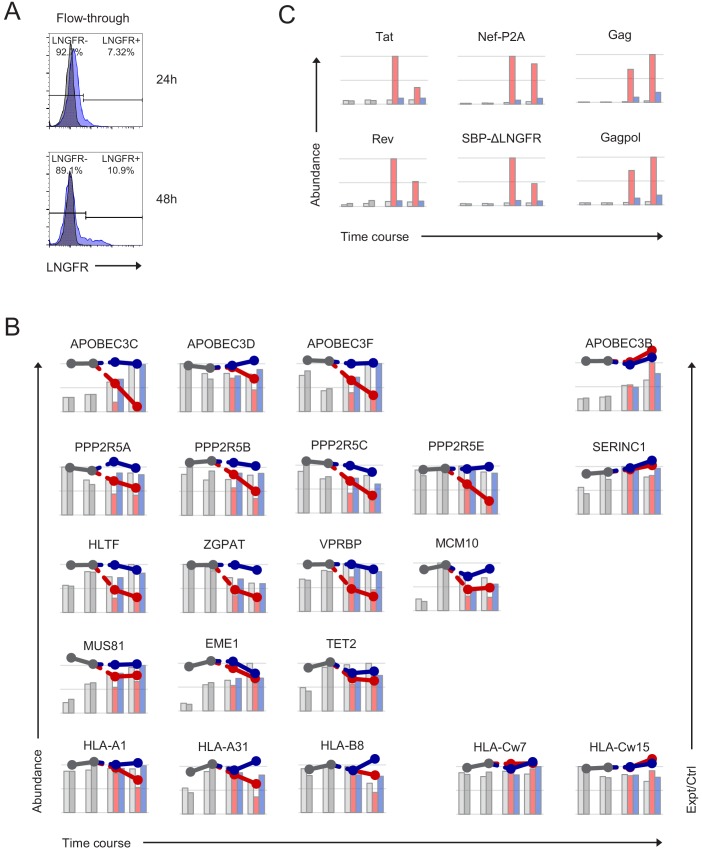
Figure 2—figure supplement 1. Additional controls for time course proteomic experiment.

Figure 2—figure supplement 1.

(A) Uninfected (blue, LNGFR-, flow-through) cells used for time course proteomic experiment (Figure 2A). Corresponding HIV-infected (LNGFR+, selected) cells are shown in Figure 2B. Cells were separated using AFMACS at the indicated time points post-infection with HIV-AFMACS, stained with anti-LNGFR and anti-CD4 antibodies and analysed by flow cytometry. Mock-infected cells are shown in grey. (B–C) Expression profiles of accessory protein targets (B) (APOBEC3 and PPP2R5 family proteins, Vif; HLA-A/B alleles, Nef; other downregulated proteins, Vpr) and viral proteins (C) from time course proteomic experiment (Figure 2A). Axes, scales and colours are as in Figure 2C with the exception of APOBEC3C (range of log2(Expt/Ctrl) 0 to −4 rather than 0 to −2.5). SERINC1, APOBEC3B and HLA-C alleles are included as controls. Only HLA alleles quantitated by >1 unique peptide, canonical isoforms of PPP2R5C (Q13362) and ZGPAT (Q8N5A5), and 6/7 viral proteins with no missing values are included. Since viral proteins are not expressed in control (Ctrl) cells, log2(ratio)s of abundances in Expt:Ctrl cells are not shown.
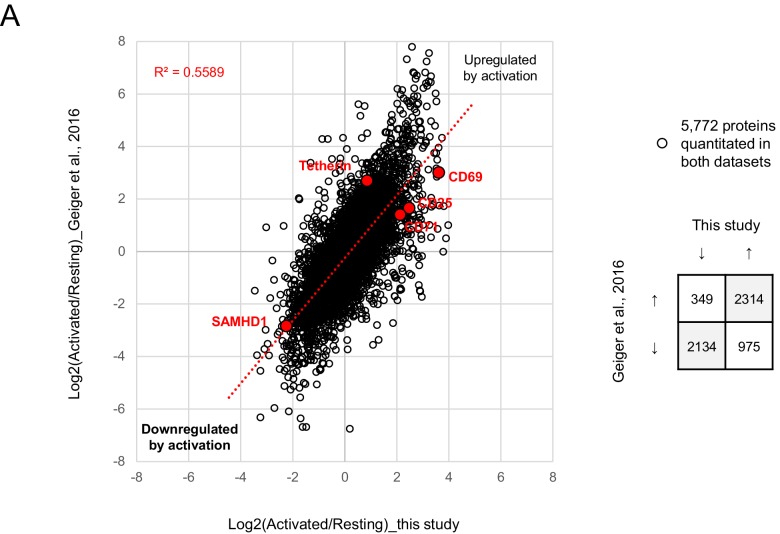
Figure 2—figure supplement 2. Comparison with T cell activation-dependent changes in Geiger et al. (2016).

Figure 2—figure supplement 2.

Protein abundances in activated vs resting primary human CD4 +T cells from this study (x axis; time course proteomic experiment, Figure 2A) or Geiger et al. (2016) (y axis). Fold changes are compared for proteins quantitated from at least 2 samples of resting and activated cells in both datasets. Together with tetherin and SAMHD1 (Figure 2C), canonical T cell activation markers CD69, CD25 (IL2RA, IL-2 receptor alpha chain) and CD71 (TFRC, transferrin receptor) are also highlighted (red).
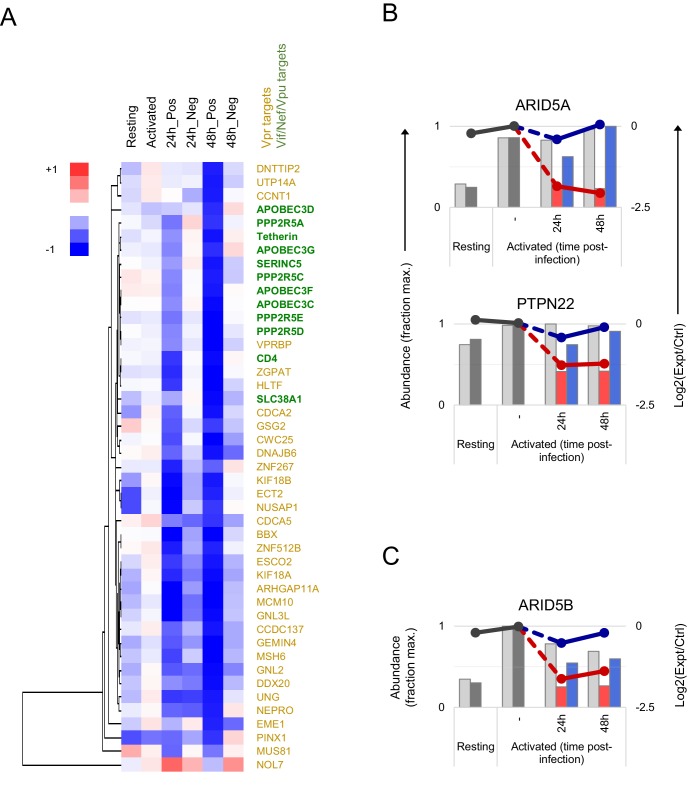
Figure 2—figure supplement 3. Temporal clustering of HIV accessory protein targets.

Figure 2—figure supplement 3.

(A) Hierarchical cluster analysis of 45 accessory protein targets according to profiles of temporal expression from time course proteomic experiment (Figure 2A). Vpr (gold) vs other accessory protein (Vif/Nef/Vpu; green) targets are highlighted. The heatmap shows range-scaled log2(ratio)s of abundances in experimental (Expt):control (Ctrl) cells for each condition/time point. Unscaled data for the same proteins are shown in Figure 2E. (B–C) Expression profiles of ARID5A, PTPN22 (B) and AIRD5B (C) from time course proteomic experiment (Figure 2A). Axes, scales and colours are as in Figure 2C.