

Abstract
DNA mutations as a consequence of errors during DNA damage repair, replication, or mitosis are the substrate for evolution. In multicellular organisms, mutations can occur in the germline and also in somatic tissues, where they are associated with cancer and other chronic diseases and possibly with aging. Recent advances in high-throughput sequencing have made it relatively easy to study germline de novo mutations, but in somatic cells, the vast majority of mutations are low-abundant and can be detected only in clonal lineages, such as tumors, or single cells. Here we review recent results on somatic mutations in normal human and animal tissues with a focus on their possible functional consequences.
Keywords: somatic mutation, tissue specificity, single-cell DNA sequencing, aging, cancer
INTRODUCTION
When DNA was first identified as the carrier of genetic information it was generally assumed to be a very stable molecule (130). However, later it became clear that under physiological conditions DNA is highly vulnerable to damage varying from hydrolysis and alkylation to oxidation (78). Most of the apparent stability of the DNA of the genome is rendered by a highly conserved system of genome maintenance mechanisms (60). In the history of life, genes encoding DNA damage repair were likely among the first genetic traits selected for a survival advantage to the protocells that begantouse DNA instead of the even more vulnerable RNA (24). As we now know, the many different, often interconnected genome maintenance systems play a critical role in eliminating the many thousands of chemical lesions generated each day in a typical cell (78). Genome maintenance systems are responsible for the fact that spontaneous DNA damage, even with the most advanced techniques available, is barely detectable in genomic DNA of a typical human or animal organism (21).
DNA damage should be distinguished from DNA mutations. Whereas DNA damage involves physical alterations in DNA structure—for example, breaks, depurination, depyrimidination, crosslinks, or modified bases—DNA mutations arise as errors during DNA damage repair, DNA replication, or mitosis. DNA mutations are changes in the genetic code, varying from the very large chromosomal aberrations and copy number variations (CNVs) to smaller deletions and insertions and base substitutions (Figure 1). Together, DNA mutations represent the phenomenon of genome instability, generally considered a hallmark of disease, such as cancer (98), and aging (82). Hence, while DNA damage can be repaired, DNA mutations cannot be recognized by repair enzymes and are irreversible. Indeed, mutations can be removed only through the death of the cell or the entire organism.
Figure 1.
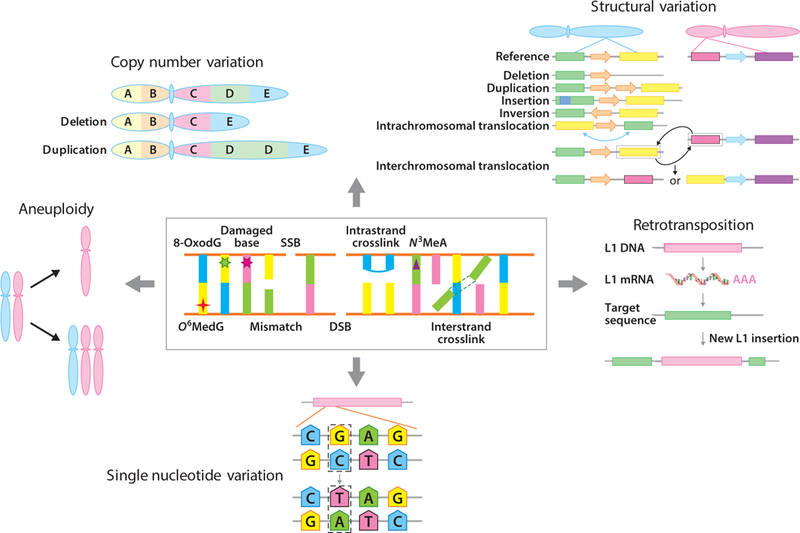
DNA damage and DNA mutations. Erroneous repair of the different types of DNA damage that occur in cells under physiological conditions can result in multiple types of mutations, including chromosomal mutations, copy number variation, structural variation, retrotransposition, and single nucleotide variation. There are a great many different types of DNA damage and only a few examples are given. Only rarely do we know the exact types of mutation(s) that can result from the erroneous repair of a particular lesion. An example is 8-oxoguanine, a common oxidative DNA lesion, which typically generates G:C→T:A transversions via mispairing with A during DNA replication. We also know that genome structural variations can result from DNA DSBs. Mutations, most notably aneuploidy, which occurs as a consequence of mitotic errors, do not necessarily require DNA damage but can be induced spontaneously. Abbreviations: 8-OxodG, 8-oxo-2′-deoxyguanosine; DSB, double-strand break; L1, LINE-1; mRNA, messenger RNA; N3MeA, N3-methyladenine; O6MedG, 6-O-methyldeoxyguanosine; SSB, single-strand break.
Mutations underlie the constant generation of genetic variation in organisms, and, together with natural selection, they drive evolution. Mutation rates are themselves subject to natural selection and differ greatly between species (9, 116). Indeed, as first noted by Sturtevant (116) the genetic material is mutable at a rate subject to natural selection. When the rate is too high, a species may become extinct, whereas when the rate is too low, it prevents adaptability—or the capacity to respond to environmental change—which may also lead to extinction. Mutation rates are also unlikely to be driven to zero because of the fitness costs associated with excessive investment in replication fidelity (9, 66) and because genetic drift acts as a natural barrier to further perfection of molecular information transfer (83). Hence, genome in stability, at least in the germline, is inherent to life and necessary for its continuation. This situation is different for multicellular organisms in which germline mutations should be distinguished from mutations in cells of the soma.
SOMATIC MUTATIONS: HOW THEY DIFFER FROM GERMLINE MUTATIONS AND WHY THEY ARE SO DIFFICULT TO MEASURE
In unicellular organisms, germline mutations are the same as somatic mutations. With the emergence of multicellular organisms, mutations in the germ cells and mutations in the rest of the soma became distinct; they took on different criteria for natural selection. In principle, somatic mutation rates should follow germline mutation rates. However, unlike germline mutations, somatic mutations are not necessary to maintain genetic diversity and their rate could at least in principle drive to zero.
As in the germline, excessive replication fidelity is associated with fitness costs in the soma of multicellular organisms, but the soma also follows its own rules as first described by Weismann (131) in 1893. In his book The Germ-Plasm: A Theory of Heredity, Weismann recognized a distinction between the germ plasm and the soma and argued for a substance in the germ cells that carries hereditary information, now known to be DNA. He thought this substance was also present in the somatic cells, from which it could not be further transmitted to the next generation. In other words, mutations in somatic cells do not end up in the germline.
These accumulating discoveries became the basis of the disposable soma theory, which argued that multicellular organisms with a clear distinction between germline and soma have no vested interest in maintaining the soma indefinitely (67). Furthermore, they gave rise to the idea that aging and its accompanying increase indisease incidence are caused by unrepaired somatic damage, including DNA damage (68). Thus, natural selection works only until the age of reproduction to keep somatic mutation frequency from rising above a level that no longer permits optimal cellular functioning. While in keeping with this idea of somatic mutations as a cause of aging and cancer (see the section titled Consequences of Somatic Mutations), this explanation does not specify if the somatic mutation rate is higher or lower than the germline mutation rate. Indeed, despite the recent rise in next-generation sequencing platforms that have resulted in a wealth of information on germline mutations, the accurate detection of somatic mutations still poses a major challenge.
The human germline mutation rate can be determined in a fairly straightforward manner by DNA sequencing of somatic tissue from parents and children, which allows for a determination of de novo mutations in offspring. The results indicate a human germline de novo mutation rate of 1.0−1.2×10⁻⁸ per nucleotide per generation (22, 73). This finding confirmed earlier indirect estimates (65, 72) as well as those derived from sequencing single sperm cells (129) and corresponds to about 60 new mutations per generation. In each newborn, as many as 10% of these de novo germline mutations are considered deleterious (72), most of these weakly so.
Initiatives such as the 1,000 Genomes Project have resulted in estimates of the number of mutational differences between individuals (7). A typical genome appeared to differ from the reference human genome at 4–5 million sites, virtually all of which are single-nucleotide polymorphisms (SNPs); short indels ranked a distant second at about 10,000 sites. The number of larger genome structural variations (SVs) is much smaller, i.e., about 1,000 large deletions, approximately 700 CNVs, and about 1,000 retrotranspositions [Alu and LINE-1 (L1) insertions]. However, although these SVs are fairly rare, they affect many more bases than the SNPs or small indels, i.e., about 20 million bases of sequence.
An important characteristic of germline mutations is that when they are deleterious, they are eliminated due to purifying selection. Nevertheless, deleterious de novo mutations in the germline do occur and have been shown to contribute significantly to human disease (17). The human germline contains on average about two rare and several hundred common loss-of-function mutations, i.e., genetic variants predicted to disrupt the function of protein-coding genes (27). While selection may also occur to some extent with postzygotic, somatic mutations, especially when occurring early in life, i.e., during embryogenesis, possibilities for selection in most adult tissues are minimal. This makes it important to study somatic mutations experimentally, but this is much more difficult than studying germline mutations. As we have seen, the germline mutation frequency could be determined, once advanced sequencing platforms became available, by comparing somatic DNA from parents and children because, as first postulated in Weismann’s original theory, the germline genotype is also present in the somatic cells. Whole-genome sequencing of a somatic DNA sample essentially gives you the germline genotype. However, de novo mutations in the soma will vary from cell to cell and cannot be detected by sequencing DNA from bulk tissue. De novo somatic mutations occur at low frequency in individual cells at different loci, and they are displayed after sequencing as occasional mutations scattered throughout the reads, similar to sequencing errors but occurring less frequently (Figure 2).
Figure 2.
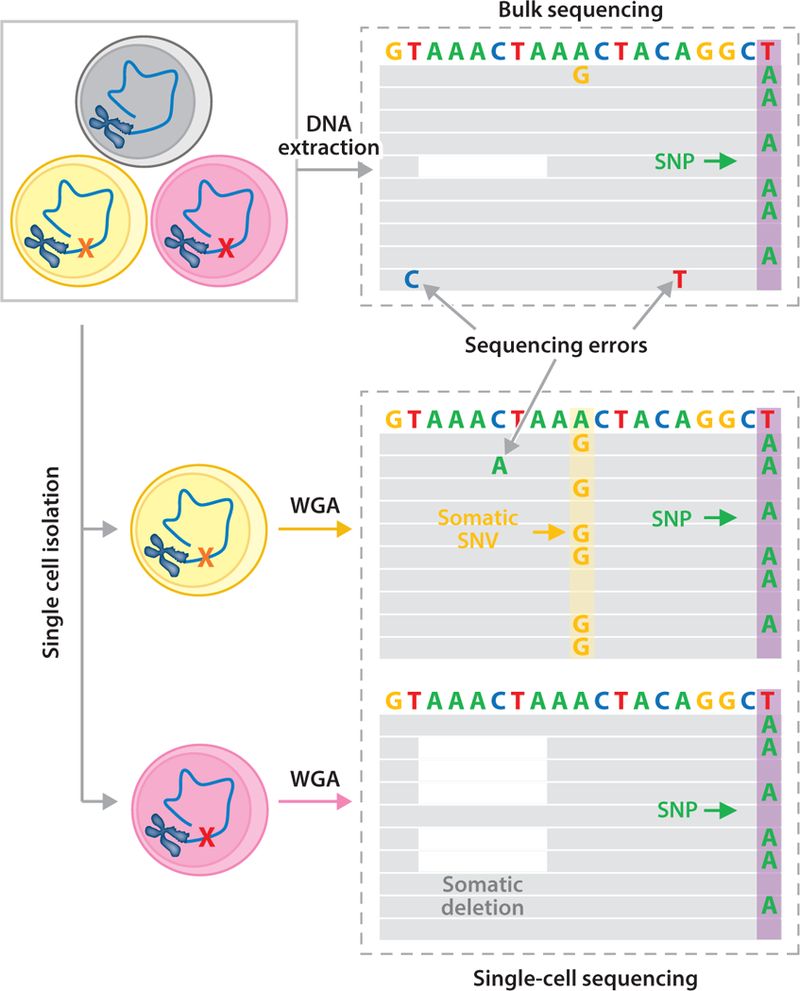
Single-cell analysis detects somatic mutations. Using bulk sequencing, somatic SNVs (e.g., the A→G mutation) and deletions (e.g., the white space) cannot be detected because they are unique to a cell (the yellow and red cells on the left) and, consequently, affect only one out of many thousands of reads. SNVs cannot even be distinguished from sequencing errors, which occur at a much higher frequency than somatic mutations, i.e., 1/100. These low-abundant SNVs and deletions can only be detected using single-cell sequencing, through which a heterozygous mutation will be observed in approximately half of the reads. Both the A→G mutation and the deletion are now easily identified. A germline variant (e.g., the T→A SNP; purple columns) is detectable in all single cells and in the bulk DNA. Abbreviations: SNP, single-nucleotide polymorphism; SNV, single nucleotide variation, WGA, whole-genome amplification.
Information on somatic mutation rates in humans and animal models has been obtained in indirect ways. The simplest types of mutations, in terms of the availability of suitable methodologies for their detection, are chromosomal alterations; for example, G-banding has enabled the analysis of chromosomal aneuploidy, i.e., gain or loss of entire chromosomes, since the early 1900s (48). More recently, the method of choice for identifying and enumerating such events is fluorescence in situ hybridization (FISH) using locus-specific probes or chromosome painting probes (103, 110), which provides much higher resolution than classical cytogenetic methods. Interphase FISH can be applied even to nondividing cells in tissues such as brain (45) for the detection of aneuploidy. Interestingly, aneuploidy levels, even in postmitotic tissue, appeared to be remarkably high (46, 107)—although this was disputed as a possible artefact of FISH when the latest single-cell sequencing assays were used (71, 121) (see also the section titled Somatic Mutation Analysis by Next-Generation Sequencing of Single Cells). FISH has a low resolution and cannot detect events larger than approximately 5 megabases (Mb). It can also not easily scan genomes in many cells for all possible events of this size. FISH analyses are restricted to the visualization of only a few mouse chromosomes at a time. However, when metaphase plates are available, i.e., in dividing cell populations, spectral karyotyping (SKY) can be used to simultaneously identify large changes in each human chromosome (79). However, the same cannot be accomplished in interphase cells, which is a major drawback in studying chromosomal instability in vivo. Hence, the large chromosomal alterations we know about in postmitotic tissues could well be the tip of an underlying iceberg of different types of mutations.
By far the majority of somatic mutations, including base substitutions, deletions, and genome rearrangements, require other methods for their detection. Such methods have emerged over the last decades; for example, use of the endogenous selectable marker gene, hypoxanthine-guanine phosphoribosyltransferase (HPRT), allows one to assess mutation frequencies in blood cells (3). HPRT is an X-linked gene, and when mitotically active cells are exposed to the toxic nucleotide analog, 6-thioguanine, which is normally incorporated into DNA, this leads to cell death. Hence, only cells with an inactivated HPRT gene due to a mutation survive and grow into clones. The number of such clones relative to the cloning efficiency is a measure of the mutation frequency. In this way, gene-inactivating mutations from point mutations to rearrangements can be detected but only in cells that can be grown in culture. While the HPRT assay has been instrumental in gaining the first understanding of de novo, somatic mutations in humans, its application is basically limited to cells that can be cultured and cloned in vitro. Because the gene is X-linked, the assay is also limited in the type of events that it can detect; it misses, for example, mutations arising from mitotic recombination (113).
TISSUE SPECIFICITIES IN SOMATIC MUTATIONS AT REPORTER LOCI
With the development of transgenic mice harboring reporter genes that could be recovered in Escherichia coli to study mutations that had occurred in the animal, somatic mutations could be analyzed for the first time in any possible target organ of an animal (57, 126). These mouse models remain in use as substitutes for the expensive, long-term rodent bioassays to predict carcinogenicity of environmental compounds (81). One of the most interesting results from the mutation analyses in transgenic reporter mice, and later in flies, was the observed tissue specificity: In one of the transgenic reporter mice with a lacZ reporter gene as part of a plasmid, spontaneous mutations were found to accumulate with age in different organs and tissues (28–30, 100) (Figure 3a), albeit at greatly different rates. Mutation accumulation is much higher in the small intestine than in all other tissues (Figure 3b). This is not surprising in view of the rapid cell division in this organ with ample opportunity for replication errors. Indeed, most of the mutations found to accumulate with age in the small intestine were point mutations (30). However, postmitotic organs such as liver and heart also showed mutation accumulation with age. In these cases, many of the mutations were genome rearrangements. In spleen, also a mitotically active tissue, mutation accumulation was barely significant; the same is true for brain. Similar results were obtained with another type of reporter mouse that harbored a reporter gene as part of a much larger bacteriophage lambda vector (100, 115).
Figure 3.
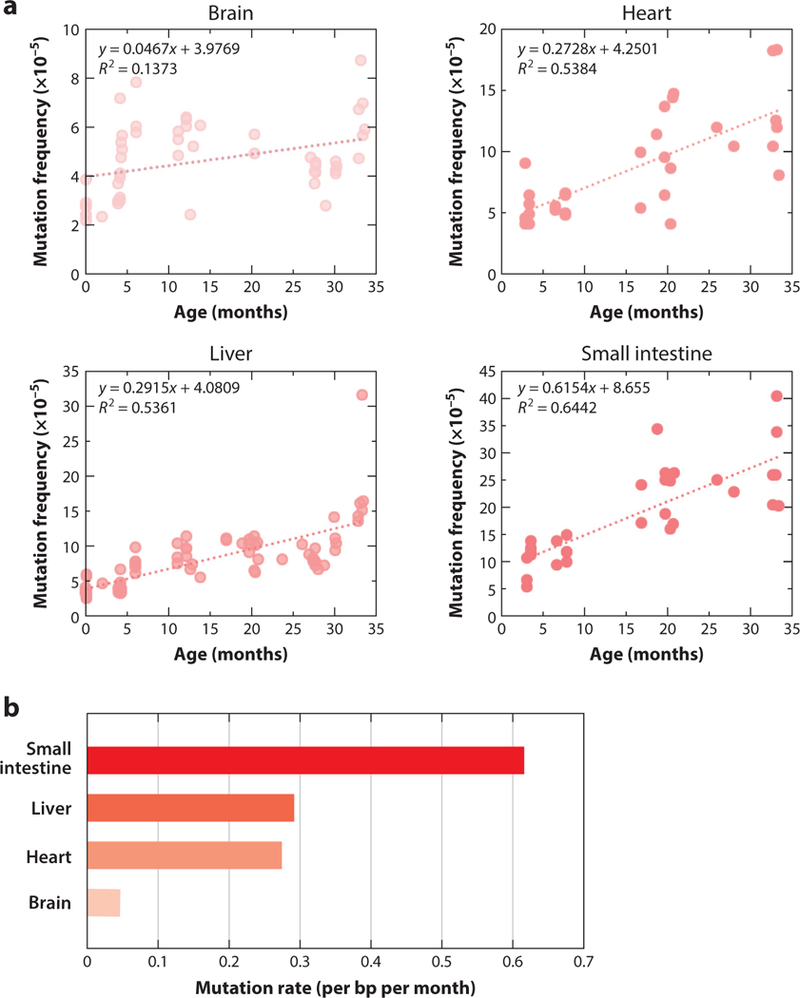
Somatic mutations accumulate with age in four different tissues of the mouse. A transgenic mouse model harboring chromosomally integrated plasmids containing the lacZ reporter gene was used. Plasmids were excised and transferred into Escherichia coli to select for mutants that inactivate the lacZ-encoded beta-galactosidase. (a) Using this model, mutation frequency (y-axis) was determined in brain, heart, liver, and small intestine as a function of the age of the animals. Each determination point is the average of at least five individual mice. (b) Rate of the age-related mutation accumulation in the four tissues. Abbreviation: bp, base pair. Data from References 28 and 30.
Reporter assays are quite sensitive and specific (128), and they quickly became the method of choice for mutagenicity studies in vivo. However, reporter genes, the sizes of which do not exceed approximately 3,000 base pairs (bp), cannot be assumed as representative for the entire genome. They are heavily methylated and not transcribed, which may bias the analysis. Moreover, they do not allow for analysis of the distribution of various mutations across the genome, the investigation of which is essential for understanding the potential impact of somatic mutations in relation to human disease. Needless to say, reporter systems that can be used across organs and tissues are available only for animal models. Therefore, despite the emergence of mutagenicity reporter assays, other tools were needed to comprehensively characterize the total complement of mutations in individual cells across the genome in primary cells and tissues.
In theory, a wide range of somatic mutations could be detected by next-generation sequencing, especially given the dramatic reduction to its cost. However, as already mentioned, because somatic mutations in normal tissues are unique for each individual cell, whole-genome sequencing of DNA from bulk tissue will simply provide the germline mutational landscape. When sequencing at very high depth, one can occasionally find a sequencing read with a true mutation but only when the mutation frequency is very high; for example, Martincorena et al. (86) sequenced 74 genes implicated in skin and other cancers to the very high depth of 500× in small biopsies of sun-exposed, normal skin and found two to six mutations per megabase per cell. Cells harboring such mutations were probably already positively selected for growth. However, after whole-genome sequencing of most normal tissue DNA, virtually all de novo true somatic mutations would drown in the sequencing errors, which are as high as 0.1–1% (5).
Nevertheless, sequencing at high depth does allow the detection of mosaicism, i.e., loci that differ within or between tissues in individuals. Such mutations can be detected when they occur very early in life, i.e., during embryogenesis, or as a consequence of clonal outgrowth in a cell type still mitotically active later in life. For example, an age-related accumulation of clonally expanded CNVs has been found in the blood of up to 4% of individuals (52,62,76). Similarly, the age-related emergence of genomic differences between monozygotic twins who were once identical at an early age has been observed and interpreted as originating from somatic mutation (15). Interestingly, mosaicism of the X chromosome was detected in 0.25% of a large group of women and was found to be four times higher than the mean autosomal rates and to increase with age to about 0.45% (84).
The sensitivity of this kind of bulk DNA analysis is limited to megabase-scale CNVs present in more than 5% of cells. To increase sensitivity, single-cell studies are necessary (see the section titled Somatic Mutation Analysis by Next-Generation Sequencing of Single Cells). Hence, these results reveal only a very small portion of somatic mutations occurring in each independently developing cell. A more comprehensive way of analyzing somatic mutations in individual cells is through clonal lineages. The best example is cancer. Tumors can serve as surrogates for single cells. As clonal expansions of single cells, tumors can provide information about the somatic mutations present in these cells prior to tumorigenesis. When data from The Cancer Genome Atlas were used to systematically study the frequency and spectrum of somatic mutations in thousands of cancer patients and different tumor types as a function of the age of the patient, it was found that the number of identified somatic mutations increases exponentially with age (92). Such aging-related mutations in human tumors were found to have a specific mutation spectrum (4). However, since mutations can also arise after neoplastic transformation and during tumor progression, it is difficult to draw definite conclusions, other than that mutation frequency increases with age.
More recently, whole-genome sequencing of clonal organoid cultures derived from mouse or human primary multipotent cells revealed hundreds of base substitution mutations per genome, which increased with age (11, 13). However, clonal amplification through organoid technology requires extensive cell culture and essentially limits analysis to stem or progenitor cells. Single-cell technology, to which we turn next, allows direct analysis of all types of cells, including postmitotic cells such as neurons and muscle fibers.
SOMATIC MUTATION ANALYSIS BY NEXT-GENERATION SEQUENCING OF SINGLE CELLS
The main challenge with single-cell approaches for mutation detection is the high error rate of whole-genome amplification procedures necessary for single-cell sequencing, which essentially constrains accurate detection of de novo mutations in normal single cells (85). This is especially an issue with base substitution mutations, which are easily induced by DNA damage and during the actual sequencing process itself. It is for this reason that single-cell approaches to somatic mutation analysis were first applied to the study of large mutational events such as aneuploidy, CNV, and specific types of genome SVs—most notably, retrotranspositions. We systematically discuss the results obtained in these studies with a focus on the frequency of somatic mutational events in vivo. These data with the referenced literature from which they were obtained are listed in Table 1.
Table 1.
Summary of somatic mutation frequencies in different tissues
| Tissue or cell type | Method(s) | Mutation number per cell (frequency) | Reference(s) |
|---|---|---|---|
| Aneuploidy (whole chromosome) | |||
| Human embryos | Single-cell SNP and array CGH | 0.4 | 124 |
| Human fetal brain | FISH | 0.3–0.35 | 136 |
| Human brain | Single-cell sequencing | 0.022 | 71 |
| Human cortical neuron | Single-cell sequencing | <0.05 | 16 |
| Human frontal cortex neuron | Single-cell sequencing | 0.03* | 90 |
| Old mouse brain | FISH | ∼0.5 | 46 |
| Mouse brain | Single-cell sequencing | 0.01 | 71 |
| Mouse primary and cultured neuron | SKY analysis | 0.33, 0.14 | 107 |
| Human skin keratinocyte | Single-cell sequencing | 0 | 71 |
| Mouse skin keratinocyte | Single-cell sequencing | 0.027 | 71 |
| Human hepatocyte | FISH | >0.5, >0.6 | 34, 36 |
| Human hepatocyte | Single-cell sequencing | 0.04 | 71 |
| Mouse lymphocyte | SKY analysis | 0.03 | 107 |
| Copy number variation (>1 Mb) | |||
| Human embryos | Single-cell SNP and CGH array | 0.7 | 124 |
| Human neuron | Single-cell sequencing | 0.09 | 70 |
| Human cortical neuron | Single-cell sequencing | 3.4 | 16 |
| Human frontal cortex neuron | Single-cell sequencing | 0.13–0.41 | 90 |
| Human iPSC-derived neuron | SNP array | 0.3* | 90 |
| Human keratinocyte | Single-cell sequencing | 0.08 | 70 |
| Human skin fibroblast | iPSC clonal sequencing | ∼0.3 | 1 |
| Human lymphoblast | Single-cell sequencing | 6.7 | 16 |
| Structural variation (including large inversions and intra- and interchromosomal translocations) | |||
| Mouse brain | Reporter mouse model (LacZ) | 20–40* | 28 |
| Mouse liver | Reporter mouse model (LacZ) | 25–100* | 28 |
| Mouse heart | Reporter mouse model (LacZ) | 45–99 | 30 |
| Mouse small intestine | Reporter mouse model (LacZ) | 34–58 | 30 |
| Human lung fibroblast | Bulk sequencing | 25* | 105 |
| Multiple myeloma | Bulk sequencing | 45.42* | 134 |
| Breast cancer primary tumor and cell line | Bulk sequencing | 67.7, 128 | 114 |
| Uterine corpus endometrioid carcinoma | Bulk sequencing | 52.9* | 134 |
| Kidney renal clear cell carcinoma | Bulk sequencing | 7* | 134 |
| Microsatellite instability (1–6 bp) | |||
| Multiple tumors | Bulk sequencing | 800* | 87 |
| Retrotransposition (∼100 bp to several kbp) | |||
| Human hippocampal, cortical, and cortex pyramidal neuron | Single-cell sequencing | 13.7, 16.3, 10.7 | 120 |
| Human neuron | Single-nucleus sequencing | <0.6 | 41 |
| Human glia and neuron | Single-nucleus sequencing | 0.58–1 | 39 |
| Base substitution (1 bp) | |||
| Rhabdoid tumor and thyroid carcinoma | Bulk sequencing | 500*, 1,600* | 92 |
| Human liver, colon, and small intestine | Organoid sequencing | 200–3,000* | 13 |
| Human prefrontal cortex and hippocampal dentate gyrus neuron | Single-nucleus sequencing | 700–4,000* | 80 |
| Human neuron from Cockayne syndrome and xeroderma pigmentosum patients | Single-nucleus sequencing | 1,800*, 2,500* | 80 |
| Human neuron from fetus | Organoid sequencing | 200–400 | 8 |
| Human dermal fibroblast | Single-cell sequencing | 927 | 32 |
| Human dermal fibroblast | iPSC clonal sequencing | 1,035 | 2 |
| Human satellite cells | Organoid sequencing | 354–2,323 | 53 |
| Mouse dermal fibroblast | Single-cell sequencing | 2,000* | 93 |
Estimated from raw numbers or figures in the citations.
Abbreviations: bp, base pair; CGH, comparative genome hybridization; FISH, fluorescence in situ hybridization; iPSC, induced pluripotent stem cell; kbp, kilobase pair; Mb, megabase; SKY, spectral karyotyping; SNP, single-nucleotide polymorphism.
Aneuploidy and Copy Number Variation
Aneuploidy, i.e., the gain or loss of whole chromosomes, is usually a consequence of nondisjunction, which is the improper separation of chromosomes during cell division (44). Aneuploidy in germ cells, i.e., constitutional aneuploidy, is generally not tolerated, with the exception of the well-documented trisomy of chromosome 21, which causes Down Syndrome. Additional trisomies of chromosomes 13 and 18 can give rise to live birth, but the offspring usually do not survive for long (111). Aneuploidy also occurs in somatic cells and, as mentioned previously, this is relatively easy to detect using cytogenetics methods such as FISH. Most data have been collected on embryos (Table 1), and it is now clear that the human in vitro fertilization (IVF) cleavage-stage embryo is highly prone to aneuploidy and other chromosomal structural aberrations; about 50% of these embryos contain blastomeres with chromosomal aberrations (26, 123, 124). Such high frequency of chromosomal mutations is not limited to IVF embryos but likely extends to regular conception of human embryos (127). Chromosomal mutations are the main cause of miscarriage and are likely responsible for the loss of a majority of natural conceptions. They are also a frequent cause of congenital birth defects. However, they also occur in embryos that give rise or should have given rise to healthy babies, which can be explained only by selection against those blastomeres carrying a high load of chromosomal and possibly other mutations (127).
Meanwhile, it had already been established using simple karyotyping that at least 1% of peripheral blood lymphocytes of young human adults contain chromosomal abnormalities and that at least five times that frequency appear in cells from aged individuals (40). This has been amply confirmed by FISH, which has a much higher resolution than classical cytogenetic methods (106). One study using FISH with spectral imaging (SKY) showed the frequency of aneuploid cells in the developing nervous system of mice to be as high as 33% for all chromosomes combined (107). A later study used interphase FISH to find similarly high levels for the developing human brain (136). After completion of development the frequency of aneuploidy was strongly reduced, suggesting selection against cells with high levels of genome instability. Indeed, in the mouse study adult lymphocytes were only found to contain about 3% aneuploidy across all chromosomes (107). Chromosome-specific interphase FISH has been used for the analysis of postmitotic, nondividing cells in tissues such as brain and liver (45) in order to detect aneuploidy. Yet, even in adult organisms, aneuploidy has been detected at levels as high as 4% per chromosome, as observed in human brain for chromosome 21 (108). Use of interphase FISH has also demonstrated that human and murine hepatocytes are highly aneuploid at a frequency of about 3.7% per chromosome (35). Polyploidy, especially in liver but also in some other organs, is common in mammalian species and increases with age (33). Polyploidy was found to result in multiple numerical chromosome imbalances in mouse liver and has been suggested to represent a mechanism that generates genetic diversity in allowing hepatocytes to adapt to injury (36).
In the cerebral cortex of aging mice, the frequency of aneuploid cells was found to rise to a level as high as 5% per chromosome when studied by interphase FISH using a two-probe system that would conclude aneuploidy only when numerical change was indicated at both chromosomal locations (46). If the aneuploidy frequencies observed for some individual chromosomes by FISH were to be extrapolated to all chromosomes combined, it would mean that a very high fraction of the cells in a tissue are aneuploid for at least one chromosome.
More recently, single-cell whole-genome sequencing at low coverage has emerged as an efficient method for detecting aneuploidy in not one or few but all chromosomes of a single cell. Such comprehensive 24-chromosome analysis was first made possible through a combination of whole-genome amplification and comparative genome hybridization (CGH), the latter using slides with small segments of DNA as the targets for hybridization, i.e., array CGH (50). More recently, CGH was replaced by low-coverage next-generation sequencing (51). Interestingly, the data that have begun to emerge from the application of this method to animal and human cells and tissues do not show the same high levels of aneuploidy as found with FISH (71, 121). Indeed, it has been argued that FISH overestimates aneuploidy frequency due to hybridization artefacts, suggesting high overall levels of aneuploidy while the true frequency is not higher than about 5% of cells aneuploid for at least one chromosome (71).
Importantly, aneuploidy has been suggested to be involved in the pathogenesis of Alzheimer’s disease (AD). Aneuploidy has been reported to increase in buccal cells with age and is higher in AD patients relative to controls (118). In the brains of AD patients, the relative number of cortical neurons containing increased DNA content was found to be up to two times higher than that of controls (97). There is also some direct evidence using FISH for increased aneuploidy in the brains of AD patients, which has been interpreted in the context of the hypothesized dedifferentiation of neurons (135). Interphase FISH has revealed gains of chromosomes 11, 17, 18 and 21 (118, 135). However, more recent studies using single-cell sequencing report only low frequencies of aneuploidy in the brain and no increase among AD patients (121). Aneuploidy frequencies of less than 1% were reported in this study—more than an order of magnitude lower than previous studies using FISH. Nevertheless, if even 1–5% of somatic cells harbor at least one aneuploidy event, it is still a high level for such a major mutation that can severely impact gene expression patterns, especially in combination with the many other types of mutations we discuss below.
Aneuploidy is an extreme form of CNV, which can be analyzed simultaneously by CGH or low-coverage sequencing in whole-genome-amplified single cells. The critical step in this type of analysis is the whole-genome amplification process, which is fraught with error, for example, locus dropout. Strategies are based on PCR or multiple displacement amplification sometimes combined with various methodologies to reduce locus dropout. Each of these assays, which are commercially available, has its advantages and disadvantages, and all work to some extent (119).
CNV and aneuploidy have been studied most frequently in early embryos, and the results now obtained by single-cell analysis in combination with array CGH or sequencing essentially confirm the very high levels of genome instability (123, 132). Vanneste et al. (124) showed that only 9% of IVF embryos are diploid in all blastomeres based on a combined single-cell SNP and array CGH analysis. Segmental CNVs were observed in 70% of the embryos. Aneuploidy was found in 40% of the embryos (124). These high proportions of aneuploidy and CNV in embryos were found to decline throughout pregnancy, possibly due to selection against heavily damaged cells (132). Single-cell sequencing analysis in this respect is now used to accurately detect CNVs and aneuploidy in early human embryos to increase the success rate of IVF.
As mentioned, aneuploidy has also been studied in postmitotic cells such as neurons and liver cells. Neurons have been extensively studied recently for various types of somatic mutations, including chromosomal mutations and CNVs. McConnell et al. (90) used SNP arrays, sequencing, and FISH to analyze neurons derived from postmortem human brains and induced pluripotent stem cells (iPSCs). They found a low frequency (approximately 2.7%) of aneuploid cells in human frontal cortex neurons, i.e., one chromosome gain and two losses out of 110 single neurons analyzed. However, the number of CNVs observed in these cells was substantially higher, i.e., 41% of cells carried at least one CNV, and these ranged in size from 2.9 to 75 Mb (90). This fairly high load of CNV mutations in neurons was predominantly due to a few cells with high CNV numbers. There was some evidence that neural progenitor cells had fewer CNVs. These investigators also found low-level CNVs and aneuploidy in cultured fibroblasts, and neurons had significantly larger numbers of CNVs than fibroblasts.
The frequent occurrence of CNVs in human neurons was essentially confirmed by Cai et al. (16) using single-cell amplification followed by low-coverage whole-genome sequencing. They found that aneuploidy was rare (5% of cells) but that CNVs occurred in single human cortical neurons at an average of 3.4 per single neuron, where most of them were losses (16). Interestingly, these investigators also found clonally derived CNVs, i.e., the same CNVs occurring in multiple neurons. In cells from a patient with hemimegalencephaly, 20% of neurons were harboring the same CNV (tetrasomy 1q) underscoring how somatic mutations occurring early in life could causally contribute to disease (104). Thus, the low frequencies of aneuploidy observed in the studies by Caiand colleagues (16,104) and McConnell et al.(90) confirm the notion that aneuploidy levels in normal somatic cells of adult humans are less than 5%, with other types of CNV (over 1 Mb) significantly higher, i.e., up to several events in an adult neuron. However, in one other study on human brain and skin only around 10% of somatic cells were found to harbor at least one megabase-scale CNV regardless of the tissue of origin. The discrepant findings of these next-generation sequencing-based studies were explained by variation in read depth (70).
As mentioned, aneuploidies and CNVs were identified in cell types other than neurons. In testing whether reprogramming of normal somatic cells into iPSCs is associated with excess genome instability, Abyzov et al. (1) discovered that about 30% of primary human skin fibroblasts that gave rise to the iPSC clones contain CNVs. This is higher than reported by Knouse et al. (70) for such cells; i.e., fewer than approximately 8% of human skin cells contain CNVs. This difference might be due to the higher sensitivity of the Abyzov study in which CNVs as small as 2 kilobase pairs (kbp) were discovered. Interestingly, many more CNVs were identified in single lymphoblasts obtained from an Epstein-Barr virus–transformed B-lymphoblast cell line, i.e., on average, almost seven per cell. However, many of these CNVs were clonal, so these could be CNVs acquired during the continuous proliferation of such cells (16).
Retrotranspositions
Retrotransposons are mobile genetic elements that use a copy-and-paste mechanism to spread throughout the genome via RNA intermediates (55). Retrotransposons consist of two subclasses distinguished by the presence or absence of long terminal repeats (LTRs). LTR elements are endogenous retroviruses that make up about 8% of the genome. The major non-LTR retrotransposons are the L1 and Alu elements, which collectively compose about 30% of the human genome and have been shown to be currently active (59, 74, 112). De novo retrotransposition events can alter genome structure, gene expression, and cellular function and drive diseases (10, 43, 54, 77). L1 insertion events were thought to occur only in germ cells during early embryonic development (64) but have now been found in tumors and more recently in somatic cells and iPSCs (41, 54, 69, 120).
The first case of a somatic retrotransposition caused by L1 was found in colorectal cancer more than 20 years ago (91). Indeed, as has already been mentioned, tumors are clonal events that when sequenced will show genomic alterations provided that these alterations affect a large fraction of cells in the tumor. Somatic L1 insertions have been observed in cancers and were shown to be biased to genes commonly mutated in cancer and, therefore, to behave like other mutations positively selected to provide the tumor cell with one competitive advantage after another (77). The number of L1 insertions was found to vary dramatically among different colorectal tumors—from 2 to 102—whereas there were no events detected in blood or brain cancers (77).
Due to the small size of retrotransposons, which vary from approximately 100 bp to several kilobase pairs, and due to the large number of possible insertion sites, it has been difficult to directly detect somatic retrotransposon events in normal somatic cells. Although there are interesting examples of detecting insertions using L1 reporter assays, copy number qPCR assays, or next-generation sequencing of bulk DNA, the sensitivity and accuracy of these methods are low. Additionally, some indirect methods were used to detect retrotransposon activity, for example, through the detection of L1 RNA transcription (56) and to analyze the histone modifications and DNA methylation limiting L1 mobility (14).
More recently, single-cell retrotransposon capture sequencing was used to identify somatic L1 retrotranspositions in individual human hippocampal neurons and glia and cortical neurons. The study found high rates of somatic L1 insertion averaging about 13–16 per neuron (120). This appeared in contrast to an earlier study which had reported far lower frequencies, i.e., less than one per human neuron (41). However, based on a reanalysis of the data that had resulted in the very high estimates of retrotranspositions, it was later suggested that this high frequency was based on artefacts and that the frequency of retrotranspositions in human neurons is below 1 per cell (42).
Base Substitutions
Single nucleotide variants (SNVs) due to base pair substitutions are notoriously difficult to detect by next-generation sequencing because the high rate of sequencing errors cannot be distinguished from true base substitutions. Also, genome amplification can result in SNVs, for example, due to DNA damage (19, 32). So, unlike germline mutation rate determination, which does not require amplification, single-cell approaches for measuring somatic base substitution mutations remain a challenge. Nevertheless, modification of whole-genome sequencing approaches (19, 32, 138) and improvements in computational correction for artefacts (32) have now led to the first reliable data sets on base substitution mutations in human and animal cells.
Data on human primary fibroblasts indicated about 1,000 somatic mutations per single cell, and this estimate was validated by sequencing unamplified DNA from clones derived from the same cell population (32). Base substitutions were also analyzed in human neurons from two regions of brain, i.e., the prefrontal cortex (PFC) and the hippocampal dentate gyrus (80). The number of somatic SNVs was found to increase from approximately 700 per cell on average in <1-year-old donors to more than 4,000 per cell in >80-year-old donors. Mutation loads in hippocampus were somewhat higher and also increased with age. Interestingly, in that same study, single PFC neurons were also analyzed from patients with neurological disorders associated with defects in DNA repair, including Cockayne syndrome (CS) and xeroderma pigmentosum (XP) (80). Neurons from postmortem brains of CS individuals showed an excess of SNVs relative to the expected age-adjusted normal PFC rate of approximately 2.3-fold; XP neurons showed an increase of approximately 2.5-fold.
These results on single cells after amplification are in keeping with results of the whole-genome sequencing of unamplified clones of human primary cells (2,8,11,13,109) (Table 1). Importantly, they are also very similar to the number of base substitutions found in tumors. As discussed earlier, a tumor is a clonal lineage that to some extent retains a memory of the number of mutations present in the normal founder cell. While in some tumors the mutation frequency is very high, most have frequencies in the range of about 500 (in rhabdoid tumor, a juvenile cancer) to about 1,600 (in thyroid carcinoma) per diploid genome (92). Hence, tumors on average are a good surrogate for the number of mutational events in normal tissues.
Interestingly, these somatic base substitution mutation frequencies are much higher than the germline mutation frequency. As mentioned previously, in humans, the germline mutation frequency, determined by whole-genome sequencing of parents and children to identify de novo mutations in the offspring, is only about 60 per cell, i.e., 1.2×10⁻⁸ per base pair (73). Of note, most germline mutations originate in sperm (73), and direct sequencing of individual sperm cells has provided de novo mutation frequencies in the same range (129). Direct comparison of this number to, for example, the frequency observed in primary human fibroblasts, showed mutation frequency in the soma to be almost two orders of magnitude higher (93). This underscores the disposable nature of the soma, as originally established by Weismann (131) (see also the section titled Somatic Mutations: How They Differ from Germline Mutations and Why They Are So Difficult to Measure).
Genome Structural Variation Other Than Copy Number Variation or Retrotransposition
SVs can be defined as genomic alterations that involve segments of DNA ranging from one or few base pairs, which are generally known as small indels, to segments in the kilobase and megabase ranges. As we have seen, very large genome SVs, i.e., chromosomal aberrations, can be detected using cytogenetic methods and CNVs by array CGH or low-coverage sequencing. But many SVs are complex intra- or interchromosomal rearrangements, and they can involve various types of sequences (49) (Figure 1). In the germline, SVs (other than CNVs) are frequent and have been linked to gene expression changes (20). Although the number of germline SVs is obviously much lower than the number of germline SNVs, their impact may be equally high or higher (6). This likely applies to somatic SVs as well, owing to the much larger number of base pairs involved.
SVs have well-documented roles in the pathogenesis of cancers (61, 85, 95) but are difficult to detect in normal, nonclonal tissues. The accepted procedure for SVs after next-generation sequencing—i.e., searching for discordant read-pairs after paired-end sequencing (18) [or using a split-read approach (137)], which is defined as reads with abnormal orientations or insert sizes (either too small or too large)—can be used only with clonal lineages such as tumors in which each cell carries the same SVs. In normal tissues, the SVs can differ from cell to cell like all other mutations. This is a problem because the generally accepted consensus model of analysis relies on finding several independent sequencing reads showing the same break point. This is a requirement because of the significant number of errors associated with library preparation, alignment, and variant calling (58, 88). However, like point mutations, SVs in normal tissues have a very low abundance and will not be represented in multiple sequencing reads. Thus, they cannot be identified by traditional, consensus-based approaches. Recently, a method was developed for the quantitative detection of somatic SVs in DNA extracted from cell populations or tissues using low-coverage sequencing (88, 105). This method allows SVs to be detected and ascertained with extremely high accuracy as was demonstrated by the identification of ultra-low-abundance somatic SVs induced by clastogens in primary human fibroblasts (105). The background levels of SVs measuring longer than 200 nucleotides in this study were found to be about 25 events per cell. This is somewhat lower than but in the same range as the previously reported SV frequency at reporter loci in the mouse (31). Unfortunately, the analysis of bulk DNA for rare SVs does not allow an assessment of the size of the events. It merely distinguishes between intra- or interchromosomal rearrangements. This is why single-cell methods are preferable for detecting SVs in a quantitative manner.
While single-cell whole-genome amplification is prone to artefacts when studying point mutations, the situation is even worse for using it to study SVs. In particular, multiple displacement amplification has a very high background of inversions due to chimera formation (75). Therefore, low-abundance somatic SVs cannot currently be detected by single-cell sequencing (122). Nevertheless, rough estimates of what can be expected in normal cells can be based on what is known about SVs in tumors.
Somatic SVs are an important cause of cancer (94,95). As discussed earlier, mutations, including SVs, can be identified in clonal lineages such as tumors by sequencing the genome of tumor and normal DNA from the same patient (96). We have already seen that the number of base substitutions in most tumors is in the same range as in normal cells. In primary breast tumors, approximately 70 somatic SVs were detected on average per tumor including deletions, tandem duplications, inversions, interchromosomal rearrangements, and other more complex SVs. Breast cancer cell lines showed more somatic SVs than primary cancers (128 and 67.7 on average per sample, respectively) (114). Similar to the higher CNV frequency in lymphoblastoid cells (see the section titled Aneuploidy and Copy Number Variation), the higher SV frequency in breast cancer cell lines is likely due to the extended period of cell culture with ample opportunity for more SVs to arise. A more comprehensive study, which included 10 tumor types from 140 samples, found kidney renal clear cell carcinoma, multiple myeloma, and uterine corpus endometrioid carcinoma tumors to have the lowest SV frequencies of 7, 45, and 53 SVs on average per sample, respectively (134). These reported frequencies are in the same range as the estimates from normal mouse and human primary cells and tissues discussed previously (Table 1).
A specific class of SVs involves mini- and microsatellite copy number alterations. These are tandem repeats that have very high germline and somatic mutation rates. For minisatellites, which have a unit size of about 30 bp, Jeffreys et al. (63) reported a mutation frequency of 0.007 per gamete. The situation is somewhat similar for microsatellites, which have a typical unit length of 3 bp (37). Mutations at microsatellite loci have been found to occur at rates as high as 1×10⁻² per locus in human blood and to increase with age (23). Excessive microsatellite instability has been associated with certain cancers, most notably colorectal cancer, due to the loss of DNA mismatch repair (102). However, microsatellite mutant loci have been detected in cancers other than colorectal cancer as well. The tumor types with the highest rates of microsatellite mutations were the ones associated with loss of normal mismatch repair, including rectal, stomach, and endometrial tumors. But microsatellite mutations were also found in breast and cervical cancers. On average, these other cancers showed about 800 mutations per diploid genome in tumors not genetically predisposed to microsatellite instability (i.e., 8 mutations per sample in exomes) (87).
CONSEQUENCES OF SOMATIC MUTATIONS
The best-documented consequence of somatic mutations is of course cancer. This was already postulated by Failla (47) and Osgood (101), who considered mutations as the primary cause of cancer, an idea that goes back all the way to the German biologist Theodor Boveri’s first proposition, in 1902, of chromosomal changes as the root cause of cancer (reviewed in 133). But it was only in the 1970s that the evidence became irrefutable that cancer was primarily a genetic disease caused by cycles of mutation, selection, and new mutations in a process that can eventually result in a metastatic tumor (99). Indeed, the reason that cancer is able to survive treatment so often is because of its enormous capacity to generate mutational heterogeneity, providing a sheer infinite range of strategies to escape natural defenses, such as the immune system, and almost any kind of therapy.
Failla (47) and somewhat later Szilard (117) proposed that somatic mutations could also cause aging. However, this remains an open question because of the difficulties in measuring somatic mutations in normal cells (see the section titled Somatic Mutations: How They Differ from Germline Mutations and Why They Are So Difficult to Measure). An argument that has been used from the very beginning against somatic mutagenesis as a cause of aging and some of its associated diseases other than cancer is the very low frequency of mutations in normal tissues (89). It has been proposed that it is cancer risk rather than cellular fitness per se that has led to selection in vertebrates for low somatic mutation frequencies in normal cells (25). According to this argument, mutation loads in somatic genomes will never reach the threshold of causing cell functional decline that adversely affects fitness. By contrast, the accidental mutations that provide a growth advantage can be selected, and these lead to the clonal lineages that give us cancer. To some extent this picture has now changed because the first accurate methods to directly study somatic mutations in normal cells and tissues suggest much higher somatic mutation frequencies than previously assumed.
In this review, we examine the evidence that somatic mutations in normal human and animal tissues are not as rare as originally thought. Indeed, the progress in measuring various types of mutations, most notably base substitutions, aneuploidy, and CNVs, has now unequivocally shown that somatic mutations are widespread in normal tissues and can reach levels as high as several thousand base substitutions and one or even a few CNVs per cell. As we have seen, less information is available for genome SVs other than CNVs, but even for this type of mutation the available evidence suggests a fairly high frequency of 20–50 events per cell. This has mostly been deduced from the number of SVs in tumors, which, as we have seen, are often good surrogates for normal single cells. Microsatellite mutations are significantly more frequent due to the inherent nature of the mutagenic processes causing deletions at such loci.
It has been suggested that in some cell types, most notably neurons, high levels of genome instability could contribute to genetic diversity and provide a selective advantage by expanding phenotypic plasticity. But as we have seen, this was mostly based on some very high levels of aneuploidy, CNVs, and retrotranspositions that might have been inflated due to artefacts associated with the methods used or the computational analysis of the data. It seems highly unlikely, therefore, that somatic mutagenesis has been selected as an adaptive process other than in the well-defined generation of antibody diversity. Nevertheless, there is little disagreement that even large somatic mutations such as CNVs are widespread. Based on the data here reviewed (Table 1), it seems reasonable to assume that a typical somatic cell contains anywhere from 0 to 10 mutational events larger than 1 kbp as well as a thousand or more base substitutions and possibly a very similar number of small indels—the latter mostly simple sequence repeats.
If somatic mutagenesis merely has adverse effects, how deleterious can mutations be in the frequencies we now begin to uncover? In other words, will they ever reach levels high enough to cause a level of fitness loss that can explain the functional losses associated with aging and its associated diseases? There is ample evidence that mutations accumulate with age in both model organisms and humans (125). However, optimal cellular functioning does not require a mutation-free genome. On the one hand, it is possible that even large somatic mutations are tolerated and never give rise to disease. On the other hand, there is little doubt that genetic mosaicism due to mutations that usually, but not always, occur early in life can cause disease (12, 38, 104). Thus, it is certainly possible that weakly deleterious mutations accumulate with age and contribute to age-related functional decline and disease (Figure 4). The work that now remains to be done, apart from further optimizing our arsenal of methods for the quantitative detection of various types of somatic mutations, is to systematically analyze human cells and tissues and map out the complete spectrum of genomic change in relation to disease and aging. Most of all, we need to develop tools that link each genomic mutation to a possible functional consequence.
Figure 4.
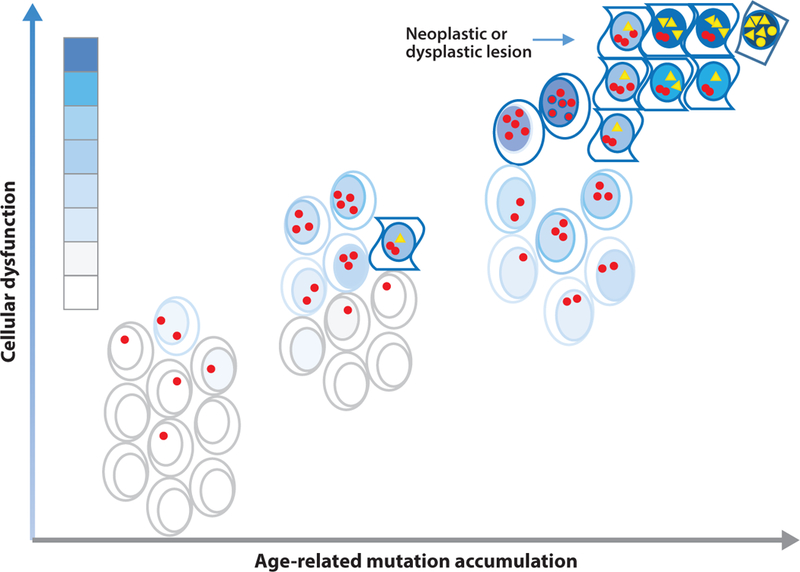
Mutations may contribute to cellular functional decline during aging. In a young organism, a substantial number of mutations have already accumulated, for example, as replication errors during the very high rate of cell division that occurs during development. These mutations may affect the function of cells in different organs and tissues, but they are not significant enough to affect the organism from operating optimally. During aging, mutations accumulate further and quickly begin to exceed the threshold for functioning optimally, which has been set low since there is no selective advantage in maintaining genome integrity for much longer than the age of first reproduction. Hence, there are more and more cells that suffer functional decline and even death (open space). Occasionally, particular combinations of mutations affect growth restraint, and such cells grow into hyperplastic or neoplastic lesions. Functional decline is indicated by the blue gradient, with darker shades indicating greater deficits. Red dots and yellow triangles represent noncancer driver mutations and cancer driver mutations, respectively.
ACKNOWLEDGMENTS
Research in the Vijg lab is supported by grants from US National Institutes of Health (AG017242, CA180126, AG047200, and AG038072) and the Glenn Foundation for Medical Research. We thank Dr. Xiao Dong for helpful discussions and critical reading of the text.
Footnotes
DISCLOSURE STATEMENT
L.Z. and J.V. are two of the founders of SingulOmics Corp.
LITERATURE CITED
- 1.Abyzov A, Mariani J, Palejev D, Zhang Y, Haney MS, et al. 2012. Somatic copy number mosaicism in human skin revealed by induced pluripotent stem cells. Nature 492:438–42 [DOI] [PMC free article] [PubMed] [Google Scholar]
- 2.Abyzov A, Tomasini L, Zhou B, Vasmatzis N, Coppola G, et al. 2017. One thousand somatic SNVs per skin fibroblast cell set baseline of mosaic mutational load with patterns that suggest proliferative origin. Genome Res 27:512–23 [DOI] [PMC free article] [PubMed] [Google Scholar]
- 3.Albertini RJ, Castle KL, Borcherding WR. 1982. T-cell cloning to detect the mutant 6-thioguanine-resistant lymphocytes present in human peripheral blood. PNAS 79:6617–21 [DOI] [PMC free article] [PubMed] [Google Scholar]
- 4.Alexandrov LB, Nik-Zainal S, Wedge DC, Aparicio SA, Behjati S, et al. 2013. Signatures of mutational processes in human cancer. Nature 500:415–21 [DOI] [PMC free article] [PubMed] [Google Scholar]
- 5.Alioto TS, Buchhalter I, Derdak S, Hutter B, Eldridge MD, et al. 2015. A comprehensive assessment of somatic mutation detection in cancer using whole-genome sequencing. Nat. Commun 6:10001. [DOI] [PMC free article] [PubMed] [Google Scholar]
- 6.Alkan C, Coe BP, Eichler EE. 2011. Genome structural variation discovery and genotyping. Nat. Rev. Genet 12:363–76 [DOI] [PMC free article] [PubMed] [Google Scholar]
- 7.Auton A, Brooks LD, Durbin RM, Garrison EP, Kang HM, et al. (1000 Genomes Proj. Consort.). 2015. A global reference for human genetic variation. Nature 526:68–74 [DOI] [PMC free article] [PubMed] [Google Scholar]
- 8.Bae T, Tomasini L, Mariani J, Zhou B, Roychowdhury T, et al. 2018. Different mutational rates andmechanisms in human cells at pregastrulation and neurogenesis. Science 359:550–55 [DOI] [PMC free article] [PubMed] [Google Scholar]
- 9.Baer CF, Miyamoto MM, Denver DR. 2007. Mutation rate variation in multicellular eukaryotes: causesand consequences. Nat. Rev. Genet 8:619–31 [DOI] [PubMed] [Google Scholar]
- 10.Beck CR, Garcia-Perez JL, Badge RM, Moran JV. 2011. LINE-1 elements in structural variation anddisease. Annu. Rev. Genom. Hum. Genet 12:187–215 [DOI] [PMC free article] [PubMed] [Google Scholar]
- 11.Behjati S, Huch M, van Boxtel R, Karthaus W, Wedge DC, et al. 2014. Genome sequencing of normalcells reveals developmental lineages and mutational processes. Nature 513:422–25 [DOI] [PMC free article] [PubMed] [Google Scholar]
- 12.Biesecker LG, Spinner NB. 2013. A genomic view of mosaicism and human disease. Nat. Rev. Genet 14:307–20 [DOI] [PubMed] [Google Scholar]
- 13.Blokzijl F, de Ligt J, Jager M, Sasselli V, Roerink S, et al. 2016. Tissue-specific mutation accumulation in human adult stem cells during life. Nature 538:260–64 [DOI] [PMC free article] [PubMed] [Google Scholar]
- 14.Bourc’his D, Bestor TH. 2004. Meiotic catastrophe and retrotransposon reactivation in male germ cells lacking Dnmt3L. Nature 431:96–99 [DOI] [PubMed] [Google Scholar]
- 15.Bruder CE, Piotrowski A, Gijsbers AA, Andersson R, Erickson S, et al. 2008. Phenotypically concordant and discordant monozygotic twins display different DNA copy-number-variation profiles. Am. J. Hum. Genet 82:763–71 [DOI] [PMC free article] [PubMed] [Google Scholar]
- 16.Cai X, Evrony GD, Lehmann HS, Elhosary PC, Mehta BK, et al. 2014. Single-cell, genome-wide sequencing identifies clonal somatic copy-number variation in the human brain. Cell Rep 8:1280–89 [DOI] [PMC free article] [PubMed] [Google Scholar]
- 17.Campbell CD, Eichler EE. 2013. Properties and rates of germline mutations in humans. Trends Genet 29:575–84 [DOI] [PMC free article] [PubMed] [Google Scholar]
- 18.Campbell PJ, Stephens PJ, Pleasance ED, O’Meara S, Li H, et al. 2008. Identification of somatically acquired rearrangements in cancer using genome-wide massively parallel paired-end sequencing. Nat. Genet 40:722–29 [DOI] [PMC free article] [PubMed] [Google Scholar]
- 19.Chen C, Xing D, Tan L, Li H, Zhou G, et al. 2017. Single-cell whole-genome analyses by LinearAmplification via Transposon Insertion (LIANTI). Science 356:189–94 [DOI] [PMC free article] [PubMed] [Google Scholar]
- 20.Chiang C, Scott AJ, Davis JR, Tsang EK, Li X, et al. 2017. The impact of structural variation on human gene expression. Nat. Genet 49:692–99 [DOI] [PMC free article] [PubMed] [Google Scholar]
- 21.Collins AR, Cadet J, Moller L, Poulsen HE, Viña J. 2004. Are we sure we know how to measure 8-oxo-7,8-dihydroguanine in DNA from human cells? Arch. Biochem. Biophys 423:57–65 [DOI] [PubMed] [Google Scholar]
- 22.Conrad DF, Keebler JE, DePristo MA, Lindsay SJ, Zhang Y, et al. 2011. Variation in genome-wide mutation rates within and between human families. Nat. Genet 43:712–14 [DOI] [PMC free article] [PubMed] [Google Scholar]
- 23.Coolbaugh-Murphy MI, Xu J, Ramagli LS, Brown BW, Siciliano MJ. 2005. Microsatellite instability (MSI) increases with age in normal somatic cells. Mech. Ageing Dev 126:1051–59 [DOI] [PubMed] [Google Scholar]
- 24.de Duve C 2005. The onset of selection. Nature 433:581–82 [DOI] [PubMed] [Google Scholar]
- 25.de Grey AD. 2007. Protagonistic pleiotropy: why cancer may be the only pathogenic effect of accumulating nuclear mutations and epimutations in aging. Mech. Ageing Dev 128:456–59 [DOI] [PubMed] [Google Scholar]
- 26.Delhanty JDA, Griffin DK, Handyside AH, Harper J, Atkinson GHG, et al. 1993. Detection of aneuploidy and chromosomal mosaicism in human embryos during preimplantation sex determination by fluorescent in situ hybridisation, (FISH). Hum. Mol. Genet 2:1183–85 [DOI] [PubMed] [Google Scholar]
- 27.Dewey FE, Murray MF, Overton JD, Habegger L, Leader JB, et al. 2016. Distribution and clinical impact of functional variants in 50,726 whole-exome sequences from the DiscovEHR study. Science 354:aaf6814. [DOI] [PubMed] [Google Scholar]
- 28.Dollé MET, Giese H, Hopkins CL, Martus HJ, Hausdorff JM, Vijg J. 1997. Rapid accumulation of´ genome rearrangements in liver but not in brain of old mice. Nat. Genet 17:431–34 [DOI] [PubMed] [Google Scholar]
- 29.Dollé MET, Snyder WK, Dunson DB, Vijg J. 2002. Mutational fingerprints of aging. Nucleic Acids Res 30:545–49 [DOI] [PMC free article] [PubMed] [Google Scholar]
- 30.Dollé MET,Snyder WK, Gossen JA, Lohman PHM, Vijg J. 2000. Distinct spectra of somatic mutations accumulated with age in mouse heart and small intestine. PNAS 97:8403–8 [DOI] [PMC free article] [PubMed] [Google Scholar]
- 31.Dollé MET, Vijg J. 2002. Genome dynamics in aging mice. Genome Res 12:1732–38 [DOI] [PMC free article] [PubMed] [Google Scholar]
- 32.Dong X, Zhang L, Milholland B, Lee M, Maslov AY, et al. 2017. Accurate identification of single-nucleotide variants in whole-genome-amplified single cells. Nat. Methods 14:491–93 [DOI] [PMC free article] [PubMed] [Google Scholar]
- 33.Duncan AW. 2013. Aneuploidy, polyploidy and ploidy reversal in the liver. Semin. Cell Dev. Biol 24:347–56 [DOI] [PubMed] [Google Scholar]
- 34.Duncan AW, Hanlon Newell AE, Bi W, Finegold MJ, Olson SB, et al. 2012. Aneuploidy as a mechanism for stress-induced liver adaptation. J. Clin. Investig 122:3307–15 [DOI] [PMC free article] [PubMed] [Google Scholar]
- 35.Duncan AW, Hanlon Newell AE, Smith L, Wilson EM, Olson SB, et al. 2012. Frequent aneuploidy among normal human hepatocytes. Gastroenterology 142:25–28 [DOI] [PMC free article] [PubMed] [Google Scholar]
- 36.Duncan AW, Taylor MH, Hickey RD, Hanlon Newell AE, Lenzi ML, et al. 2010. The ploidy conveyor of mature hepatocytes as a source of genetic variation. Nature 467:707–10 [DOI] [PMC free article] [PubMed] [Google Scholar]
- 37.Ellegren H 2004. Microsatellites: simple sequences with complex evolution. Nat. Rev. Genet 5:435–45 [DOI] [PubMed] [Google Scholar]
- 38.Erickson RP. 2010. Somatic gene mutation and human disease other than cancer: an update. Mutat. Res 705:96–106 [DOI] [PubMed] [Google Scholar]
- 39.Erwin JA, Paquola ACM, Singer T, Gallina I, Novotny M, et al. 2016. L1-associated genomic regions are deleted in somatic cells of the healthy human brain. Nat. Neurosci 19:1583–91 [DOI] [PMC free article] [PubMed] [Google Scholar]
- 40.Evans HJ. 1988. Mutation as a cause of genetic disease. Philos. Trans. R. Soc. B 319:325–40 [DOI] [PubMed] [Google Scholar]
- 41.Evrony GD, Cai X, Lee E, Hills LB, Elhosary PC, et al. 2012. Single-neuron sequencing analysis of L1 retrotransposition and somatic mutation in the human brain. Cell 151:483–96 [DOI] [PMC free article] [PubMed] [Google Scholar]
- 42.Evrony GD, Lee E, Park PJ, Walsh CA. 2016. Resolving rates of mutation in the brain using single-neuron genomics. eLife 5:e12966. [DOI] [PMC free article] [PubMed] [Google Scholar]
- 43.Ewing AD, Ballinger TJ, Earl D, Harris CC, Ding L, et al. 2013. Retrotransposition of gene transcripts leads to structural variation in mammalian genomes. Genome Biol 14:R22. [DOI] [PMC free article] [PubMed] [Google Scholar]
- 44.Faggioli F, Vijg J, Montagna C. 2011. Chromosomal aneuploidy in the aging brain. Mech. Ageing Dev 132:429–36 [DOI] [PMC free article] [PubMed] [Google Scholar]
- 45.Faggioli F, Vijg J, Montagna C. 2014. Four-color FISH for the detection of low-level aneuploidy ininterphase cells. Methods Mol. Biol 1136:291–305 [DOI] [PubMed] [Google Scholar]
- 46.Faggioli F, Wang T, Vijg J, Montagna C. 2012. Chromosome-specific accumulation of aneuploidy in the aging mouse brain. Hum. Mol. Genet 21:5246–53 [DOI] [PMC free article] [PubMed] [Google Scholar]
- 47.Failla G 1958. The aging process and cancerogenesis. Ann. N.Y. Acad. Sci 71:1124–40 [DOI] [PubMed] [Google Scholar]
- 48.Ferguson-Smith MA. 2015. History and evolution of cytogenetics. Mol. Cytogenet 8:19. [DOI] [PMC free article] [PubMed] [Google Scholar]
- 49.Feuk L, Carson AR, Scherer SW. 2006. Structural variation in the human genome. Nat. Rev. Genet 7:85–97 [DOI] [PubMed] [Google Scholar]
- 50.Fiegler H, Geigl JB, Langer S, Rigler D, Porter K, et al. 2007. High resolution array-CGH analysis ofsingle cells. Nucleic Acids Res 35:e15. [DOI] [PMC free article] [PubMed] [Google Scholar]
- 51.Fiorentino F, Biricik A, Bono S, Spizzichino L, Cotroneo E, et al. 2014. Development and validationof a next-generation sequencing-based protocol for 24-chromosome aneuploidy screening of embryos. Fertil. Steril 101:1375–82 [DOI] [PubMed] [Google Scholar]
- 52.Forsberg LA, Rasi C, Razzaghian HR, Pakalapati G, Waite L, et al. 2012. Age-related somatic structuralchanges in the nuclear genome of human blood cells. Am. J. Hum. Genet 90:217–28 [DOI] [PMC free article] [PubMed] [Google Scholar]
- 53.Franco I, Johansson A, Olsson K, Vrtacnik P, Lundin P, et al. 2018. Somatic mutagenesis in satelliteˇ cells associates with human skeletal muscle aging. Nat. Commun 9:800. [DOI] [PMC free article] [PubMed] [Google Scholar]
- 54.Goodier JL. 2014. Retrotransposition in tumors and brains. Mobile DNA 5:11. [DOI] [PMC free article] [PubMed] [Google Scholar]
- 55.Goodier JL. 2016. Restricting retrotransposons: a review. Mobile DNA 7:16. [DOI] [PMC free article] [PubMed] [Google Scholar]
- 56.Goodier JL, Kazazian HH Jr. 2008. Retrotransposons revisited: the restraint and rehabilitation of parasites. Cell 135:23–35 [DOI] [PubMed] [Google Scholar]
- 57.Gossen JA, de Leeuw WJ, Tan CH, Zwarthoff EC, Berends F, et al. 1989. Efficient rescue of integrated shuttle vectors from transgenic mice: a model for studying mutations in vivo. PNAS 86:7971–75 [DOI] [PMC free article] [PubMed] [Google Scholar]
- 58.Gundry M, Vijg J. 2012. Direct mutation analysis by high-throughput sequencing: from germline to low-abundant, somatic variants. Mutat. Res 729:1–15 [DOI] [PMC free article] [PubMed] [Google Scholar]
- 59.Hancks DC, Kazazian HH Jr. 2012. Active human retrotransposons: variation and disease. Curr. Opin. Genet. Dev 22:191–203 [DOI] [PMC free article] [PubMed] [Google Scholar]
- 60.Hoeijmakers JH. 2001. Genome maintenance mechanisms for preventing cancer. Nature 411:366–74 [DOI] [PubMed] [Google Scholar]
- 61.Inaki K, Liu ET. 2012. Structural mutations in cancer: mechanistic and functional insights. Trends Genet 28:550–59 [DOI] [PubMed] [Google Scholar]
- 62.Jacobs KB, Yeager M, Zhou W, Wacholder S, Wang Z, et al. 2012. Detectable clonal mosaicism and its relationship to aging and cancer. Nat. Genet 44:651–58 [DOI] [PMC free article] [PubMed] [Google Scholar]
- 63.Jeffreys AJ, Neumann R, Wilson V. 1990. Repeat unit sequence variation in minisatellites: a novel source of DNA polymorphism for studying variation and mutation by single molecule analysis. Cell 60:473–85 [DOI] [PubMed] [Google Scholar]
- 64.Kano H, Godoy I, Courtney C, Vetter MR, Gerton GL, et al. 2009. L1 retrotransposition occurs mainly in embryogenesis and creates somatic mosaicism. Genes Dev 23:1303–12 [DOI] [PMC free article] [PubMed] [Google Scholar]
- 65.Keightley PD. 2012. Rates and fitness consequences of new mutations in humans. Genetics 190:295–304 [DOI] [PMC free article] [PubMed] [Google Scholar]
- 66.Kimura M 1960. Optimum mutation rate and degree of dominance as determined by the principle of minimum genetic load. J. Genet 57:21–34 [Google Scholar]
- 67.Kirkwood TB. 1977. Evolution of ageing. Nature 270:301–4 [DOI] [PubMed] [Google Scholar]
- 68.Kirkwood TB. 2005. Understanding the odd science of aging. Cell 120:437–47 [DOI] [PubMed] [Google Scholar]
- 69.Klawitter S, Fuchs NV, Upton KR, Munoz-Lopez M, Shukla R, et al. 2016. Reprogramming triggers endogenous L1 and Alu retrotransposition in human induced pluripotent stem cells. Nat. Commun 7:10286. [DOI] [PMC free article] [PubMed] [Google Scholar]
- 70.Knouse KA, Wu J, Amon A. 2016. Assessment of megabase-scale somatic copy number variation using single-cell sequencing. Genome Res 26:376–84 [DOI] [PMC free article] [PubMed] [Google Scholar]
- 71.Knouse KA, Wu J, Whittaker CA, Amon A. 2014. Single cell sequencing reveals low levels of aneuploidyacross mammalian tissues. PNAS 111:13409–14 [DOI] [PMC free article] [PubMed] [Google Scholar]
- 72.Kondrashov A 2012. Genetics: the rate of human mutation. Nature 488:467–68 [DOI] [PubMed] [Google Scholar]
- 73.Kong A, Frigge ML, Masson G, Besenbacher S, Sulem P, et al. 2012. Rate of de novo mutations and the importance of father’s age to disease risk. Nature 488:471–75 [DOI] [PMC free article] [PubMed] [Google Scholar]
- 74.Lander ES, Linton LM, Birren B, Nusbaum C, Zody MC, et al. 2001. Initial sequencing and analysis of the human genome. Nature 409:860–921 [DOI] [PubMed] [Google Scholar]
- 75.Lasken RS, Stockwell TB. 2007. Mechanism of chimera formation during the Multiple Displacement Amplification reaction. BMC Biotechnol 7:19. [DOI] [PMC free article] [PubMed] [Google Scholar]
- 76.Laurie CC, Laurie CA, Rice K, Doheny KF, Zelnick LR, et al. 2012. Detectable clonal mosaicism from birth to old age and its relationship to cancer. Nat. Genet 44:642–50 [DOI] [PMC free article] [PubMed] [Google Scholar]
- 77.Lee E, Iskow R, Yang L, Gokcumen O, Haseley P, et al. 2012. Landscape of somatic retrotransposition in human cancers. Science 337:967–71 [DOI] [PMC free article] [PubMed] [Google Scholar]
- 78.Lindahl T 1993. Instability and decay of the primary structure of DNA. Nature 362:709–15 [DOI] [PubMed] [Google Scholar]
- 79.Liyanage M, Coleman A, du Manoir S, Veldman T, McCormack S, et al. 1996. Multicolour spectral karyotyping of mouse chromosomes. Nat. Genet 14:312–15 [DOI] [PubMed] [Google Scholar]
- 80.Lodato MA, Rodin RE, Barton AR, Bohrson CL, Chittenden TW, et al. 2018. Aging and neurodegeneration are associated with increased mutations in single human neurons. Science 359:555–59 [DOI] [PMC free article] [PubMed] [Google Scholar]
- 81.Long AS, Lemieux CL, Arlt VM, White PA. 2016. Tissue-specific in vivo genetic toxicity of nine polycyclic aromatic hydrocarbons assessed using the MutaMouse transgenic rodent assay. Toxicol. Appl. Pharmacol 290:31–42 [DOI] [PMC free article] [PubMed] [Google Scholar]
- 82.Lopez-Otin C, Blasco MA, Partridge L, Serrano M, Kroemer G. 2013. The hallmarks of aging. Cell 153:1194–217 [DOI] [PMC free article] [PubMed] [Google Scholar]
- 83.Lynch M, Ackerman MS, Gout JF, Long H, Sung W, et al. 2016. Genetic drift, selection and the evolution of the mutation rate. Nat. Rev. Genet 17:704–14 [DOI] [PubMed] [Google Scholar]
- 84.Machiela MJ, Zhou W, Karlins E, Sampson JN, Freedman ND, et al. 2016. Female chromosome Xmosaicism is age-related and preferentially affects the inactivated X chromosome. Nat. Commun 7:11843. [DOI] [PMC free article] [PubMed] [Google Scholar]
- 85.Martincorena I, Campbell PJ. 2015. Somatic mutation in cancer and normal cells. Science 349:1483–89 [DOI] [PubMed] [Google Scholar]
- 86.Martincorena I, Roshan A, Gerstung M, Ellis P, Van Loo P, et al. 2015. High burden and pervasive positive selection of somatic mutations in normal human skin. Science 348:880–86 [DOI] [PMC free article] [PubMed] [Google Scholar]
- 87.Maruvka YE, Mouw KW, Karlic R, Parasuraman P, Kamburov A, et al. 2017. Analysis of somatic microsatellite indels identifies driver events in human tumors. Nat. Biotechnol 35:951–59 [DOI] [PMC free article] [PubMed] [Google Scholar]
- 88.Maslov AY, Quispe-Tintaya W, Gorbacheva T, White RR, Vijg J. 2015. High-throughput sequencing in mutation detection: a new generation of genotoxicity tests? Mutat. Res 776:136–43 [DOI] [PMC free article] [PubMed] [Google Scholar]
- 89.Maynard Smith J 1959. A theory of ageing. Nature 184:956–57 [Google Scholar]
- 90.McConnell MJ, Lindberg MR,Brennand KJ, Piper JC, Voet T, et al. 2013. Mosaic copy number variation in human neurons. Science 342:632–37 [DOI] [PMC free article] [PubMed] [Google Scholar]
- 91.Miki Y, Nishisho I, Horii A, Miyoshi Y, Utsunomiya J, et al. 1992. Disruption of the APC gene by a retrotransposal insertion of L1 sequence in a colon cancer. Cancer Res 52:643–45 [PubMed] [Google Scholar]
- 92.Milholland B, Auton A, Suh Y, Vijg J. 2015. Age-related somatic mutations in the cancer genome. Oncotarget 6:24627–35 [DOI] [PMC free article] [PubMed] [Google Scholar]
- 93.Milholland B, Dong X, Zhang L, Hao X, Suh Y, Vijg J. 2017. Differences between germline and somaticmutation rates in humans and mice. Nat. Commun 8:15183. [DOI] [PMC free article] [PubMed] [Google Scholar]
- 94.Mitelman F, Johansson B, Mertens F. 2004. Fusion genes and rearranged genes as a linear function of chromosome aberrations in cancer. Nat. Genet 36:331–34 [DOI] [PubMed] [Google Scholar]
- 95.Mitelman F, Johansson B, Mertens F. 2007. The impact of translocations and gene fusions on cancer causation. Nat. Rev. Cancer 7:233–45 [DOI] [PubMed] [Google Scholar]
- 96.Moncunill V, Gonzalez S, Bea S, Andrieux LO, Salaverria I, et al. 2014. Comprehensive characterization of complex structural variations in cancer by directly comparing genome sequence reads. Nat. Biotechnol 32:1106–12 [DOI] [PubMed] [Google Scholar]
- 97.Mosch B, Morawski M, Mittag A, Lenz D, Tarnok A, Arendt T. 2007. Aneuploidy and DNA replication in the normal human brain and Alzheimer’s disease. J. Neurosci 27:6859–67 [DOI] [PMC free article] [PubMed] [Google Scholar]
- 98.Negrini S, Gorgoulis VG, Halazonetis TD. 2010. Genomic instability—an evolving hallmark of cancer. Nat. Rev. Mol. Cell Biol 11:220–28 [DOI] [PubMed] [Google Scholar]
- 99.Nowell PC. 1976. The clonal evolution of tumor cell populations. Science 194:23–28 [DOI] [PubMed] [Google Scholar]
- 100.Ono T, Ikehata H, Nakamura S, Saito Y, Hosoi Y, et al. 2000. Age-associated increase of spontaneous mutant frequency and molecular nature of mutation in newborn and old lacZ-transgenic mouse. Mutat. Res 447:165–77 [DOI] [PubMed] [Google Scholar]
- 101.Osgood EE. 1957. A unifying concept of the etiology of the leukemias, lymphomas, and cancers. J. Natl. Cancer Inst 18:155–66 [PubMed] [Google Scholar]
- 102.Parsons R, Li GM, Longley M, Modrich P, Liu B, et al. 1995. Mismatch repair deficiency in phenotypically normal human cells. Science 268:738–40 [DOI] [PubMed] [Google Scholar]
- 103.Pinkel D, Straume T, Gray JW. 1986. Cytogenetic analysis using quantitative, high-sensitivity, fluorescence hybridization. PNAS 83:2934–38 [DOI] [PMC free article] [PubMed] [Google Scholar]
- 104.Poduri A, Evrony GD, Cai X, Walsh CA. 2013. Somatic mutation, genomic variation, and neurological disease. Science 341:1237758. [DOI] [PMC free article] [PubMed] [Google Scholar]
- 105.Quispe-Tintaya W, Gorbacheva T, Lee M, Makhortov S, Popov VN, et al. 2016. Quantitative detection of low-abundance somatic structural variants in normal cells by high-throughput sequencing. Nat. Methods 13:584–86 [DOI] [PMC free article] [PubMed] [Google Scholar]
- 106.Ramsey MJ, Moore DH 2nd, Briner JF, Lee DA, Olsen L, et al. 1995. The effects of age and lifestyle factors on the accumulation of cytogenetic damage as measured by chromosome painting. Mutat. Res 338:95–106 [DOI] [PubMed] [Google Scholar]
- 107.Rehen SK, McConnell MJ, Kaushal D, Kingsbury MA, Yang AH, Chun J. 2001. Chromosomal variation in neurons of the developing and adult mammalian nervous system. PNAS 98:13361–66 [DOI] [PMC free article] [PubMed] [Google Scholar]
- 108.Rehen SK, Yung YC, McCreight MP, Kaushal D, Yang AH, et al. 2005. Constitutional aneuploidy in the normal human brain. J. Neurosci 25:2176–80 [DOI] [PMC free article] [PubMed] [Google Scholar]
- 109.Rouhani FJ, Nik-Zainal S, Wuster A, Li Y, Conte N, et al. 2016. Mutational history of a human cell lineage from somatic to induced pluripotent stem cells. PLOS Genet 12:e1005932. [DOI] [PMC free article] [PubMed] [Google Scholar]
- 110.Schrock E, du Manoir S, Veldman T, Schoell B, Wienberg J, et al. 1996. Multicolor spectral karyotyping of human chromosomes. Science 273:494–97 [DOI] [PubMed] [Google Scholar]
- 111.Schukken KM, Foijer F. 2018. CIN and aneuploidy: different concepts, different consequences. Bioessays 40:1700147. [DOI] [PubMed] [Google Scholar]
- 112.Seberg O, Petersen G. 2009. A unified classification system for eukaryotic transposable elements should reflect their phylogeny. Nat. Rev. Genet 10:276. [DOI] [PubMed] [Google Scholar]
- 113.Shao C, Deng L, Henegariu O, Liang L, Raikwar N, et al. 1999. Mitotic recombination produces the majority of recessive fibroblast variants in heterozygous mice. PNAS 96:9230–35 [DOI] [PMC free article] [PubMed] [Google Scholar]
- 114.Stephens PJ, McBride DJ, Lin ML, Varela I, Pleasance ED, et al. 2009. Complex landscapes of somatic rearrangement in human breast cancer genomes. Nature 462:1005–10 [DOI] [PMC free article] [PubMed] [Google Scholar]
- 115.Stuart GR, Oda Y, de Boer JG, Glickman BW. 2000. Mutation frequency and specificity with age in liver, bladder and brain of lacI transgenic mice. Genetics 154:1291–300 [DOI] [PMC free article] [PubMed] [Google Scholar]
- 116.Sturtevant AH. 1937. Essays on evolution. I. On the effects of selection on mutation rate. Quart. Rev. Biol 12:464–76 [Google Scholar]
- 117.Szilard L 1959. On the nature of the aging process. PNAS 45:30–45 [DOI] [PMC free article] [PubMed] [Google Scholar]
- 118.Thomas P, Fenech M. 2008. Chromosome 17 and 21 aneuploidy in buccal cells is increased with ageing and in Alzheimer’s disease. Mutagenesis 23:57–65 [DOI] [PubMed] [Google Scholar]
- 119.Treff NR, Su J, Tao X, Northrop LE, Scott RT Jr. 2011. Single-cell whole-genome amplification technique impacts the accuracy of SNP microarray-based genotyping and copy number analyses. Mol. Hum. Reprod 17:335–43 [DOI] [PMC free article] [PubMed] [Google Scholar]
- 120.Upton KR, Gerhardt DJ, Jesuadian JS, Richardson SR, Sanchez-Luque FJ, et al. 2015. Ubiquitous L1 mosaicism in hippocampal neurons. Cell 161:228–39 [DOI] [PMC free article] [PubMed] [Google Scholar]
- 121.van den Bos H, Spierings DCJ, Taudt AS, Bakker B, Porubský D, et al. 2016. Single-cell whole genome sequencing reveals no evidence for common aneuploidy in normal and Alzheimer’s disease neurons. Genome Biol 17:116. [DOI] [PMC free article] [PubMed] [Google Scholar]
- 122.Van Loo P, Voet T. 2014. Single cell analysis of cancer genomes. Curr. Opin. Genet. Dev 24:82–91 [DOI] [PubMed] [Google Scholar]
- 123.Vanneste E, Van der Aa N, Voet T, Vermeesch JR. 2012. Aneuploidy and copy number variation in early human development. Semin. Reprod. Med 30:302–8 [DOI] [PubMed] [Google Scholar]
- 124.Vanneste E, Voet T, Le Caignec C, Ampe M, Konings P, et al. 2009. Chromosome instability is common in human cleavage-stage embryos. Nat. Med 15:577–83 [DOI] [PubMed] [Google Scholar]
- 125.Vijg J 2007. Aging of the Genome Oxford, UK: Oxford Univ. Press [Google Scholar]
- 126.Vijg J, van Steeg H. 1998. Transgenic assays for mutations and cancer: current status and future perspectives. Mutat. Res 400:337–54 [DOI] [PubMed] [Google Scholar]
- 127.Voet T, Vanneste E, Vermeesch JR. 2011. The human cleavage stage embryo is a cradle of chromosomal rearrangements. Cytogenet. Genome Res 133:160–68 [DOI] [PubMed] [Google Scholar]
- 128.Wahnschaffe U, Bitsch A, Kielhorn J, Mangelsdorf I. 2005. Mutagenicity testing with transgenic mice. Part II: Comparison with the mouse spot test. J. Carcinog 4:4. [DOI] [PMC free article] [PubMed] [Google Scholar]
- 129.Wang J, Fan HC, Behr B, Quake SR. 2012. Genome-wide single-cell analysis of recombination activity and de novo mutation rates in human sperm. Cell 150:402–12 [DOI] [PMC free article] [PubMed] [Google Scholar]
- 130.Watson J, Crick F. 1953. Molecular structure of nucleic acids. Nature 171:737–38 [DOI] [PubMed] [Google Scholar]
- 131.Weismann A 1893. The Germ-Plasm: A Theory of Heredity London: Walter Scott [Google Scholar]
- 132.Wells D, Delhanty JDA. 2000. Comprehensive chromosomal analysis of human preimplantation embryos using whole genome amplification and single cell comparative genomic hybridization. Mol. Hum. Reprod 6:1055–62 [DOI] [PubMed] [Google Scholar]
- 133.Wunderlich V 2007. Early references to the mutational origin of cancer. Int. J. Epidemiol 36:246–47 [DOI] [PubMed] [Google Scholar]
- 134.Yang L, Luquette LJ, Gehlenborg N, Xi R, Haseley PS, et al. 2013. Diverse mechanisms of somatic structural variations in human cancer genomes. Cell 153:919–29 [DOI] [PMC free article] [PubMed] [Google Scholar]
- 135.Yang Y, Geldmacher DS, Herrup K. 2001. DNA replication precedes neuronal cell death in Alzheimer’sdisease. J. Neurosci 21:2661–68 [DOI] [PMC free article] [PubMed] [Google Scholar]
- 136.Yurov YB, Iourov IY, Vorsanova SG, Liehr T, Kolotii AD, et al. 2007. Aneuploidy and confined chromosomal mosaicism in the developing human brain. PLOS ONE 2:e558. [DOI] [PMC free article] [PubMed] [Google Scholar]
- 137.Zhang ZD, Du J, Lam H, Abyzov A, Urban AE, et al. 2011. Identification of genomic indels and structural variations using split reads. BMC Genom 12:375. [DOI] [PMC free article] [PubMed] [Google Scholar]
- 138.Zong C, Lu S, Chapman AR, Xie XS. 2012. Genome-wide detection of single-nucleotide and copynumber variations of a single human cell. Science 338:1622–26 [DOI] [PMC free article] [PubMed] [Google Scholar]