

Abstract
Introduction:
We compared the spatial distribution of tibiofemoral cartilage change between individuals who will develop accelerated knee osteoarthritis (KOA) versus typical onset of KOA prior to the development of radiographic KOA.
Materials and Methods:
We conducted a longitudinal case-control analysis of 129 individuals from the Osteoarthritis Initiative. We assessed the percent change in tibiofemoral cartilage on magnetic resonance images at 36 informative locations from two to one year prior to the development of accelerated (n=44) versus typical KOA (n=40). We defined cartilage change in the accelerated and typical KOA groups at 36 informative locations based on thresholds of cartilage percent change in a no KOA group (n=45). We described the spatial patterns of cartilage change in the accelerated KOA and typical KOA groups and performed a logistic regression to determine if diffuse cartilage change (predictor; at least half of the tibiofemoral regions demonstrating change in multiple informative locations) was associated with KOA group (outcome).
Results:
There was a non-significant trend that individuals with diffuse tibiofemoral cartilage change were 2.2 times more likely to develop accelerated knee OA when compared to individuals who develop typical knee OA (OR [95% CI] = 2.2 [0.90,5.14]. Adults with accelerated or typical KOA demonstrate heterogeneity in spatial distribution of cartilage thinning and thickening.
Conclusions:
These results provide preliminary evidence of a different spatial pattern of cartilage change between individuals that will develop accelerated versus typical KOA. These data suggest there may be different mechanisms driving the early structural disease progression between accelerated versus typical KOA.
Keywords: articular cartilage, tibia, femur
INTRODUCTION
Knee osteoarthritis (OA) is a leading cause of physical disability and is typically characterized by a gradual decline in joint health (Cross et al., 2014). However, a subset of these individuals develops accelerated knee OA, which has been defined in the literature as rapid onset and progression from no radiographic signs of OA to advanced-stage disease in four years or less, oftentimes within 12 months (Driban et al., 2016b). One in seven adults who develops accelerated knee OA will require a knee replacement with a median time of 2.3 years from the first signs of radiographic knee OA progression (Davis et al., 2018). Hence, these individuals present with a shortened window for intervention. Therefore, developing prognostic tools that can detect who is at risk for incident accelerated knee OA is a critical step towards targeting individuals to prevent the development of disease (Chu et al., 2012).
Since articular cartilage alterations are one of the hallmarks of knee OA development (Eckstein et al., 2006), an assessment of cartilage morphology is considered a key outcome in defining early knee OA (Favero et al., 2015; Iolascon et al., 2017; Madry et al., 2016; Pollard et al., 2008). Unlike advanced-stage knee OA that is characterized by a loss of articular cartilage, early knee OA is often characterized by both thinning and thickening of cartilage at various spatial locations within the tibiofemoral joint (Buck et al., 2012; Buck et al., 2013; Buck et al., 2010; Favre et al., 2017; Favre et al., 2013; Wirth et al., 2011). Traditional compartmental cartilage volume assessments that provide a mean estimate of cartilage change throughout an entire region may fail to accurately describe longitudinal cartilage alterations since this technique may average cartilage locations that are experiencing an increase and decrease in cartilage volume (Buck et al., 2017). Therefore, articular cartilage assessments that assess morphology at specific informative cartilage locations throughout a tibiofemoral joint are needed to provide a clear depiction of the spatial distribution of cartilage thickness alterations throughout the tibiofemoral joint.
The annual acquisition of knee images within the Osteoarthritis Initiative (OAI) offers the unique ability to determine longitudinal tibiofemoral cartilage changes prior to the development of radiographic knee OA, as well as how the spatial distribution in cartilage change differs between individuals that develop accelerated knee OA or the typical, gradual onset of knee OA. Understanding the differences in spatial cartilage alteration patterns between individuals with accelerated knee OA and typical knee OA may elucidate different mechanisms involved in the structural pathogenesis between these two OA subsets, and may help provide a structural rationale for the rapid onset and progression of advanced-stage disease in individuals that develop accelerated knee OA. Therefore, the purpose of this manuscript was to compare the spatial distribution of tibiofemoral articular cartilage change between individuals who will develop accelerated knee OA or typical knee OA during a time-period prior to the development of radiographic knee OA. Specifically, we assessed cartilage damage on magnetic resonance (MR) images at 36 informative tibiofemoral locations (Zhang et al., 2014; Zhang et al., 2015) from two to one year prior to the development of accelerated or typical knee OA, and defined cartilage change based on the longitudinal change in individuals who do not develop radiographic knee OA.
MATERIALS AND METHODS
Study Design
To determine the spatial distribution in the change of tibiofemoral cartilage damage prior to the development of accelerated knee OA versus typical knee OA, we conducted a longitudinal nested case-control analysis of data from the OAI focused on three matched groups with comprehensive MR data. The OAI is a multicenter (Memorial Hospital of Rhode Island, The Ohio State University, University of Maryland and Johns Hopkins University, and the University of Pittsburgh) cohort study that recruited 4,796 adults with or at risk for symptomatic knee OA between February 2004 and May 2006 (Eckstein et al., 2012a). Institutional review boards at all OAI clinical sites and the OAI coordinating center (University of California, San Francisco) approved the OAI study. Participants provided informed consent prior to participation. Figure 1 depicts the longitudinal study design.
Figure 1.
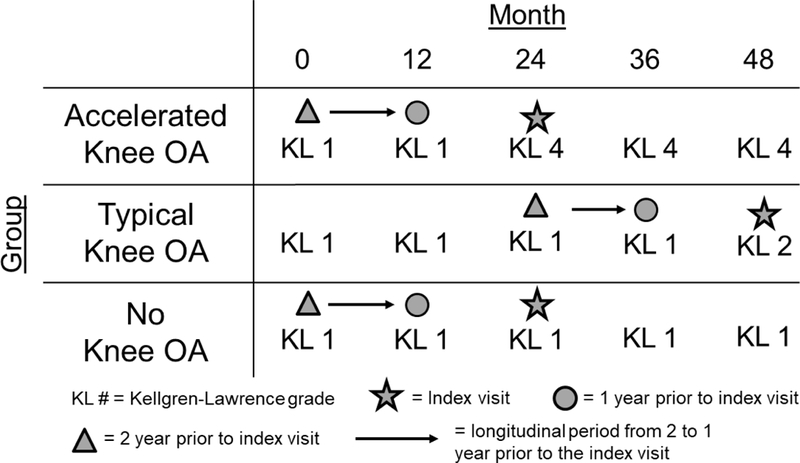
Graphical Representation of the Index Visit and the Timing of the Longitudinal Cartilage Assessments. Cartilage damage change was assessed from two to one year prior to the index visit. Due to our inclusion criteria, this period of longitudinal change occurred when all knee OA groups presented with no radiographic signs of knee OA.
Participant Selection
At baseline, OAI participants eligible for the current study had at least one knee with no evidence of radiographic knee OA at baseline (Kellgren-Lawrence [KL] grade ≤ 1). To implement the design shown in Figure 1, we then classified OAI participants into those with accelerated, typical, or no knee OA based on the rapidity of radiographic knee OA development on annual radiographs from the baseline to the 48-month OAI visit (Figure 1) (Driban et al., 2016b). Figure 2 provides the details for participant selection. Participants who developed incident accelerated knee OA had one knee progress from no radiographic disease to advanced-stage knee OA (KL grade = 0,1 to 3,4) within 12 months (n=71). Participants were classified as having developed incident typical knee OA if they experienced any increase in KL grade within 48 months (excluding the accelerated knee OA cases; n=187). The remaining 1,325 participants experienced no change in KL grade over 48-months (n=1,325) and constituted the “No incident knee OA group”. Individuals within the typical and no knee OA groups were sex-matched to the individuals in the accelerated knee OA group in a 1:1:1 ratio such that there were 71 participants in each group to allow for feasibility of the time needed to complete the image analysis. Lastly, to determine the early longitudinal change in cartilage structure, we limited our analyses to individuals with knee MR images at two and one years prior to their development of knee OA (accelerated knee OA: n=44; typical knee OA: n=40, no knee OA: n=45). We used the amount of cartilage change in the no knee OA group at each tibiofemoral location as the threshold of cartilage change (i.e., thickening: >95th percentile change; thinning: <5th percentile change) for the accelerated and typical knee OA groups. These sample size restrictions allowed us to assess longitudinal pre-radiographic alterations between two early time points when the accelerated and typical knee OA groups presented with no radiographic knee OA in the index knee.
Figure 2.
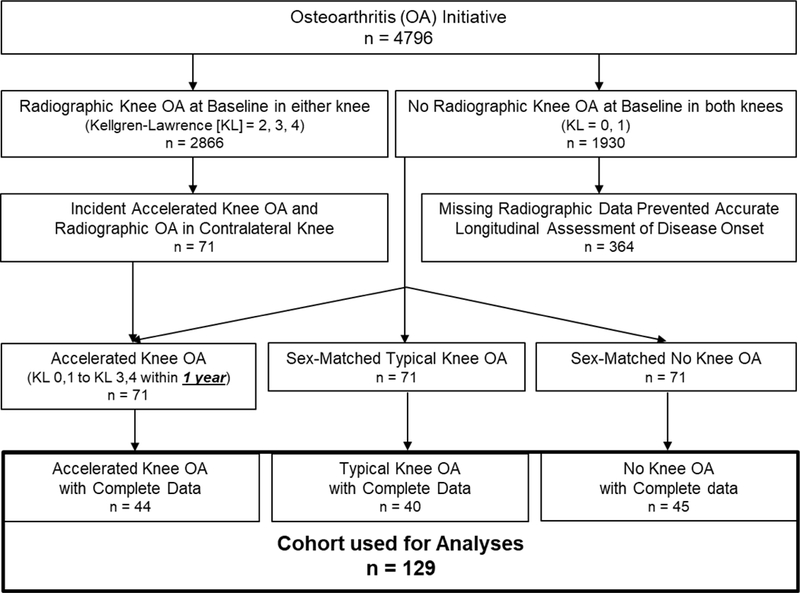
Flow Chart of Eligibility of Included Participants. We limited the accelerated knee OA cohort to the individuals that progressed from no radiographic signs to advanced-stage disease within one year. Additionally, since we conducted a longitudinal cartilage assessment from two to one year prior to the index visit, we limited our cohort to individuals that had magnetic resonance images at both time points. The cartilage change in the No Knee OA group at each of the 36 informative tibiofemoral locations was used to set thresholds of cartilage change for the accelerated and typical knee OA groups.
Index Knee
For individuals with accelerated or typical knee OA, the index knee was defined as the first knee that met the definition for incident accelerated or typical knee OA. The index knee for individuals with no knee OA was side-matched to that person’s matched member of the accelerated knee OA group.
Index and Study Visits
For individuals with accelerated or typical knee OA, the index visit was defined as the visit that the index knee met the criteria for accelerated or typical knee OA. For individuals with no knee OA, the index visit was the same as their matched member of the accelerated knee OA group. For this study, we assessed the change in cartilage structure from two to one year prior to the index visit when all groups presented with no radiographic signs of knee OA (Figure 1).
Knee Radiographs
Bilateral weight-bearing, fixed-flexion posteroanterior knee radiographs obtained at OAI baseline and at the next four annual follow-up visits were used to determine group assignment (Semyonov, 2006). Central readers blinded to group assignment scored the KL Grade of each knee (KL = 0 to 4). The intrarater reliability agreement for the KL grades was good (weighted κ = 0.70 to 0.80) (Eckstein et al., 2012b).
Magnetic Resonance Imaging Acquisition
MR images were acquired annually with identical Siemens (Erlangen, Germany) Trio 3-Tesla MR systems at each clinical site using the OAI MR imaging protocol (Peterfy et al., 2008). Cartilage was assessed at two and one years prior to the index visit using a 3-dimensional dual-echo steady-state sequence with the following parameters: field of view=140mm, slice thickness=0.7mm, slice gap=0mm, flip angle=25 degrees, echo time=4.7ms, repetition time=16.3ms, 307×384 matrix, x resolution=0.365mm, y resolution=0.456mm, and total slice number=160.
Spatial Tibiofemoral Cartilage Damage Assessment
One reader (JED) used a validated semi-automated software to assess tibiofemoral cartilage damage at 36 informative locations (Figure 3) (Zhang et al., 2014; Zhang et al., 2015). These informative locations were validated in previous studies as the locations within the tibiofemoral joint that represent the most frequently denuded regions of cartilage (Zhang et al., 2014; Zhang et al., 2015). Therefore, specifically assessing these informative locations may increase the sensitivity of detecting cartilage change within an individual. One reader manually marked the contour along the bone-cartilage interface (i.e., anteroposterior cartilage length) for the femur and tibia on knee slices that were automatically selected by the software program based on the knee width (i.e., distance between the first and last slice with femoral bone visible). The reader then measured the cartilage thickness at 36 total information locations (i.e., 9 locations for: medial femur, lateral femur, medial tibia, and lateral tibia) that were automatically located by the software program (Figure 3). All measurements were reviewed by the study principal investigator. Our reader demonstrated excellent intra-reader reliability (ICC3,1=0.86 to 0.99).
Figure 3.
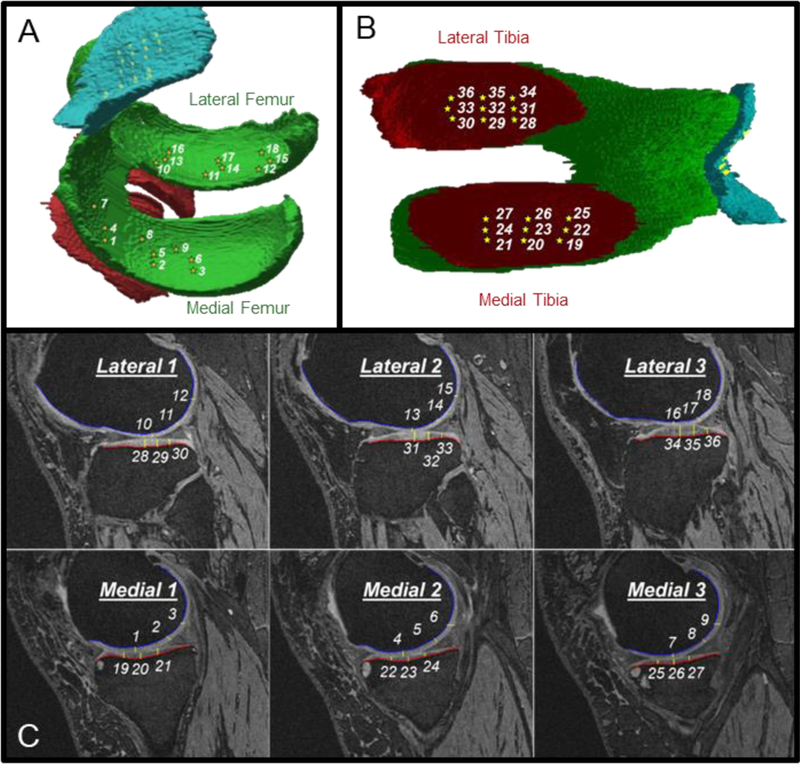
Spatial Distribution of the 36 Informative Tibiofemoral Cartilage Locations. Three-dimensional representation of the informative locations on the femur (A) and tibia (B), as well as the two-dimensional (C) representative of these locations derived from the magnetic resonance images.
To describe the spatial distribution of cartilage change we created a cartilage damage index (CDI) measure for each of the individual 36 informative tibiofemoral cartilage locations. CDI was calculated by multiplying the cartilage thickness and the anteroposterior cartilage length by the three corresponding voxel dimensions to represent a quasi-volume (mm3) for each informative location. This calculation reflects the strategy that is used to calculate CDI across the entire tibiofemoral compartments (McAlindon et al., 2017; Zhang et al., 2014; Zhang et al., 2015). Lastly, the raw CDI value at each point was normalized to the participant’s knee size relative to the average knee size in the study sample (i.e., a participant’s knee width divided by mean knee width among the sample).
We calculated the percent change in CDI at each informative location from two to one year prior to the development of radiographic knee OA. Since all knees had no radiographic OA at both time-points, none of the participants had cartilage denudation at either time point. We chose to analyze a percent change because the different informative locations have varying cartilage thickness. Thus, calculating a percent change created a relative amount of change that is comparable across the informative locations.
Participant Characteristics
Participant characteristics were acquired based on a standard protocol at all clinical sites. We used age, sex, body mass index, WOMAC pain (i.e., greater score indicates worse pain; scored on a scale of 0–20), and KL grade at two years prior to the index visit.
Data and Statistical Analysis
Defining Cartilage Damage Change at Each Tibiofemoral Informative Location
We operationally defined an informative location with longitudinal cartilage change in the accelerated or typical knee OA groups as a location experiencing: 1) greater than the 95th percentile change (i.e., largest cartilage thickening), or 2) lesser than the 5th percentile change (i.e., largest cartilage thinning) in each respective location of the no knee OA group. This is similar to previous methodology that used the relative distribution of cartilage change in a healthy reference group to set thresholds for annual cartilage change (Buck et al., 2013; Buck et al., 2010).
Defining Diffuse Cartilage Damage Change
We defined diffuse cartilage damage change based on the number of informative locations and 4 tibiofemoral regions (i.e. medial/lateral tibia/femur) demonstrating a longitudinal change (i.e. increase or decrease) in cartilage damage. First, for each individual we added the number of informative locations demonstrating change in each tibiofemoral region. Next, we operationally defined change in a tibiofemoral region as at least 2/9 informative locations experiencing change in that region. Lastly, diffuse tibiofemoral cartilage damage change was operationally defined an individual as experiencing regional change in at least 2 out of 4 tibiofemoral regions. This operational definition for diffuse cartilage damage change would require at least half of the tibiofemoral regions demonstrating change in multiple informative locations, which is similar to a previous definition of early diffuse knee OA (Madry et al., 2016). We performed a binary logistic regression to determine if diffuse tibiofemoral cartilage damage change (predictor) was associated with group (i.e., accelerated or typical knee OA). Additionally, we performed a sensitivity analysis restricting our analysis to the 25 sex-matched individuals in both groups.
Patterns of Tibiofemoral Regions Experiencing Diffuse Cartilage Change
We qualitatively described the different patterns of tibiofemoral regions experiencing diffuse cartilage change in the accelerated and typical knee OA groups. This qualitative description allowed us to determine if the majority of individuals within the accelerated or typical knee OA group present with a similar pattern of tibiofemoral compartment cartilage change, as well as how the patterns of cartilage change differ between the two groups.
Prevalence of Cartilage Damage Change at Each Tibiofemoral Informative Location
We determined the percentage of individuals presenting with overall cartilage change (i.e., thickening and thinning combined), as well as individually for thickening and thinning, at all 36 informative locations in the accelerated and typical knee OA groups. Additionally, we qualitatively described the spatial differences between the accelerated and typical knee OA groups.
RESULTS
Demographics
The demographics of the three groups are presented in Table 1. The accelerated knee OA group compared to the typical knee OA group is older, has higher frequency of KL 1, but less knee pain at the visit two years prior to the index visit.
Table 1.
Demographics at Two Years prior to the Index Visit
| Variable | Accelerated Knee OA n=44 |
Typical Knee OA n=40 |
No Knee OA n=45 |
|---|---|---|---|
| Age (years), mean (SD) | 64.4 (8.7) | 57.6 (8.4) | 56.6 (7.5) |
| BMI (kg/m2), mean (SD) | 29.6 (4.9) | 28.9 (5.0) | 27.2 (5.2) |
| WOMAC Pain, mean(SD) | 1.4 (2.5) | 2.1 (3.0) | 1.8 (2.6) |
| KL Grade 0, n(%) | 12 (27%) | 23 (58%) | 30 (67%) |
| Female, n(%) | 29 (65%) | 27 (68%) | 29 (64%) |
OA = osteoarthritis, WOMAC = Western Ontario and McMaster’s Osteoarthritis Index; KL Grade 0 = Frequency of Kellgren-Lawrence Grade 0 (i.e., individuals could only be 0 or 1)
Diffuse Cartilage Damage Change
There was a non-significant trend that individuals with diffuse tibiofemoral cartilage change were 2.2 times more likely to develop accelerated knee OA when compared to individuals who develop typical knee OA [95% confidence intervals (CI)= 0.90, 5.14]) (Table 2). The results of the sensitivity analyses matched the primary analysis.
Table 2.
. Knee Osteoarthritis (OA) Group and Diffuse Tibiofemoral Cartilage Damage Change
| Diffuse Cartilage Change* | Group [n (%)] |
Odds Ratio (95% CI) | |
|---|---|---|---|
| Accelerated Knee OA |
Typical Knee OA |
||
| No | 17 (39%) | 23 (58%) | Reference |
| Yes | 27 (61%) | 17 (42%) | 2.15 (0.90, 5.14) |
Diffuse cartilage change = At least 2/4 tibiofemoral regions demonstrating an operationally defined change in at least 2/9 of their respective informative locations. We operationally defined an informative location with longitudinal cartilage change in the accelerated or typical knee OA groups as a location experiencing: 1) greater than the 95th percentile change (i.e., increase), or 2) lesser than the 5th percentile change (i.e., decrease) in each respective location of the no knee OA group.
Patterns of Tibiofemoral Regions Experiencing Diffuse Cartilage Change
Figure 4 displays the different patterns of tibiofemoral region involvement for individuals experiencing diffuse cartilage change in the 27/44 that develop accelerated knee OA (n=27) and the 17/40 that develop typical knee OA (n=17). A greater percentage of individuals in the accelerated knee OA group (13.6%; 6/44 total) presented with involvement in the entire medial tibiofemoral compartment (i.e., both the femur and tibia) when compared to the individuals experiencing this same pattern in the typical knee OA group (2.5%; 1/40 total). Simultaneous cartilage damage change in the medial femur and lateral tibia represented the most common pattern of tibiofemoral compartment cartilage change in the accelerated knee OA group (27.3%; 12/44) and this pattern was less prevalent in the typical knee OA group (12.5%; 5/40).
Figure 4.
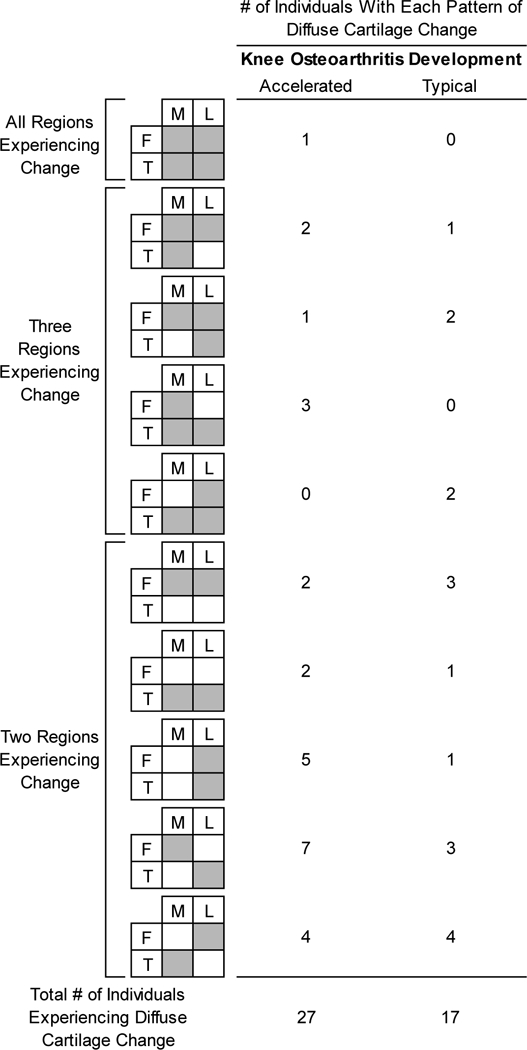
Different Patterns of Tibiofemoral Regions Experiencing Diffuse Cartilage Change Between Accelerated and Typical Knee OA Groups. Outlines the patterns of tibiofemoral compartment involvement and their frequency in individuals with accelerated and typical knee OA with diffuse cartilage damage change. M=medial, L=lateral, F=femur, T=tibia.
Prevalence of Cartilage Damage Change at Each Tibiofemoral Informative Location
Figure 5 highlights the percentage of individuals experiencing thickening, thinning, or overall change (i.e., thickening and thinning combined) of each of the 36 tibiofemoral informative locations in individuals with accelerated or typical knee OA. The accelerated knee OA group presents with more locations (9/36) with >20% of individuals experiencing overall change, thickening, and thinning when compared to the number of locations (4/36) in the typical knee OA. The most medial and posterior location in the medial femur experienced the greatest prevalence (43.2%) for overall change in the individuals with accelerated knee OA. This high prevalence of overall change in the posteromedial medial femur was due to a similar percentage of individuals experiencing cartilage thickening (20.5%) and thinning (22.7%) at this location. We observed a similar number of locations with at least 10% of individuals of cartilage thickening in the accelerated (8/36 regions) and typical knee OA (9/36 regions) groups. However, 25% of locations (9/36) in the typical knee OA do not have a single individual experiencing thickening, but only 8% (3/36) of locations in the accelerated knee OA group had no individuals experiencing cartilage thickening. When comparing the spatial distribution of locations with at least 10% of individuals experiencing cartilage thickening between individuals with accelerated or typical knee OA, only 50% (i.e., 4/8) of these corresponded to the same location between groups. Similarly, only 35% (i.e., 5/14) of the locations with at least 10% of individuals experiencing cartilage thinning corresponded to the same location between the individuals with accelerated and typical knee OA.
Figure 5.
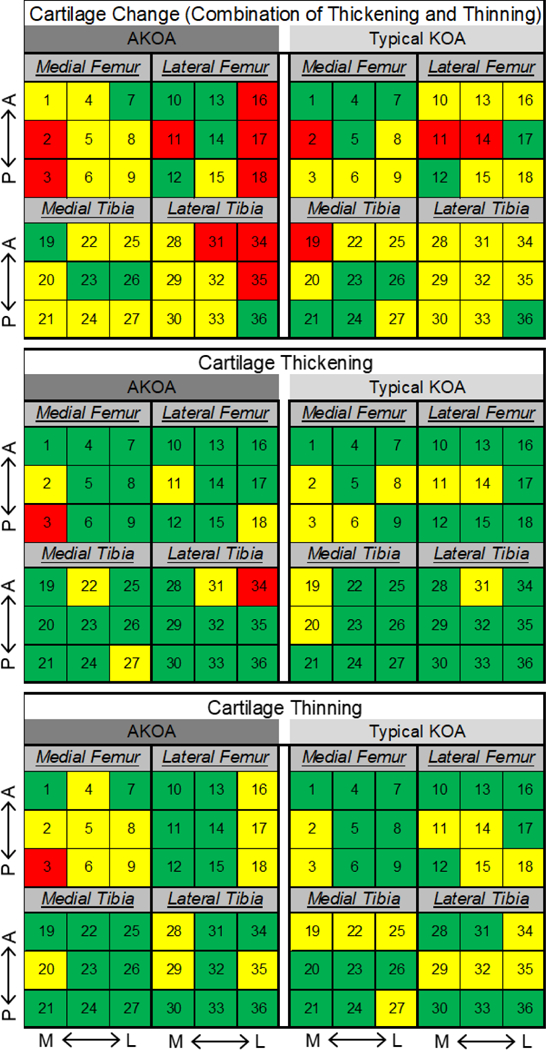
Heat Map Indicating the Percentage of Individuals with Cartilage Damage Change, Thickening, or Thinning at Each Tibiofemoral Informative Location. The number in each square corresponds to the informative location defined in Figure 3. Within each tibiofemoral compartment, top to bottom corresponds to anterior (A) to posterior (P) and left to right corresponds to medial (M) to lateral (L). Percentage of individuals demonstrating change: Green<10%; Yellow 10–20%; Red>20%.
DISCUSSION
Our study provides preliminary evidence that individuals who develop accelerated knee OA may present with more diffuse and spatially heterogeneous pre-radiographic tibiofemoral cartilage change when compared to individuals who develop typical knee OA. This study is in agreement with previous studies that have highlighted differences between accelerated and typical knee OA, including differences in the magnitude and frequency of knee pain (Driban et al., 2016a), performance-based measures of physical function (Driban et al., 2016a), as well as the presence of meniscal extrusion and subchondral damage (Driban et al., 2015). These results provide preliminary information on a heterogeneous cartilage damage progression pattern between individuals that will develop accelerated versus typical knee OA, which indicates there may be different mechanisms driving the early structural disease progression between the two groups.
During a longitudinal period when all participants had no signs of radiographic knee OA, individuals that would develop accelerated knee OA may have more than 2 times the odds of presenting with diffuse tibiofemoral cartilage change when compared to individuals who will develop typical knee OA. Similarly, we observed that the most common pattern of tibiofemoral compartment change in individuals with accelerated knee OA occurred simultaneously within the medial femur and lateral tibia. This may indicate that these individuals commonly exhibit wide-spread, spatially diffuse cartilage changes that are not limited to one side of the bone (i.e., medial or lateral) or one bone within the joint (i.e., femur or tibia). Therefore, assessing individuals for early diffuse cartilage changes may serve as an early prognostic marker of increased risk for the development of accelerated knee OA, which is a critical step needed to prevent accelerated knee OA and limit the burden of this disease.
When assessing the tibiofemoral cartilage damage change in individuals with accelerated or typical knee OA, there appears to be a heterogeneous spatial distribution and a heterogenous directionality to the pattern of cartilage change. First, there appears to be a heterogeneous spatial distribution in cartilage damage change, as the locations where people are experiencing the most change is different between individuals with accelerated versus typical knee OA. Specifically, when comparing the informative locations where >10% of individuals were experiencing change, only 50% of the thickening locations and 35% of the thinning locations were similar between the individuals with accelerated or typical knee OA. Secondly, there is a heterogeneous directionality of cartilage damage change as there is evidence of simultaneous cartilage thickening and thinning occurring throughout the tibiofemoral joint. While late-stage knee OA is characterized by cartilage thinning, cartilage thickening often occurs in early knee OA (Buck et al., 2010). The thickening is theorized to be due to disruption in the cartilage extracellular matrix (i.e., proteoglycan depletion or collagen network disorganization) that results in an influx of water that leads to cartilage swelling (Buck et al., 2010; Chou et al., 2009; Lusse et al., 2000). Our results of heterogeneous cartilage alterations (i.e., both thickening and thinning within the same knee) are complementary to earlier work; however, the previous studies have focused on cross-sectional differences in spatial patterns of cartilage volume at varying levels of radiographic severity(Favre et al., 2017; Favre et al., 2013; Graverand et al., 2010; Graverand et al., 2009) or longitudinal changes in individuals with established radiographic knee OA(Favre et al., 2017; Favre et al., 2013; Graverand et al., 2010; Graverand et al., 2009). This study is innovative as it provides evidence of differences in the early spatial distribution of longitudinal cartilage change prior to the development of radiographic knee OA within two different knee OA subsets. Since traditional compartmental techniques average the cartilage volume over a large region, the simultaneous thickening and thinning detected in this study may essentially cancel each other out, rendering these traditional techniques less sensitive to important subtle heterogeneous cartilage alterations. Thus, this study highlights the importance of cartilage assessment techniques that employ spatially-specific regions of interest that are sensitive enough to detect the heterogenous cartilage changes that occur within individuals.
This heightened chance for diffuse cartilage change in individuals with accelerated knee OA compared to typical knee OA may indicate different mechanisms involved in the structural progression of disease. One potential explanation for this wide-spread cartilage change is an underlying cartilage deficiency that places the entire joint at risk for deterioration. An underlying cartilage deficiency could either be due to an individual’s intrinsic predisposition (i.e., genetics) or acquired due to repetitive harmful stress placed throughout the joint. Cartilage damage in individuals with OA appear to be in part linked to genetics (Pan et al., 2015), and therefore certain individuals may be susceptible to poor cartilage composition that leaves them vulnerable to diffuse cartilage changes. Additionally, changes in the knee kinematics, rotational malalignment, and joint laxity may increase shear stress and shift joint contact forces during walking to infrequently loaded areas of cartilage that are theorized to initiate and progress knee OA (Andriacchi et al., 2004). No matter the cause of an underlying cartilage deficiency, genetics or altered joint kinematics may also help explain why individuals that develop accelerated knee OA present with such a rapid onset and progression to advanced-stage disease and knee replacement (Davis et al., 2018).
Due to the strict inclusion/exclusion criteria used within this study and individuals needing to have multiple MR assessments, we were limited to small sample sizes for each group (Figure 1). However, these criteria allowed us to analyze longitudinal cartilage changes for two unique knee OA subsets during a period when both groups presented with no definitive evidence of radiographic knee OA. Knee OA is a disease that effects all joint structures and not just cartilage. Future studies may want to consider offering a spatial analysis of other OA-related structural features (i.e., meniscal pathology, bone marrow lesions, and effusion) to determine how the spatial distribution of these features differ between individuals who develop accelerated and typical knee OA.
In conclusion, individuals who develop accelerated knee OA experienced diffuse cartilage thickening and thinning throughout the tibiofemoral joint. These results provide preliminary information on a heterogeneous cartilage damage progression pattern between individuals that will develop accelerated versus typical knee OA, which may indicate that there could be different mechanisms driving the structural disease progression between the two groups.
Supplementary Material
ACKNOWLEDGEMENTS
MS Harkey was supported by the National Institutes of Health (grant no. 5 TL1 TR 1454–3). These analyses were financially supported by a grant from the National Institute of Arthritis and Musculoskeletal and Skin Diseases of the National Institutes of Health (grant no. R01-AR065977). The OAI is a public-private partnership comprised of five contracts (N01-AR-2–2258; N01-AR-2–2259; N01-AR-2–2260; N01-AR-2–2261; N01-AR-2–2262) funded by the National Institutes of Health, a branch of the Department of Health and Human Services, and conducted by the OAI Study Investigators. Private funding partners include Merck Research Laboratories; Novartis Pharmaceuticals Corporation, GlaxoSmithKline; and Pfizer, Inc. Private sector funding for the OAI is managed by the Foundation for the National Institutes of Health. This manuscript was prepared using an OAI public use data set and does not necessarily reflect the opinions or views of the OAI investigators, the NIH, or the private funding partners. The funding sources had no role in study design; in the collection, analysis and interpretation of data; in the writing of the report; nor in the decision to submit the article for publication.
References
- Andriacchi TP, Mundermann A, Smith RL, Alexander EJ, Dyrby CO, Koo S. 2004. A framework for the in vivo pathomechanics of osteoarthritis at the knee. Ann Biomed Eng 32:447–457. [DOI] [PubMed] [Google Scholar]
- Buck RJ, Dreher D, Eckstein F. 2012. Femorotibial Cartilage Thickness Change Distributions for Subjects without Signs, Symptoms, or Risk Factors of Knee Osteoarthritis. Cartilage 3:305–313. [DOI] [PMC free article] [PubMed] [Google Scholar]
- Buck RJ, Graverand M-P, Wirth W, Eckstein F. 2017. Choice of knee cartilage thickness change metric for different treatment goals in efficacy studies. Semin Arthritis Rheum 47:315–322. [DOI] [PubMed] [Google Scholar]
- Buck RJ, Wirth W, Dreher D, Nevitt M, Eckstein F. 2013. Frequency and spatial distribution of cartilage thickness change in knee osteoarthritis and its relation to clinical and radiographic covariates - data from the osteoarthritis initiative. Osteoarthritis Cartilage 21:102–109. [DOI] [PubMed] [Google Scholar]
- Buck RJ, Wyman BT, Le Graverand MP, Hudelmaier M, Wirth W, Eckstein F, investigators A. 2010. Osteoarthritis may not be a one-way-road of cartilage loss--comparison of spatial patterns of cartilage change between osteoarthritic and healthy knees. Osteoarthritis Cartilage 18:329–335. [DOI] [PubMed] [Google Scholar]
- Chou MC, Tsai PH, Huang GS, Lee HS, Lee CH, Lin MH, Lin CY, Chung HW. 2009. Correlation between the MR T2 value at 4.7 T and relative water content in articular cartilage in experimental osteoarthritis induced by ACL transection. Osteoarthritis Cartilage 17:441–447. [DOI] [PubMed] [Google Scholar]
- Chu CR, Williams AA, Coyle CH, Bowers ME. 2012. Early diagnosis to enable early treatment of pre-osteoarthritis. Arthritis Res Ther 14:212. [DOI] [PMC free article] [PubMed] [Google Scholar]
- Cross M, Smith E, Hoy D, Nolte S, Ackerman I, Fransen M, Bridgett L, Williams S, Guillemin F, Hill CL, Laslett LL, Jones G, Cicuttini F, Osborne R, Vos T, Buchbinder R, Woolf A, March L. 2014. The global burden of hip and knee osteoarthritis: estimates from the global burden of disease 2010 study. Ann Rheum Dis 73:1323–1330. [DOI] [PubMed] [Google Scholar]
- Davis JE, Liu SH, Lapane K, Harkey MS, Price LL, Lu B, Lo GH, Eaton CB, Barbe MF, McAlindon TE, Driban JB. 2018. Adults with incident accelerated knee osteoarthritis are more likely to receive a knee replacement: data from the Osteoarthritis Initiative. Clin Rheumatol 37:1115–1118. [DOI] [PMC free article] [PubMed] [Google Scholar]
- Driban JB, Price LL, Eaton CB, Lu B, Lo GH, Lapane KL, McAlindon TE. 2016a. Individuals with incident accelerated knee osteoarthritis have greater pain than those with common knee osteoarthritis progression: data from the Osteoarthritis Initiative. Clin Rheumatol 35:1565–1571. [DOI] [PMC free article] [PubMed] [Google Scholar]
- Driban JB, Stout AC, Lo GH, Eaton CB, Price LL, Lu B, Barbe MF, McAlindon TE. 2016b. Best performing definition of accelerated knee osteoarthritis: data from the Osteoarthritis Initiative. Ther Adv Musculoskelet Dis 8:165–171. [DOI] [PMC free article] [PubMed] [Google Scholar]
- Driban JB, Ward RJ, Eaton CB, Lo GH, Price LL, Lu B, McAlindon TE. 2015. Meniscal extrusion or subchondral damage characterize incident accelerated osteoarthritis: Data from the Osteoarthritis Initiative. Clin Anat 28:792–799. [DOI] [PMC free article] [PubMed] [Google Scholar]
- Eckstein F, Cicuttini F, Raynauld JP, Waterton JC, Peterfy C. 2006. Magnetic resonance imaging (MRI) of articular cartilage in knee osteoarthritis (OA): morphological assessment. Osteoarthritis Cartilage 14 Suppl A:A46–75. [DOI] [PubMed] [Google Scholar]
- Eckstein F, Wirth W, Nevitt MC. 2012a. Recent advances in osteoarthritis imaging--the osteoarthritis initiative. Nat Rev Rheumatol 8:622–630. [DOI] [PMC free article] [PubMed] [Google Scholar]
- Eckstein F, Wirth W, Nevitt MC. 2012b. Recent advances in osteoarthritis imaging—the Osteoarthritis Initiative. Nature Reviews Rheumatology 8:622. [DOI] [PMC free article] [PubMed] [Google Scholar]
- Favero M, Ramonda R, Goldring MB, Goldring SR, Punzi L. 2015. Early knee osteoarthritis. RMD Open Suppl 1:1–7. [DOI] [PMC free article] [PubMed] [Google Scholar]
- Favre J, Erhart‐Hledik JC, Blazek K, Fasel B, Gold GE, Andriacchi TP. 2017. Anatomically Standardized Maps Reveal Distinct Patterns of Cartilage Thickness With Increasing Severity of Medial Compartment Knee Osteoarthritis. J Orthop Res 35:2442–2451. [DOI] [PubMed] [Google Scholar]
- Favre J, Scanlan SF, Erhart-Hledik JC, Blazek K, Andriacchi TP. 2013. Patterns of femoral cartilage thickness are different in asymptomatic and osteoarthritic knees and can be used to detect disease-related differences between samples. J Biomech Eng 135:101002–101010. [DOI] [PMC free article] [PubMed] [Google Scholar]
- Graverand MP, Buck RJ, Wyman BT, Vignon E, Mazzuca SA, Brandt KD, Piperno M, Charles HC, Hudelmaier M, Hunter DJ, Jackson C, Kraus BV, Link TM, Majumdar S, Prasad PV, Schnitzer TJ, Vaz A, Wirth W, Eckstein F. 2010. Change in regional cartilage morphology and joint space width in osteoarthritis participants versus healthy controls: a multicentre study using 3.0 Tesla MRI and Lyon–Schuss radiography. Ann Rheum Dis 69:155–162. [DOI] [PubMed] [Google Scholar]
- Graverand MP, Buck RJ, Wyman BT, Vignon E, Mazzuca SA, Brandt KD, Piperno M, Charles HC, Hudelmaier M, Hunter DJ, Jackson C, Kraus VB, Link TM, Majumdar S, Prasad PV, Schnitzer TJ, Vaz A, Wirth W, Eckstein F. 2009. Subregional femorotibial cartilage morphology in women – comparison between healthy controls and participants with different grades of radiographic knee osteoarthritis. Osteoarthritis Cartilage 17:1177–1185. [DOI] [PubMed] [Google Scholar]
- Iolascon G, Gimigliano F, Moretti A, de Sire A, Migliore A, Brandi ML, Piscitelli P. 2017. Early osteoarthritis: How to define, diagnose, and manage. A systematic review. Eur Geriatr Med 8:383–396. [Google Scholar]
- Lusse S, Claassen H, Gehrke T, Hassenpflug J, Schunke M, Heller M, Gluer CC. 2000. Evaluation of water content by spatially resolved transverse relaxation times of human articular cartilage. Magn Reson Imaging 18:423–430. [DOI] [PubMed] [Google Scholar]
- Madry H, Kon E, Condello V, Peretti GM, Steinwachs M, Seil R, Berruto M, Engebretsen L, Filardo G, Angele P. 2016. Early osteoarthritis of the knee. Knee Surg Sports Traumatol Arthrosc 24:1753–1762. [DOI] [PubMed] [Google Scholar]
- McAlindon TE, LaValley MP, Harvey WF, Price LL, Driban JB, Zhang M, Ward RJ. 2017. Effect of Intra-articular Triamcinolone vs Saline on Knee Cartilage Volume and Pain in Patients With Knee Osteoarthritis: A Randomized Clinical Trial. JAMA 317:1967–1975. [DOI] [PMC free article] [PubMed] [Google Scholar]
- Pan F, Khan H, Ding C, Winzenberg T, Martel-Pelletier J, Pelletier JP, Cicuttini F, Jones G. 2015. Familial effects on structural changes relevant to knee osteoarthritis: a prospective cohort study. Osteoarthritis Cartilage 23:559–564. [DOI] [PubMed] [Google Scholar]
- Peterfy CG, Schneider E, Nevitt M. 2008. The osteoarthritis initiative: report on the design rationale for the magnetic resonance imaging protocol for the knee. Osteoarthritis Cartilage 16:1433–1441. [DOI] [PMC free article] [PubMed] [Google Scholar]
- Pollard TC, Gwilym SE, Carr AJ. 2008. The assessment of early osteoarthritis. J Bone Joint Surg Br 90:411–421. [DOI] [PubMed] [Google Scholar]
- Semyonov A 2006. Radiographic Procedure Manual for Examinations of the Knee, Hand, Pelvis and Lower Limbs for the Osteoarthritis Initiative. http://oai.epi-ucsf.org/datarelease/operationsmanuals/radiographicmanual.pdf [8/2/2018].
- Wirth W, Buck R, Nevitt M, Graverand MPH, Benichou O, Dreher D, Davies RY, Lee JH, Picha K, Gimona A, Maschek S, Hudelmaier M, Eckstein F, for the Investigators OAI. 2011. MRI-based extended ordered values more efficiently differentiate cartilage loss in knees with and without joint space narrowing than region-specific approaches using MRI or radiography – data from the OA initiative. Osteoarthritis Cartilage 19:689–699. [DOI] [PMC free article] [PubMed] [Google Scholar]
- Zhang M, Driban JB, Price LL, Harper D, Lo GH, Miller E, Ward RJ, McAlindon TE. 2014. Development of a rapid knee cartilage damage quantification method using magnetic resonance images. BMC Musculoskelet Disord 15:264. [DOI] [PMC free article] [PubMed] [Google Scholar]
- Zhang M, Driban JB, Price LL, Lo GH, Miller E, McAlindon TE. 2015. Development of a Rapid Cartilage Damage Quantification Method for the Lateral Tibiofemoral Compartment Using Magnetic Resonance Images: Data from the Osteoarthritis Initiative. Biomed Res Int 2015:634275. [DOI] [PMC free article] [PubMed] [Google Scholar]
Associated Data
This section collects any data citations, data availability statements, or supplementary materials included in this article.