Abstract
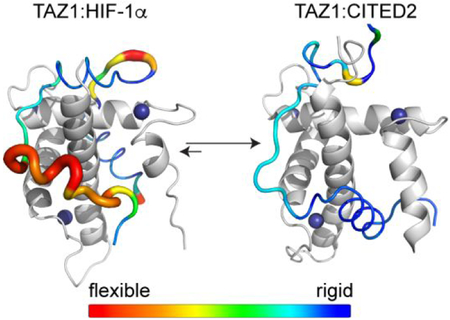
The intrinsically disordered transactivation domains of HIF-1α and CITED2 compete for binding of the TAZ1 domain of the CREB-binding protein (CBP) by a unidirectional allosteric mechanism involving direct competition for shared binding sites, ternary complex formation, and TAZ1 conformational changes. To obtain insight into the mechanism by which CITED2 displaces HIF-1α from TAZ1, we used NMR spin relaxation methods to obtain an atomic-level description of the picosecond to nanosecond backbone dynamics that contribute to TAZ1 binding and competition. We show that HIF-1α and CITED2 adopt different dynamics in their complexes with TAZ1, with flexibility of HIF-1α observed in regions that would maintain accessibility for CITED2 to bind to TAZ1 and facilitate subsequent HIF-1α dissociation. In contrast, critical regions of CITED2 adopt a rigid structure in its complex with TAZ1, minimizing the ability of HIF-1α to compete for binding. We also find that TAZ1, previously thought to be a rigid scaffold for binding of disordered protein ligands, displays altered backbone dynamics in its various bound states. TAZ1 is more rigid in its CITED2-bound state than in its free state or in complex with HIF-1α, with increased rigidity observed not only in the CITED2 binding site but also in regions of TAZ1 that undergo conformational changes between the HIF-1α and CITED2 bound structures. Taken together, these data suggest that backbone dynamics in TAZ1, as well as in the HIF-1α and CITED2 ligands, play a role in modulating occupancy of TAZ1 and highlight the importance of characterizing both binding partners in molecular interactions.
Graphical Abstract
INTRODUCTION
Intrinsically disordered proteins (IDPs) play important roles in a wide range of biological processes, making them attractive targets for biophysical investigation and potential therapeutic intervention. Many recent advances have been made towards understanding how disordered proteins recognize and bind to their molecular partners.1,2 Protein-protein interactions involving disordered proteins often involve multiple binding motifs occupying spatially distinct molecular surfaces, which makes structure-based design of specific inhibitors challenging.3-5 However, insight into molecular recognition processes involving IDPs can be obtained from characterizing the dynamics of IDPs bound to their cellular partners.
Recent studies using NMR spectroscopic methods as well as molecular dynamics simulations have illustrated the complexity of IDPs and their binding mechanisms,6-11 with the bound IDPs often sampling a wide range of dynamics throughout the polypeptide chain. These studies have provided detailed information on the dynamics of IDP ligands in complex with their macromolecular partners, but little is known about the role of dynamics in facilitating exchange between disordered ligands that bind to common target molecules. Additionally, the majority of studies to characterize the dynamics of protein complexes featuring IDPs have focused on the IDPs themselves but not their globular protein binding partners,12-16 resulting in an incomplete view of these complex molecular recognition processes.
The disordered C-terminal transactivation domain of the transcription factor hypoxia-inducible factor-1α (HIF-1α, UniProtKB Q16665) binds to the TAZ1 domain of the general transcriptional coactivators CREB-binding protein (CBP, UniProtKB P45481) and p300.17,18 The negative feedback regulator CITED2 (UniProtKB Q99967) also binds to TAZ1, competing with HIF-1α for binding to a partially overlapping site.19-21 The transactivation domains of HIF-1α and CITED2 are both disordered in solution but adopt helical structures in their binary complexes with TAZ1; the helical regions of HIF-1α and CITED2 flank a conserved linear LP(Q/E)L motif that occupies the same binding site on TAZ1.17,18,20,21 We recently showed that HIF-1α and CITED2 function synergistically to form a hypersensitive, unidirectional molecular switch that efficiently down regulates the hypoxic response; CITED2 very efficiently displaces HIF-1α from its TAZ1 complex whereas HIF-1α is ineffective in displacing CITED2 from its complex with TAZ1.22 Heteronuclear NOE measurements of bound HIF-1α and CITED2 peptides in complex with the TAZ1 domain suggested that picosecond to nanosecond backbone dynamics in the N-terminal region of the bound HIF-1α facilitate initial recognition of TAZ1 by the N-terminal region of CITED2.22 CITED2 binds to the TAZ1:HIF-1α complex and triggers an allosteric conformational change in TAZ1, enabling subsequent displacement of HIF-1α by CITED2 through direct competition for a shared binding site.22
To further characterize the molecular mechanism for unidirectional competition between HIF-1α and CITED2 at atomic resolution, we have used NMR spin relaxation data, Model-Free analysis, and reduced spectral density mapping to probe the contributions of picosecond to nanosecond backbone dynamics of HIF-1α, CITED2 and TAZ1 to the overall competition process. Consistent with previous studies, we find that HIF-1α is considerably more dynamic than CITED2 when bound to TAZ1, and that the most flexible regions of HIF-1α occupy the same regions of TAZ1 that comprise the primary CITED2 binding site. This suggests that flexibility of the bound HIF-1α enables recognition of TAZ1 by CITED2, while the apparent lack of CITED2 flexibility in the shared binding site blocks interaction with HIF-1α. Additionally, we find that intrinsic flexibility of the TAZ1 domain of CBP plays a major role in binding of disordered ligands, as well as in promoting efficient displacement of HIF-1α by CITED2.
MATERIALS AND METHODS
Sample preparation.
The HIF-1α C-terminal transactivation domain (residues 776-826 of human HIF-1α), CITED2 C-terminal transactivation domain (residues 216-269 of human CITED2), and TAZ1 domain of CBP (residues 340-439 of mouse CBP) were prepared as previously described.22,23 Uniform 15N labeling was achieved in minimal media with 15N ammonium sulfate and 15N ammonium chloride as the sole nitrogen sources. For all NMR samples, the concentration of the isotopically labeled component was 350 μM. For NMR samples of protein complexes, the unlabeled component was present in a 1.5-fold molar excess. All NMR samples were prepared in buffer containing 20 mM Tris pH 6.8, 50 mM NaCl, 2 mM DTT, and 5% D2O.
NMR experiments.
15N T1, T2, and {1H}-15N NOE were measured on Bruker AVANCE 500 and DRX 600 MHz spectrometers at 298 K using pulse sequences described previously.24,25 Both spectrometers were equipped with cryo-probes. For T1 measurements, ten fully interleaved spectra were collected with relaxation delays of 0.01*, 0.04, 0.08, 0.15, 0.2, 0.3, 0.5*, and 0.8 seconds (the asterisks indicate duplicate measurements). For T2 measurements, fifteen fully interleaved spectra were collected with relaxation delays of 6*, 10, 18, 26, 34, 42, 50*, 58, 66, 82, 90, and 98* milliseconds. The {1H}-15N NOE was measured in triplicate in a fully interleaved manner with 4 s of proton saturation and a 6 s recycle delay. A recycle delay of 10 s was used for the {1H}-15N NOE reference experiments. All spectra were processed using NMRPipe26 and analyzed using SPARKY.27,28 To derive relaxation rates R1 (= 1/T1) and R2 (= 1/T2), peak intensities were fit to a single exponential decay function, I(t) = I0e(−Rt), in which t is the variable relaxation delay and R is the relaxation rate. Experimental errors were estimated from the standard deviations of the peak intensities from duplicate experiments. The {1H}-15N NOE was determined from the ratio of peak intensity measured in the saturated and unsaturated spectra (=Isat/Iunsat). Experimental errors were estimated from standard deviations of the peak intensity ratios of triplicate experiments. Results are reported only for unambiguously assigned resonances that are not overlapped in the 1H-15N HSQC spectrum and that have sufficient signal-to-noise such that peak intensities can be reliably quantified.
Model-Free Analysis and Reduced Spectral Density Mapping.
Model-Free analysis of 15N R1, 15N R2, and {1H}-15N NOE datasets acquired at 500 and 600 MHz was carried out using in-house software29 incorporating the extended Lipari-Szabo formalism.30-32 An axially symmetric diffusion tensor was optimized for free TAZ1 (PDB ID: 1U2N),23 the TAZ1:HIF-1α complex (PDB ID: 1L8C),17 and the TAZ1:CITED2 complex (PDB ID: 1R8U)20 for residues with {1H}-15N NOE > 0.65 at 600 MHz. Model-Free model selection was performed using the Bayesian Information Criterion (BIC)33,34 after excluding unrealistic models for which S2 > 1, τe < 0 ns and/or Rex < 0. Uncertainties in the Model-Free parameters were determined from 500 Monte Carlo simulations. Reduced spectral density mapping was carried out according to the approach described by Farrow et al.35 For all calculations, the 15N chemical shift anisotropy and amide N-H bond length were assumed to be −172 ppm and 1.02 Å, respectively.
RESULTS
Fast timescale dynamics of 15N HIF-1α and 15N CITED2 in complex with TAZ1.
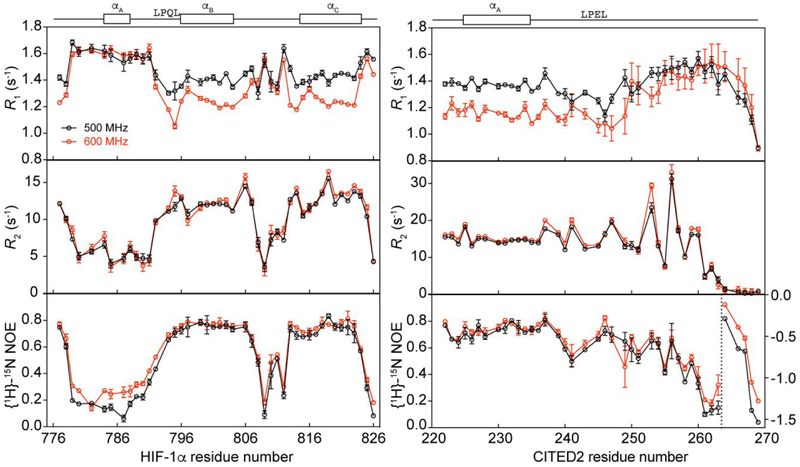
NMR spin relaxation experiments were carried out at two static magnetic field strengths (11.7 and 14.1 T) to characterize the fast timescale backbone dynamics of 15N HIF-1α and 15N CITED2 in their binary complexes with TAZ1. The 15N R1, 15N R2, and {1H}-15N heteronuclear NOE spin relaxation rate constants for both peptides in complex with TAZ1 are shown in Figure 1. The relaxation rates are consistent with the NMR structure ensembles of the HIF-1α and CITED2 peptides in complex with the CBP TAZ1 domain.17,20 For the 15N HIF-1α:TAZ1 complex, elevated R1 values and reduced R2 and heteronuclear NOE values are observed in the N-terminal region encompassing the αA helix (residues 784-788) as well as the linker region between the αB and αC helices (residues 805-814), suggesting flexibility in these regions on the picosecond to nanosecond timescale. Flexibility in these regions is consistent with the ensemble of lowest-energy solution structures for the HIF-1α:TAZ1 complex (PDB ID: 1L8C),17 for which the greatest structural heterogeneity is observed within these regions (Figure S1A). In further agreement with the ensemble of solution structures, reduced R1 values and elevated R2 and heteronuclear NOE values are observed for the conserved LPQL motif (residues 792-795), αB (residues 796-804) and αC (residues 815-824) helices of HIF-1α, suggesting that these regions are less dynamic on the picosecond to nanosecond timescale. Further examination of the spin relaxation data reveals that I806 (in the linker between the αB and αC helices) and L819 (in the αC helix) have higher R2 values than their neighboring residues, suggesting motions on slower timescales. These two hydrophobic residues form critical contacts in complex with TAZ1. It is also notable that the relaxation data for the extreme N-terminal residues (D777 and L778) reveal motional restrictions indicative of intermolecular contacts with TAZ1, even though these residues are disordered in the NMR structure ensemble.
Figure 1.
NMR spin relaxation data for 15N HIF-1α:TAZ1 and 15N CITED2:TAZ1 complexes. 15N R1, 15N R2, and {1H}-15N NOE data collected at 500 MHz (black) and 600 MHz (red) are shown for 15N HIF-1α:TAZ1 (left) and 15N CITED2:TAZ1 (right). The secondary structures formed by HIF-1α (left) and CITED2 (right) in complex with TAZ1 and the conserved LP(Q/E)L motif are shown above the graphs for reference. {1H}-15N NOE data for CITED2 residues 264-269 (to the right of the dashed vertical line) are plotted on the right y-axis.
Markedly less variation in the spin relaxation rate constants is observed for CITED2 in complex with TAZ1. The R1, R2, and heteronuclear NOE values are relatively uniform throughout the CITED2 peptide (Figure 1), with major deviations observed only in the C-terminal region. This lack of conformational heterogeneity is also reflected in the ensemble of solution structures for the CITED2:TAZ1 complex (PDB ID: 1R8U)20 in which a high degree of structural variability is observed only for residues 258-269 at the C-terminus (Figure S1B). As was observed for the HIF-1α:TAZ1 complex, a number of key contact residues in CITED2 (including E225, L237, K241, W247, F253, M256, F259, and V260) also have above average R2 values, suggesting exchange on slower timescales.
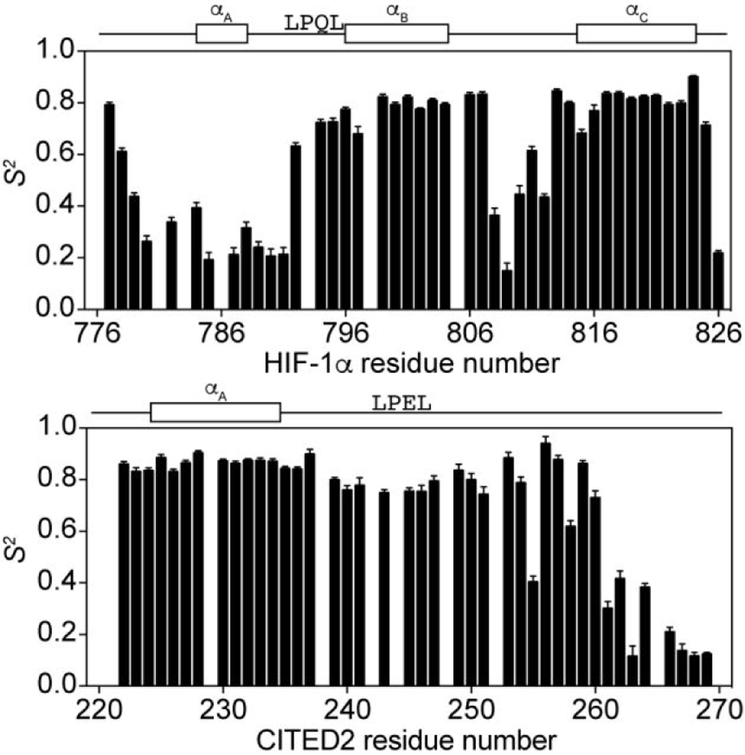
The order parameters (S2), which are a measure of the amplitude of the angular motion of the N-H bond vector, were determined by Model-Free analysis for 15N HIF-1α and 15N CITED2 in complex with TAZ1 and agree well with the trends observed from the individual spin relaxation rate constants. In the 15N HIF-1α:TAZ1 complex, the calculated order parameters (Figure 2) range from 0.2 to 0.9, with high S2 values observed for the LPQL motif (average S2 = 0.7 ± 0.05 for residues 792-795) and the αB and αC helices (average S2 = 0.79 ± 0.05 for residues 796-804 (αB) and 0.81 ± 0.05 for residues 815-824 (αC)). The lowest S2 values are found in the N-terminal region (average S2 = 0.26 ± 0.06 for residues 780-791) and the linker between αB and αC (average S2 = 0.4 ± 0.2 for residues 808-812), consistent with large amplitude (of the order of 40-50°)36 fluctuations of the backbone dihedral angles. A high degree of backbone flexibility in the N-terminal region and the linker between αB and αC is further supported by the presence of additional fast internal motions as indicated by the τe values shown in Figure S2. S2 values greater than 0.8 were also determined for I806, Q807, L813, and Q814, all of which form critical contacts with TAZ1 residues in the bound state.17
Figure 2.
Backbone amide order parameters (S2) for 15N HIF-1α:TAZ1 and 15N CITED2:TAZ1 complexes. S2 values obtained from Model-Free analysis of the NMR spin relaxation data are shown for 15N HIF-1α:TAZ1 (top) and 15N CITED2:TAZ1 (bottom).The secondary structures formed by HIF-1α (top) and CITED2 (bottom) in complex with TAZ1 and the conserved LP(Q/E)L motif are shown above the graphs for reference.
In contrast to the wide variation in backbone dynamics of 15N HIF-1α in its complex with TAZ1, CITED2 displays much more uniform dynamics when bound to TAZ1. The average S2 value for all residues up to T257 is 0.82 ± 0.09 (Figure 2). From D258 through the C-terminus, the S2 value decreases dramatically, consistent with the low heteronuclear NOE values and R2 rate constants measured for this region (Figure 1). Notably, these C-terminal residues are in the only region of CITED2 that does not make critical contacts with TAZ1 in the solution structure.20 The spin relaxation rate constants, order parameters, and an increase in the correlation time for internal motions (τe) for the C-terminal region of CITED2 (Figure S2) indicate that the C-terminal region of CITED2 likely remains completely disordered in the complex with TAZ1.
To exclude potential biases introduced by the Model-Free formalism, we also used a reduced spectral density mapping approach35,37-39 to further assess the dynamic properties of HIF-1α and CITED2 in their binary complexes with TAZ1. Specifically, we were interested to determine whether the use of a single rotational correlation time (τm) in the Model-Free approach skewed the dynamic profiles of the HIF-1α and CITED2 peptides. Values of J(0), J(ωN), and J(0.87ωH) for all assigned, well-resolved amide resonances of the 15N HIF-1α:TAZ1 and 15N CITED2:TAZ1 complexes at two static magnetic field strengths are shown in Figure S3. For both complexes, the J(0.87ωH) values directly mirror the trend of S2 values across the peptide sequence, suggesting that the order parameters obtained by Model-Free analysis provide a valid depiction of the dynamic characteristics of the HIF-1α and CITED2 peptides in their complexes with TAZ1.
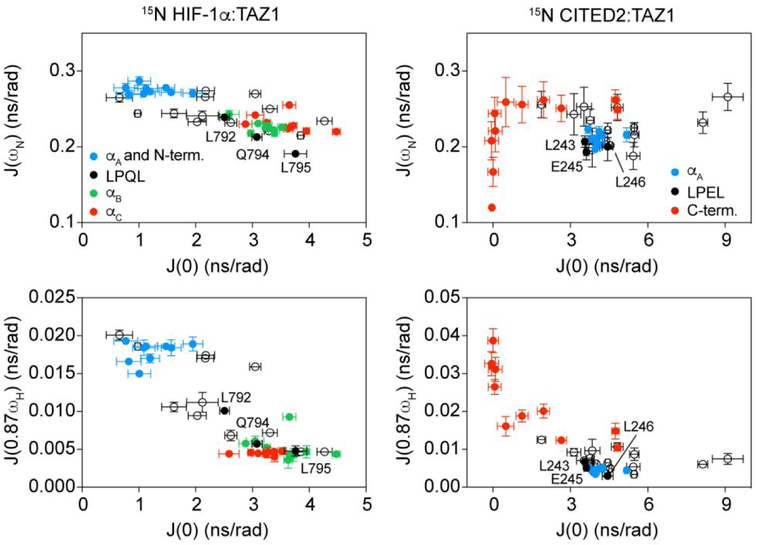
It has been shown previously that correlations between J(ωN) and J(0) and J(0.87ωH) and J(0) can be used to identify clusters of residues with similar dynamic properties.37 These correlation plots are highly informative about the differential dynamics observed for the HIF-1α and CITED2 peptides in their binary complexes with TAZ1. For CITED2, the spectral densities J(ωN) and J(0.87ωH) for residues 220 to 257 are uniformly clustered as a function of J(0), with differences observed for the C-terminal residues which have lower J(0) values than the less flexible N-terminal region (Figure 3). This suggests that the individual binding motifs of CITED2 (the αA helix and the conserved LPEL motif) function as a single, thermodynamically coupled unit.22,40 Similar analysis of the higher frequency spectral densities of HIF-1α reveals a different pattern, with three discrete clusters evident. These three distinct groups of residues largely correspond to the disordered N-terminal region, the LPQL motif and the αB helix, and the αC helix (Figure 3). It is of note that the spectral densities show that the backbone amide of the first residue of the LPQL motif, L792, is considerably more dynamic than the other residues in the motif. Overall, the spectral densities further support the trends observed in the individual spin relaxation rate constants and Model-Free analysis, indicating that differential dynamics in the 15N HIF-1α:TAZ1 and 15N CITED2:TAZ1 complexes could play an important role in their unidirectional competition for TAZ1.
Figure 3.
Evidence for dynamic clustering within binding motifs in 15N HIF-1α:TAZ1 and 15N CITED2:TAZ1. The spectral densities J(ωN) (top) and J(0.87ωH) (bottom) are plotted as a function of J(0) for 15N HIF-1α:TAZ1 (left) and 15N CITED2:TAZ1 (right) for data collected at 600 MHz. Data corresponding to discrete binding motifs of HIF-1α and CITED2 are shown in the colors indicated in the legends. Data points corresponding to the residues in the conserved LP(Q/E)L motif are labeled.
Contributions of TAZ1 backbone dynamics.
The TAZ1 domain of CBP has previously been described as a scaffold for binding disordered ligands,23 however, careful comparison of the lowest energy solution structures of TAZ1 in its free state23 and in complex with HIF-1α17 and CITED220 illustrate subtle differences (Figure S4) that could influence binding to different ligands. To determine the potential contributions of TAZ1 backbone dynamics to ligand binding and competition, we measured 15N R1 15N R2, and {1H}-15N heteronuclear NOE spin relaxation rate constants for free 15N TAZ1,15N TAZ1 bound to HIF-1α, and 15N TAZ1 bound to CITED2 (Figure S5). From the individual spin relaxation rate constants, the dynamic profile of 15N TAZ1 does not appear to be drastically different in the free or bound states, with the measured R1, R2, and {1H}-15N NOE values consistent with the structural data.
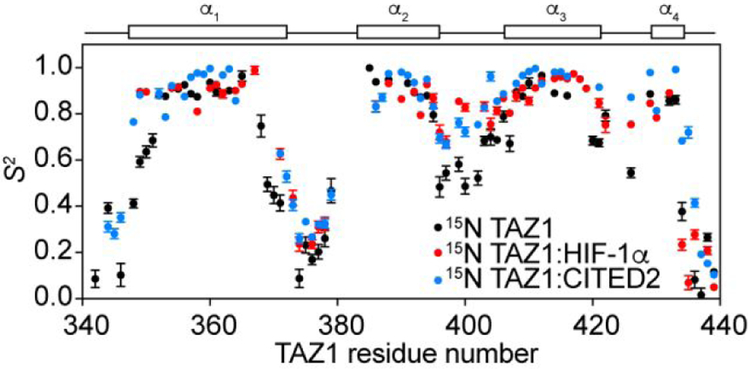
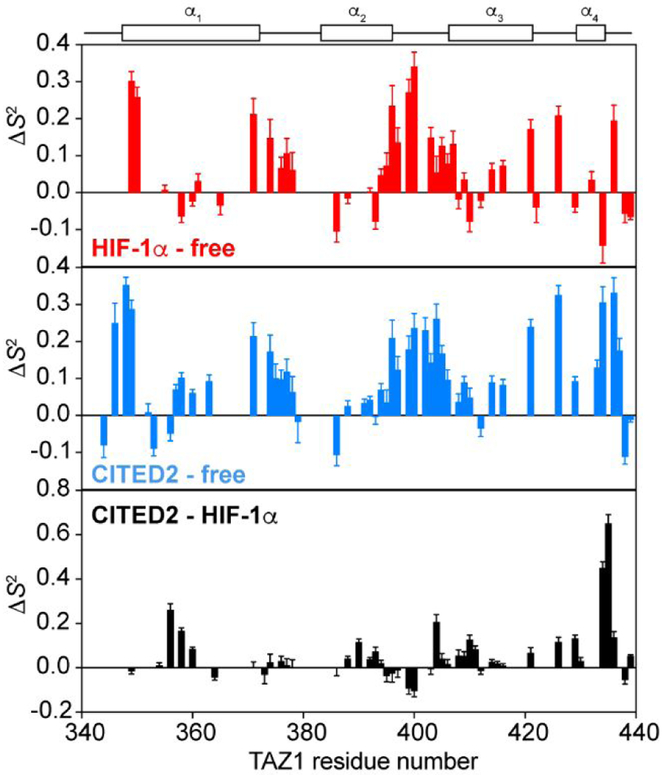
Order parameters determined by Model-Free analysis provide insight into the subtle conformational differences observed between 15N TAZ1, 15N TAZl:HIF-1α, and 15N TAZ1:CITED2 (Figure 4). In general, high S2 values are observed for the four amphipathic helices, with lower S2 values in the loops between them. For free 15N TAZ1, reduced S2 values are also observed for the N- and C-terminal ends of the helical segments, indicating dynamic fraying of the helices. Upon binding of HIF-1α or CITED2, it appears that the helices of TAZ1 become more stable, with average S2 values of 0.87 ± 0.07 for helical regions of the 15N TAZ1:HIF-1α complex and 0.89 ± 0.05 for the 15N TAZ1:CITED2 complex (as compared to average S2 = 0.83 ± 0.08 for free 15N TAZ1). Increased S2 values are observed for both the 15N TAZ1:HIF-1α and 15N TAZ1:CITED2 complexes at both ends of the TAZ1 α1 helix and in the zinc binding loop between α2 and α3 (Figure 5). In the 15N TAZ1:CITED2 complex, increased order parameters are also observed for the α4 helix, consistent with formation of an extended α4 helix in the solution structure of this complex (Figure S4).
Figure 4.
Backbone amide order parameters (S2) for 15N TAZ1,15N TAZ1:HIF-1α and 15N TAZ1:CITED2 complexes. S2 values obtained from Model-Free analysis of the NMR spin relaxation data are shown for 15N TAZ1 (black), 15N TAZ1:HIF-1α (red), and 15N TAZ1:CITED2 (blue). The helical regions of TAZ1 are shown above the graph for reference.
Figure 5.
Changes in 15N TAZ1 backbone amide order parameters upon HIF-1α or CITED2 binding. Differences in S2 values (ΔS2) obtained from Model-Free analysis are shown for 15N TAZ1:HIF-1α compared to free 15N TAZ1 (top), 15N TAZ1:CITED2 compared to free 15N TAZ1 (middle), and 15N TAZ1:CITED2 compared to 15N TAZ1:HIF-1α (bottom). The helical regions of TAZ1 are shown above the graphs for reference.
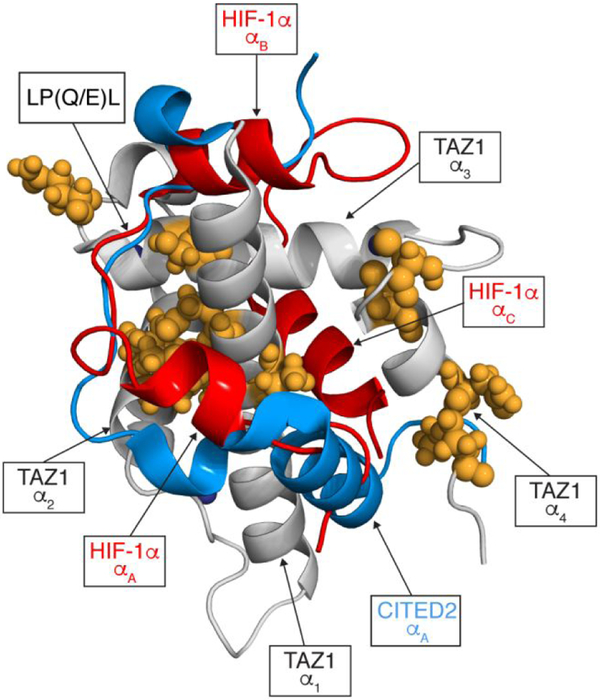
Dynamic differences between the 15N TAZl:HIF-1α and 15N TAZ1:CITED2 complexes provide additional insight into the mechanism of competition between the two disordered ligands for TAZ1 binding. Elevated S2 values are observed within the α1, α2, and α3 helices of TAZ1 in the CITED2 complex relative to the HIF-1α bound state (Figure 5), as well as at the C-terminus in a region where the α4 helix is stabilized and extended in the 15N TAZ1:CITED2 complex. Notably, the residues that exhibit significant differences in S2 between the two complexes are located in a spatially contiguous cluster across the TAZ1 molecule, bridging the main HIF-1α and CITED2 binding sites on the TAZ1 surface (Figure 6). With the exception of residues A399 and G400 in the α2-α3 linker, the TAZ1 order parameters for the CITED2 complex are larger than those of the HIF-1α bound state, suggesting an overall increase in rigidity of TAZ1 when bound to CITED2. In particular, S2 is increased for residues in the α1 and α4 helices that contact the αA helix of CITED2, and in residues in the α2-α3 loop and the α3 helix that contact L246 and W247 at the C-terminal end of the CITED2 LPEL motif. There also appears to be a tightening of the TAZ1 core in the CITED2 complex relative to the HIF-1α bound state, with increased order parameters for residues in the α2-α3 interface and for L360 (in the α1 helix), which contacts both α2 and α3.
Figure 6.
Mapping changes in 15N TAZ1 backbone amide order parameters between the 15N TAZ1:HIF-1α and 15N TAZ1:CITED2 complexes. TAZ1 is shown in grey, HIF-1α is shown in red, and CITED2 is shown in blue. Zinc atoms are shown as dark blue spheres. Residues with ΔS2 greater than 0.1 are shown as orange spheres. The ΔS2 values were calculated as S2CITED2 - S2HIF1α. The secondary structural elements of HIF-1α and CITED2, the conserved LP(Q/E)L motif, and the TAZ1 helices are labeled for reference. The disordered C-terminal tail of CITED2 (residues 260-269) is not shown.
DISCUSSION
A better understanding of the dynamics of IDPs when bound to their biological targets is critical for advancing our understanding of the molecular determinants that mediate binding affinity and for developing tools to effectively modulate IDP interactions in the cellular context. Additionally, many disordered proteins recognize the same molecular targets, but the exact mechanisms by which they compete for occupancy of common binding sites are largely unknown.
Unlike globular proteins, which interact through surfaces comprised of residues that are spatially proximate but located in non-contiguous regions of the amino acid sequence, intrinsically disordered proteins tend to bind their targets through one or more linear motifs localized in discrete regions of the polypeptide chain.41 The interactions between an IDP containing multiple interaction motifs and its target are energetically heterogeneous, with the different interaction motifs contributing differentially to the binding free energy.1,42 The overall binding affinity is determined by the strength of the interactions made by the individual binding motifs of the IDP and the extent to which they are thermodynamically coupled through the intervening linker regions.40,43,44
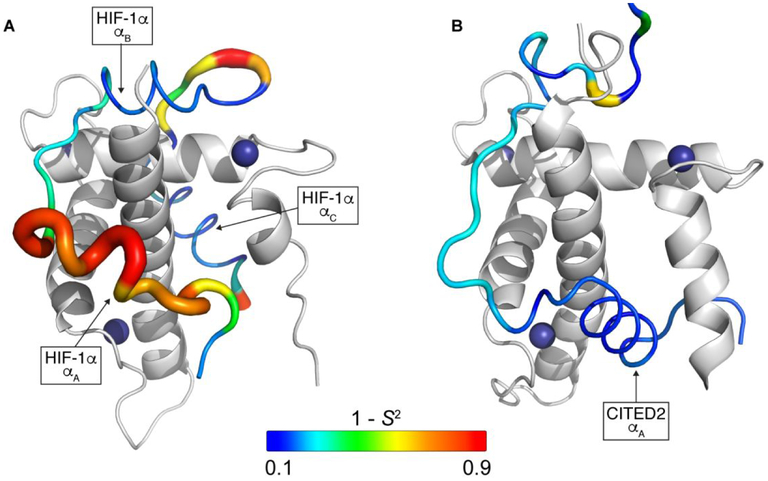
Here, we present a detailed dynamic characterization of two intrinsically disordered peptides, the transactivation domains of HIF-1α17 and CITED2,20 in complex with the TAZ1 domain of CBP. HIF-1α and CITED2 have very different dynamic profiles when bound to TAZ1, with HIF-1α remaining quite flexible in its complex while CITED2 is more rigid overall (Figure 7). The HIF-1α complex with TAZ1 amply demonstrates the complexity of the interactions between IDPs and their biological targets. The 15N relaxation measurements immediately identify two discrete binding motifs, LPQL-αB and the αC helix, which dominate the interactions with TAZ1 (Figure 7). Both regions form critical contacts with TAZ1 such that their picosecond to nanosecond timescale backbone dynamics are restricted and become similar to that of the structured regions of the TAZ1 domain (average S2 = 0.76 ± 0.06 for the LPQL-αB and average S2 =0.81 ± 0.05 for the αC helix). In isolation, each of the HIF-1α binding motifs bind only weakly to TAZ1 (Kd ~ 200 μM and > 1 mM for the αC and LPQL-αB motifs, respectively)45 but when both are present they function synergistically to enhance the binding affinity (Kd = 47 nM for binding of HIF-1α residues 790-826 to the CBP TAZ1 domain).20 In contrast, the linker residues between the LPQL-αB region and the αC helix undergo large amplitude motions (average S2 = 0.41 ± 0.17 for residues G808-L812). This linker region is disordered in the NMR structural ensemble,17 consistent with backbone conformational fluctuations on the picosecond to nanosecond timescale (Figure 7). Despite the synergistic binding effects between the LPQL-αB region and the αC helix, the large amplitude motions in the linker between the binding motifs suggest that these two motifs are weakly coupled; it is easy to envisage a scenario where the αC helix of HIF-1α remains bound to TAZ1 after dissociation of the LPQL-αB motif or vice versa. Notably, coarse grained simulations of HIF-1α and TAZ1 association46 identified transiently populated states with only the αC helix bound and also suggested a high degree of disorder in the linker region between the LPQL-αB motif and the αC helix, in further support of weak thermodynamic coupling between the binding motifs.
Figure 7.
Backbone dynamics for HIF-1α and CITED2 in their binary complexes with TAZ1. The ribbon width of the HIF-1α (A) and CITED2 (B) transactivation domain peptides is scaled by 1-S2; the backbone color gradient ranges from blue (1-S2 = 0.1) to red (1- S2 = 0.9). TAZ1 is shown in the cartoon representation in grey. Zinc atoms are shown as dark blue spheres. The disordered C-terminal tail of CITED2 (residues 260-269) is not shown. The secondary structural elements of HIF-1α and CITED2 are labeled for reference.
The αA region of the bound HIF-1α peptide is highly dynamic and makes only transient, fuzzy47 interactions with TAZ1. Residues in the αA region of HIF-1α exhibit large amplitude motions on the picosecond to nanosecond timescale; the order parameters for residues A779 – G791 range between 0.20 and 0.44, corresponding to ϕ dihedral angle fluctuations of ~40-60° based on the Gaussian axial fluctuation model.36 The observation that residues in the αA region of HIF-1α have low order parameters is surprising, given that this region appears helical in most structures in the NMR ensemble.17 It is likely that the helical structure is formed only transiently, through short-lived interactions between HIF-1α and residues in the groove between helices α1 and α4 of TAZ1. The observed intermolecular NOEs are weak, consistent with transient docking of the HIF-1α αA and N-terminal regions.17 Although the NMR ensemble is rather disordered in these regions (Figure S1A), it is probable that the structures were biased towards the more compact docked state by the r−6 weighting of the intermolecular NOE restraints and the weak, medium range NOEs, characteristic of helical structure, that were observed in the N-terminal region of HIF-1α. Indeed, comparison of the 13Cα chemical shifts of bound HIF-1α to predicted random coil chemical shifts (Figure S6) suggests that the N-terminal region only weakly populates the helical state observed in the NMR structural ensemble. The order parameters of bound HIF-1α increase substantially near the N-terminus (Figures 2 and 7), suggesting that D777 and L778 interact more strongly with TAZ1 than do the residues in the αA helix. These data agree well with the observed ~5-fold reduction in binding affinity for HIF-1α constructs lacking these residues17,20,45,48-50 and suggest that the increased order parameters at the N-terminus of the HIF-1α transactivation domain are due to intermolecular contacts with TAZ1.
In contrast to HIF-1α, the backbone dynamics of the bound CITED2 transactivation domain are relatively uniform. High 15N order parameters are obtained for the αA helix through the LPEL motif (average S2 = 0.84 ± 0.05 for residues 223-246), showing that picosecond to nanosecond timescale backbone conformational fluctuations are greatly restricted in the complex with TAZ1. The restricted motions in the TAZ1:CITED2 complex clearly reflect the extensive contacts between CITED2 and TAZ1, including hydrophobic interactions made by numerous CITED2 side chains (I223, V227, L228, M229, L230, V231, M235, L236, I240, L243, P244, L246, W247, and L248). Additionally, the lack of dynamic variability in the region between the CITED2 αA helix and the LPEL motif suggests that these two binding motifs are tightly coupled40,43,44 and function as a single, unified binding unit, in contrast to the weakly coupled motifs of HIF-1α.
HIF-1α and CITED2 are of interest as model disordered proteins that bind to the same molecular partner, but they also display unexpected behavior when competing for TAZ1 binding. Previously, we showed that although HIF-1α and CITED2 bind to TAZ1 with equal (10 nM) affinity, CITED2 is able to fully displace HIF-1α at equimolar concentrations.22 This surprising behavior arises from apparent unidirectionality of competition between HIF-1α and CITED2: the CITED2 transactivation domain is fully capable of displacing HIF-1α from its complex with TAZ1, but HIF-1α cannot displace bound CITED2.22 We also found that HIF-1α, CITED2, and TAZ1 form a transient ternary complex, and that CITED2 binding triggers an allosteric conformational change in TAZ1 that disfavors binding of HIF-1α.22 The NMR spin relaxation data and analysis presented here sheds additional light on the molecular mechanism of unidirectional competition between HIF-1α and CITED2. Notably, the largest dynamic differences between HIF-1α and CITED2 are in regions that would occupy the same binding site on TAZ1, the hydrophobic cleft between the TAZ1 α1 and α4 helices. Many other disordered ligands also contact this surface of TAZ1: NMR dynamics studies of the p53,51 RelA,12 and STAT252 transactivation domains in complex with TAZ1 illustrate that these disordered ligands, like HIF-1α, participate in fuzzy interactions with the α1/α4 cleft of TAZ1.
Dynamics in the N-terminal region of HIF-1α (and corresponding regions of other disordered ligands that contact the TAZ1 α1/α4 helices) likely plays an important role in allowing CITED2 to access a key molecular surface on TAZ1 through its αA region, in the critical first step for ternary complex formation and subsequent displacement of HIF-1α from TAZ1. After the CITED2 αA region binds to TAZ1 and folds into helical structure, tight coupling between the αA helix and the LPEL motif enables efficient displacement of the HIF-1α LPQL-αB motif from the shared binding site for the conserved LP(Q/E)L motif. Unidirectionality in the HIF-1α displacement reaction can be attributed not only to the tight coupling between the CITED2 αA helix and LPEL motif, but also to the weak coupling between the LPQL-αB motif and the αC helix of HIF-1α. Due to the high degree of flexibility of the linker between the LPQL-αB motif and the αC helix of HIF-1α, these two binding motifs are largely decoupled; even if the αC helix binds to its available TAZ1 binding surface in the TAZ1:CITED2 complex, the LPQL-αB region is unable to compete with the tightly coupled CITED2 αA helix and LPEL motif for TAZ1 occupancy.
The backbone dynamics of HIF-1α and CITED2 illustrate how disordered ligands might use flexibility to modulate the availability of binding surfaces on common molecular target proteins, but we sought to obtain a better understanding of the role of the target protein itself. The differences between the lowest energy solution structures of TAZ1, TAZ1:HIF-1α, and TAZ1:CITED2 are subtle (Figure S4), yet the positions of the structural changes are rather interesting. Both HIF-1α and CITED2 occupy the cleft between the α1 and α4 helices of TAZ1 in their binary complexes with TAZ1, with HIF-1α remaining more flexible in this key binding interface (Figure S1 and Figure 7). The dynamics of the 15N TAZ1:HIF-1α and 15N TAZ1:CITED2 complexes differ in this region, with TAZ1 becoming more rigid in the CITED2-bound state. Notably, nearly all of the dynamic differences between the 15N TAZ1:HIF-1α and 15N TAZ1:CITED2 complexes suggest an overall rigidification of TAZ1 in the CITED2 bound state, as indicated by the predominantly positive changes in order parameters between the 15N TAZ1:CITED2 and 15N TAZ1:HIF-1α complexes (Figure 5).
These results suggest that the backbone dynamics of TAZ1 are finely tuned to accommodate and discriminate between various disordered protein ligands. The TAZ1 domains of CBP and p300 are the binding sites for a number of disordered proteins.53,54 Bound structures are available for many TAZ1-binding IDPs in addition to HIF-1α and CITED2, including STAT2,55 RelA,12 and p53,51 many of which occupy similar and partially overlapping binding sites.56 It is intriguing to speculate that structural plasticity in TAZ1, in addition to the dynamics of the ligands themselves, could play an important role in ligand binding and dictate the stability of bound complexes with various disordered protein partners. A recent NMR dynamics study of the TAZ1:STAT2 complex52 showed that both TAZ1 and STAT2 retain flexibility in regions that would be important for both HIF-1α and CITED2 binding, further supporting the notion that dynamics and structural plasticity of TAZ1 are likely important for its relatively promiscuous binding behavior. Together with our data, it is clear that TAZ1 does not function as a rigid scaffold, but undergoes changes in backbone structure and dynamics upon binding of different ligands. These changes, in concert with the structure and dynamics of the bound ligands, are important for modulating occupancy and facilitating exchange of binding partners.
CONCLUSIONS
We have demonstrated that picosecond to nanosecond backbone fluctuations of both ordered and disordered proteins can play important roles in molecular recognition and competition processes. In the case of HIF-1α and CITED2 competition for TAZ1, both the disordered HIF-1α and CITED2 and the globular TAZ1 undergo dynamic changes that correspond to TAZ1 occupancy, and these different dynamic characteristics give rise to the apparent unidirectionality of competition between HIF-1α and CITED2. The results presented here demonstrate that globular protein binding partners of disordered proteins should not be assumed to be simply scaffolds for binding, but that dynamics in the folded protein partners can also modulate the affinity or lifetime of the interaction. Our study highlights the importance of characterizing both binding partners in a protein-protein interaction to obtain a more accurate description of binding and molecular recognition processes.
Supplementary Material
Figure S1. Ensemble of solution structures for HIF-1α:TAZ1 and CITED2:TAZ1
Figure S2. τe values for 15N HIF-1α:TAZ1 and 15N CITED2:TAZ1
Figure S3. Reduced spectral density mapping for 15N HIF-1α:TAZ1 and 15N CITED2:TAZ1
Figure S4. Comparison of TAZ1 structure in free and HIF-1α/CITED2 bound states
Figure S5. Spin relaxation data for 15N TAZ1, 15N TAZ1:HIF-1α, and 15N TAZ1:CITED2
Figure S6. Differences between measured 13Cα chemical shift values and predicted random coil chemical shifts for HIF-1α and CITED2.
Table S1-S10: Tabulated relaxation rates and Model-Free parameters for 15N HIF-1α:TAZ1, 15N CITED2:TAZ1, 15N TAZ1, 15N TAZ1:HIF-1α, and 15N TAZ1:CITED2. This supplementary material is available free of charge via the Internet at http://pubs.acs.org.
ACKNOWLEDGEMENTS
We thank Gerard Kroon for assistance with NMR experiments, and Euvel Manlapaz for technical support. This work was supported by grants CA096865 and CA229652 from the National Institutes of Health (P.E.W.) and the Skaggs Institute for Chemical Biology. R.B.B. was supported by a postdoctoral fellowship from the American Cancer Society (125343-PF-13-202-01-DMC).
Footnotes
REFERENCES
- (1).Wright PE, and Dyson HJ (2015) Intrinsically disordered proteins in cellular signalling and regulation, Nat Rev Mol Cell Biol 16, 18–29. [DOI] [PMC free article] [PubMed] [Google Scholar]
- (2).van der Lee R, Buljan M, Lang B, Weatheritt RJ, Daughdrill GW, Dunker AK, Fuxreiter M, Gough J, Gsponer J, Jones DT, Kim PM, Kriwacki RW, Oldfield CJ, Pappu RV, Tompa P, Uversky VN, Wright PE, and Babu MM (2014) Classification of intrinsically disordered regions and proteins, Chemical reviews 114, 6589–6631. [DOI] [PMC free article] [PubMed] [Google Scholar]
- (3).Modell AE, Blosser SL, and Arora PS (2016) Systematic Targeting of Protein-Protein Interactions, Trends Pharmacol Sci 37, 702–713. [DOI] [PMC free article] [PubMed] [Google Scholar]
- (4).Sammak S, and Zinzalla G. (2015) Targeting protein-protein interactions (PPIs) of transcription factors: Challenges of intrinsically disordered proteins (IDPs) and regions (IDRs), Progress in biophysics and molecular biology 119, 41–46. [DOI] [PubMed] [Google Scholar]
- (5).Tsafou K, Tiwari PB, Forman-Kay JD, Metallo SJ, and Toretsky JA (2018) Targeting Intrinsically Disordered Transcription Factors: Changing the Paradigm, J Mol Biol 430, 2321–2341. [DOI] [PubMed] [Google Scholar]
- (6).Abyzov A, Salvi N, Schneider R, Maurin D, Ruigrok RW, Jensen MR, and Blackledge M. (2016) Identification of Dynamic Modes in an Intrinsically Disordered Protein Using Temperature-Dependent NMR Relaxation, J Am Chem Soc 138, 6240–6251. [DOI] [PubMed] [Google Scholar]
- (7).Parigi G, Rezaei-Ghaleh N, Giachetti A, Becker S, Fernandez C, Blackledge M, Griesinger C, Zweckstetter M, and Luchinat C. (2014) Long-range correlated dynamics in intrinsically disordered proteins, J Am Chem Soc 136, 16201–16209. [DOI] [PubMed] [Google Scholar]
- (8).Gill ML, Byrd RA, and Palmer AG III. (2016) Dynamics of GCN4 facilitate DNA interaction: a model-free analysis of an intrinsically disordered region, Physical chemistry chemical physics : PCCP 18, 5839–5849. [DOI] [PMC free article] [PubMed] [Google Scholar]
- (9).Delaforge E, Kragelj J, Tengo L, Palencia A, Milles S, Bouvignies G, Salvi N, Blackledge M, and Jensen MR (2018) Deciphering the Dynamic Interaction Profile of an Intrinsically Disordered Protein by NMR Exchange Spectroscopy, J Am Chem Soc 140, 1148–1158. [DOI] [PubMed] [Google Scholar]
- (10).Bah A, Vernon RM, Siddiqui Z, Krzeminski M, Muhandiram R, Zhao C, Sonenberg N, Kay LE, and Forman-Kay JD (2015) Folding of an intrinsically disordered protein by phosphorylation as a regulatory switch, Nature 519, 106–109. [DOI] [PubMed] [Google Scholar]
- (11).Schneider R, Blackledge M, and Jensen MR (2019) Elucidating binding mechanisms and dynamics of intrinsically disordered protein complexes using NMR spectroscopy, Current opinion in structural biology 54, 10–18. [DOI] [PubMed] [Google Scholar]
- (12).Mukherjee SP, Behar M, Birnbaum HA, Hoffmann A, Wright PE, and Ghosh G. (2013) Analysis of the RelA:CBP/p300 interaction reveals its involvement in NF-kappaB-driven transcription, PLoS biology 11, e1001647. [DOI] [PMC free article] [PubMed] [Google Scholar]
- (13).Xue Y, Yuwen T, Zhu F, and Skrynnikov NR (2014) Role of electrostatic interactions in binding of peptides and intrinsically disordered proteins to their folded targets. 1. NMR and MD characterization of the complex between the c-Crk N-SH3 domain and the peptide Sos, Biochemistry 53, 6473–6495. [DOI] [PubMed] [Google Scholar]
- (14).Arai M, Sugase K, Dyson HJ, and Wright PE (2015) Conformational propensities of intrinsically disordered proteins influence the mechanism of binding and folding, Proc Natl Acad Sci U S A 112, 9614–9619. [DOI] [PMC free article] [PubMed] [Google Scholar]
- (15).Gely S, Lowry DF, Bernard C, Jensen MR, Blackledge M, Costanzo S, Bourhis JM, Darbon H, Daughdrill G, and Longhi S. (2010) Solution structure of the C-terminal X domain of the measles virus phosphoprotein and interaction with the intrinsically disordered C-terminal domain of the nucleoprotein, J Mol Recognit 23, 435–447. [DOI] [PubMed] [Google Scholar]
- (16).Sugase K, Dyson HJ, and Wright PE (2007) Mechanism of coupled folding and binding of an intrinsically disordered protein, Nature 447, 1021–1025. [DOI] [PubMed] [Google Scholar]
- (17).Dames SA, Martinez-Yamout M, De Guzman RN, Dyson HJ, and Wright PE (2002) Structural basis for Hif-1 alpha /CBP recognition in the cellular hypoxic response, Proc Natl Acad Sci U S A 99, 5271–5276. [DOI] [PMC free article] [PubMed] [Google Scholar]
- (18).Freedman SJ, Sun ZY, Poy F, Kung AL, Livingston DM, Wagner G, and Eck MJ (2002) Structural basis for recruitment of CBP/p300 by hypoxia-inducible factor-1 alpha, Proc Natl Acad Sci U S A 99, 5367–5372. [DOI] [PMC free article] [PubMed] [Google Scholar]
- (19).Bhattacharya S, Michels CL, Leung MK, Arany ZP, Kung AL, and Livingston DM (1999) Functional role of p35srj, a novel p300/CBP binding protein, during transactivation by HIF-1, Genes Dev 13, 64–75. [DOI] [PMC free article] [PubMed] [Google Scholar]
- (20).De Guzman RN, Martinez-Yamout MA, Dyson HJ, and Wright PE (2004) Interaction of the TAZ1 domain of the CREB-binding protein with the activation domain of CITED2: regulation by competition between intrinsically unstructured ligands for non-identical binding sites, J Biol Chem 279, 3042–3049. [DOI] [PubMed] [Google Scholar]
- (21).Freedman SJ, Sun ZY, Kung AL, France DS, Wagner G, and Eck MJ (2003) Structural basis for negative regulation of hypoxia-inducible factor-1alpha by CITED2, Nat Struct Biol 10, 504–512. [DOI] [PubMed] [Google Scholar]
- (22).Berlow RB, Dyson HJ, and Wright PE (2017) Hypersensitive termination of the hypoxic response by a disordered protein switch, Nature 543, 447–451. [DOI] [PMC free article] [PubMed] [Google Scholar]
- (23).De Guzman RN, Wojciak JM, Martinez-Yamout MA, Dyson HJ, and Wright PE (2005) CBP/p300 TAZ1 domain forms a structured scaffold for ligand binding, Biochemistry 44, 490–497. [DOI] [PubMed] [Google Scholar]
- (24).Farrow NA, Muhandiram R, Singer AU, Pascal SM, Kay CM, Gish G, Shoelson SE, Pawson T, Forman-Kay JD, and Kay LE (1994) Backbone dynamics of a free and phosphopeptide-complexed Src homology 2 domain studied by 15N NMR relaxation, Biochemistry 33, 5984–6003. [DOI] [PubMed] [Google Scholar]
- (25).Ferrage F, Cowburn D, and Ghose R. (2009) Accurate sampling of high-frequency motions in proteins by steady-state (15)N-{(1)H} nuclear Overhauser effect measurements in the presence of cross-correlated relaxation, J Am Chem Soc 131, 6048–6049. [DOI] [PMC free article] [PubMed] [Google Scholar]
- (26).Delaglio F, Grzesiek S, Vuister GW, Zhu G, Pfeifer J, and Bax A. (1995) NMRPipe: a multidimensional spectral processing system based on UNIX pipes, J Biomol NMR 6, 277–293. [DOI] [PubMed] [Google Scholar]
- (27).Lee W, Tonelli M, and Markley JL (2015) NMRFAM-SPARKY: enhanced software for biomolecular NMR spectroscopy, Bioinformatics 31, 1325–1327. [DOI] [PMC free article] [PubMed] [Google Scholar]
- (28).Goddard T, and Kneller DG (2005) SPARKY 3, University of California, San Francisco. [Google Scholar]
- (29).Bae SH, Legname G, Serban A, Prusiner SB, Wright PE, and Dyson HJ (2009) Prion proteins with pathogenic and protective mutations show similar structure and dynamics, Biochemistry 48, 8120–8128. [DOI] [PMC free article] [PubMed] [Google Scholar]
- (30).Clore GM, Szabo A, Bax A, Kay LE, Driscoll PC, and Gronenborn AM (1990) Deviations from the Simple 2-Parameter Model-Free Approach to the Interpretation of N-15 Nuclear Magnetic-Relaxation of Proteins, Journal of the American Chemical Society 112, 4989–4991. [Google Scholar]
- (31).Lipari G, and Szabo A. (1982) Model-Free Approach to the Interpretation of Nuclear Magnetic-Resonance Relaxation in Macromolecules .2. Analysis of Experimental Results, Journal of the American Chemical Society 104, 4559–4570. [Google Scholar]
- (32).Lipari G, and Szabo A. (1982) Model-Free Approach to the Interpretation of Nuclear Magnetic-Resonance Relaxation in Macromolecules .1. Theory and Range of Validity, Journal of the American Chemical Society 104, 4546–4559. [Google Scholar]
- (33).d'Auvergne EJ, and Gooley PR (2003) The use of model selection in the model-free analysis of protein dynamics, J Biomol NMR 25, 25–39. [DOI] [PubMed] [Google Scholar]
- (34).d'Auvergne EJ, and Gooley PR (2006) Model-free model elimination: a new step in the model-free dynamic analysis of NMR relaxation data, J Biomol NMR 35, 117–135. [DOI] [PubMed] [Google Scholar]
- (35).Farrow NA, Zhang O, Szabo A, Torchia DA, and Kay LE (1995) Spectral density function mapping using 15N relaxation data exclusively, J Biomol NMR 6, 153–162. [DOI] [PubMed] [Google Scholar]
- (36).Bruschweiler R, and Wright PE (1994) Nmr Order Parameters of Biomolecules - a New Analytical Representation and Application to the Gaussian Axial Fluctuation Model, Journal of the American Chemical Society 116, 8426–8427. [Google Scholar]
- (37).Bracken C, Carr PA, Cavanagh J, and Palmer AG 3rd. (1999) Temperature dependence of intramolecular dynamics of the basic leucine zipper of GCN4: implications for the entropy of association with DNA, J Mol Biol 285, 2133–2146. [DOI] [PubMed] [Google Scholar]
- (38).Ishima R, and Nagayama K. (1995) Quasi-Spectral-Density Function-Analysis for N-15 Nuclei in Proteins, J Magn Reson Ser B 108, 73–76. [Google Scholar]
- (39).Peng JW, and Wagner G. (1992) Mapping of the spectral densities of N-H bond motions in eglin c using heteronuclear relaxation experiments, Biochemistry 31, 8571–8586. [DOI] [PubMed] [Google Scholar]
- (40).Motlagh HN, Li J, Thompson EB, and Hilser VJ (2012) Interplay between allostery and intrinsic disorder in an ensemble, Biochemical Society transactions 40, 975–980. [DOI] [PMC free article] [PubMed] [Google Scholar]
- (41).Tompa P, Davey NE, Gibson TJ, and Babu MM (2014) A million peptide motifs for the molecular biologist, Molecular cell 55, 161–169. [DOI] [PubMed] [Google Scholar]
- (42).Berlow RB, Dyson HJ, and Wright PE (2015) Functional advantages of dynamic protein disorder, FEBS letters 589, 2433–2440. [DOI] [PMC free article] [PubMed] [Google Scholar]
- (43).Hilser VJ, and Thompson EB (2007) Intrinsic disorder as a mechanism to optimize allosteric coupling in proteins, Proc Natl Acad Sci U S A 104, 8311–8315. [DOI] [PMC free article] [PubMed] [Google Scholar]
- (44).Wrabl JO, Gu J, Liu T, Schrank TP, Whitten ST, and Hilser VJ (2011) The role of protein conformational fluctuations in allostery, function, and evolution, Biophysical chemistry 159, 129–141. [DOI] [PMC free article] [PubMed] [Google Scholar]
- (45).Kyle HF, Wickson KF, Stott J, Burslem GM, Breeze AL, Tiede C, Tomlinson DC, Warriner SL, Nelson A, Wilson AJ, and Edwards TA (2015) Exploration of the HIF-1alpha/p300 interface using peptide and Adhiron phage display technologies, Mol Biosyst 11, 2738–2749. [DOI] [PubMed] [Google Scholar]
- (46).De Sancho D, and Best RB (2012) Modulation of an IDP binding mechanism and rates by helix propensity and non-native interactions: association of HIF1alpha with CBP, Mol Biosyst 8, 256–267. [DOI] [PubMed] [Google Scholar]
- (47).Tompa P, and Fuxreiter M. (2008) Fuzzy complexes: polymorphism and structural disorder in protein-protein interactions, Trends in biochemical sciences 33, 2–8. [DOI] [PubMed] [Google Scholar]
- (48).Dubey R, Levin MD, Szabo LZ, Laszlo CF, Kushal S, Singh JB, Oh P, Schnitzer JE, and Olenyuk BZ (2013) Suppression of tumor growth by designed dimeric epidithiodiketopiperazine targeting hypoxia-inducible transcription factor complex, J Am Chem Soc 135, 4537–4549. [DOI] [PubMed] [Google Scholar]
- (49).Kushal S, Lao BB, Henchey LK, Dubey R, Mesallati H, Traaseth NJ, Olenyuk BZ, and Arora PS (2013) Protein domain mimetics as in vivo modulators of hypoxia-inducible factor signaling, Proc Natl Acad Sci U S A 110, 15602–15607. [DOI] [PMC free article] [PubMed] [Google Scholar]
- (50).Lao BB, Grishagin I, Mesallati H, Brewer TF, Olenyuk BZ, and Arora PS (2014) In vivo modulation of hypoxia-inducible signaling by topographical helix mimetics, Proc Natl Acad Sci U S A 111, 7531–7536. [DOI] [PMC free article] [PubMed] [Google Scholar]
- (51).Krois AS, Ferreon JC, Martinez-Yamout MA, Dyson HJ, and Wright PE (2016) Recognition of the disordered p53 transactivation domain by the transcriptional adapter zinc finger domains of CREB-binding protein, Proc Natl Acad Sci U S A 113, E1853–1862. [DOI] [PMC free article] [PubMed] [Google Scholar]
- (52).Lindstrom I, and Dogan J. (2018) Dynamics, Conformational Entropy, and Frustration in Protein-Protein Interactions Involving an Intrinsically Disordered Protein Domain, ACS chemical biology 13, 1218–1227. [DOI] [PubMed] [Google Scholar]
- (53).Goodman RH, and Smolik S (2000) CBP/p300 in cell growth, transformation, and development, Genes Dev 14, 1553–1577. [PubMed] [Google Scholar]
- (54).Kasper LH, Boussouar F, Boyd K, Xu W, Biesen M, Rehg J, Baudino TA, Cleveland JL, and Brindle PK (2005) Two transactivation mechanisms cooperate for the bulk of HIF-1-responsive gene expression, EMBO J 24, 3846–3858. [DOI] [PMC free article] [PubMed] [Google Scholar]
- (55).Wojciak JM, Martinez-Yamout MA, Dyson HJ, and Wright PE (2009) Structural basis for recruitment of CBP/p300 coactivators by STAT1 and STAT2 transactivation domains, EMBO J 28, 948–958. [DOI] [PMC free article] [PubMed] [Google Scholar]
- (56).Dyson HJ, and Wright PE (2016) Role of Intrinsic Protein Disorder in the Function and Interactions of the Transcriptional Coactivators CREB-binding Protein (CBP) and p300, J Biol Chem 291, 6714–6722. [DOI] [PMC free article] [PubMed] [Google Scholar]
Associated Data
This section collects any data citations, data availability statements, or supplementary materials included in this article.
Supplementary Materials
Figure S1. Ensemble of solution structures for HIF-1α:TAZ1 and CITED2:TAZ1
Figure S2. τe values for 15N HIF-1α:TAZ1 and 15N CITED2:TAZ1
Figure S3. Reduced spectral density mapping for 15N HIF-1α:TAZ1 and 15N CITED2:TAZ1
Figure S4. Comparison of TAZ1 structure in free and HIF-1α/CITED2 bound states
Figure S5. Spin relaxation data for 15N TAZ1, 15N TAZ1:HIF-1α, and 15N TAZ1:CITED2
Figure S6. Differences between measured 13Cα chemical shift values and predicted random coil chemical shifts for HIF-1α and CITED2.
Table S1-S10: Tabulated relaxation rates and Model-Free parameters for 15N HIF-1α:TAZ1, 15N CITED2:TAZ1, 15N TAZ1, 15N TAZ1:HIF-1α, and 15N TAZ1:CITED2. This supplementary material is available free of charge via the Internet at http://pubs.acs.org.


