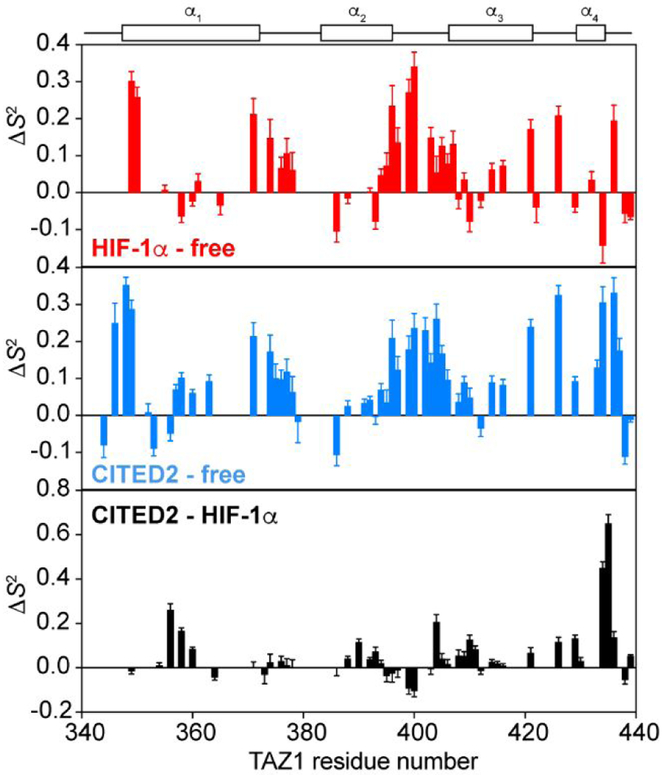
Figure 5.
Changes in 15N TAZ1 backbone amide order parameters upon HIF-1α or CITED2 binding. Differences in S2 values (ΔS2) obtained from Model-Free analysis are shown for 15N TAZ1:HIF-1α compared to free 15N TAZ1 (top), 15N TAZ1:CITED2 compared to free 15N TAZ1 (middle), and 15N TAZ1:CITED2 compared to 15N TAZ1:HIF-1α (bottom). The helical regions of TAZ1 are shown above the graphs for reference.

