

Abstract
Rationale and objectives:
To evaluate a new approach to establish compliance of segmentation tools with the Computed Tomography (CT) Volumetry Profile of the Quantitative Imaging Biomarkers Alliance (QIBA); and determine the statistical exchangeability between real and simulated lesions through an international challenge.
Materials and Methods:
The study used an anthropomorphic phantom with 16 embedded physical lesions and 30 patient cases from the RIDER with pathologically-confirmed malignancies. Hybrid-datasets were generated by virtually inserting simulated lesions corresponding to physical lesions into the phantom datasets using one projection-domain-based (Method 1), two image-domain (Methods 2 and 3) insertion methods, and simulated lesions corresponding to real lesions into the RIDER dataset (using Method 2). The volumes of the real and simulated lesions were compared based on bias (measured mean volume differences between physical and virtually-inserted lesions in phantoms as quantified by segmentation algorithms), repeatability, reproducibility, equivalence (phantom-phase), and overall QIBA compliance (phantom and clinical-phase).
Results:
For phantom-phase, three of eight groups were fully QIBA compliant, and one was marginally compliant. For compliant groups, the estimated biases were −1.8±1.4%, −2.5±1.1%, −3±1%, −1.8±1.5% (± 95% CI). No virtual insertion method showed statistical equivalence to physical insertion in bias equivalence testing using Schuirmann‟s two one-sided test (±5% equivalence margin). Differences in repeatability and reproducibility across physical and simulated lesions were largely comparable (0.1–16% and 7–18% differences, respectively). For clinical-phase, seven of sixteen groups were QIBA compliant.
Conclusions:
Hybrid-datasets yielded conclusions similar to real CT datasets where phantom QIBA compliant were also compliant for hybrid-datasets. Some groups deemed compliant for simulated methods, were not for physical lesion measurements. The magnitude of this difference was small (<5.4%). While technical performance is not equivalent, they correlate, such that, volumetrically simulated lesions could potentially serve as practical proxies.
Keywords: CT, volumetry, quantitative imaging, hybrid-dataset, segmentation, lung cancer
INTRODUCTION
Lung cancer is a leading cause of cancer-related mortality worldwide (1, 2), and the lung is a prominent site for cancer metastasis (3, 4). The Lung Screening Study (LSS) and National Lung Screening Trial (NLST) have shown that computed tomography (CT) is an effective method for early-stage lung cancer detection, which is correlated with improved patient survival (5). If a suspicious lesion is identified, its diagnosis, staging, treatment, and prognosis can be significantly aided by its segmentation and characterization in terms of shape and size (6) as prescribed by various guidelines, RECIST, Fleischner, LungRads™, and TNM Classification of Malignant Tumors, naming just a few (7–11). Indeed, accurate and precise evaluation of lesion size, best captured in terms of volume, can facilitate effective treatment in early stages (12, 13), assessment of the effectiveness of therapy over time using lesion growth as a proven biomarker for response versus progression (14–16), and clinical research and trials for new treatments. Therefore, accurate assessment of a tumor volume is vital to the assessment, application, and development of effective cancer therapeutics.
The Quantitative Imaging Biomarker Alliance (QIBA) has defined conformance procedures and standards, embodied in a QIBA Profile for CT Tumor Volumetry for Advanced Disease 2016–11-21b (link), to achieve traceable accuracy in the estimation of tumor volumes via targeted performance for associated segmentation algorithms. The current QIBA standards are based on volume assessment studies using phantom and clinical test-retest datasets (17–21). Phantoms, while providing ground truth, are over-simplified and lack biological variability. Clinical datasets are much more realistic but do not offer the ground truth volume of the tumors. For the task of assessing segmentation algorithm performance, meeting the dual goals of known ground truth and biological variability is essential. Hybrid datasets, created by virtually inserting simulated lesions into real patient CT datasets, can potentially meet these goals. They can provide study design flexibility at low cost with proven utility demonstrated in multiple prior studies (22, 23). However, claiming equivalency of hybrid datasets to real clinical data, especially as a basis for a broad compliance standard, cannot be made if they are not compared across a wide range of segmentation algorithms. No prior study has tested hybrid dataset across a broad cohort of such algorithms.
The objective of this study was to assess the equivalence of hybrid datasets to datasets with native lesions across a large cohort of segmentations provided through an international challenge. Consistent with previous scholarship by QIBA, our study was designed to build on prior work concerning lesion size characterization and segmentation tool performance evaluation. Subset analysis across the algorithms is based on what we term “QIBA compliance”, which refers to establishing that the bias and precision estimates of the participants‟ volume measurements fall within the QIBA CT Profile limits. The main goals of this study were 1) to assess bias and precision of volume estimation of different segmentation algorithms on physical and virtually-inserted lesions in phantoms, and 2) to assess equivalency of the simulated lesions for QIBA compliance purposes across phantom and clinical cases.
MATERIALS AND METHODS
The institutional review board was not necessary for this research since it was limited to (a) the collection and analysis of anthropomorphic phantom image sets and (b) publicly available, fully anonymized patient image sets. No human subjects were required or at risk. In this section, we describe the data development methods and statistical analyses used to conduct the study. Segmentation algorithm bias and precision were assessed, and equivalence between real and simulated lesions was ascertained based on participant submissions. To facilitate the comparisons of real and simulated lesions, a two-pronged study design involving phantom and patient datasets was developed.
Phantom Phase
Phantom datasets consisted of CT image data of an anthropomorphic thorax phantom with a vascular lung insert (Lungman, Kyoto Kagaku, Kyoto, Japan), as shown in Figure 1 (a). Sixteen “physical” lesions were physically embedded in the vascular insert in a randomized manner. The lesions were independently manufactured by Computerized Imaging Reference Systems (CIRS, Norfolk, VA.) and supplied via the U.S. Food and Drug Administration. All lesions were solid, and their characteristic features were known Figure 1 (b). These lesions were of two sizes (8 mm and 10 mm), four shapes (spherical, elliptical, lobular and spiculated), and a single radio-density of 100 HU (24). Table 1 gives a summary of 8 unique lesions, where each lesion also had an identical copy. Both copies were physically placed in the phantom. They were individually wrapped in low-density polystyrene foam to reduce the potential for vasculature or pleura attachment in the phantom. This was done to prevent any ambiguity in lesion edges during segmentation and volume estimation. Each physical lesion was accompanied by a corresponding 3D computer-aided design (CAD) definition, as shown in Figure 1 (c), that was instrumental in simulating imaging system rendering of physical lesions.
Figure 1.
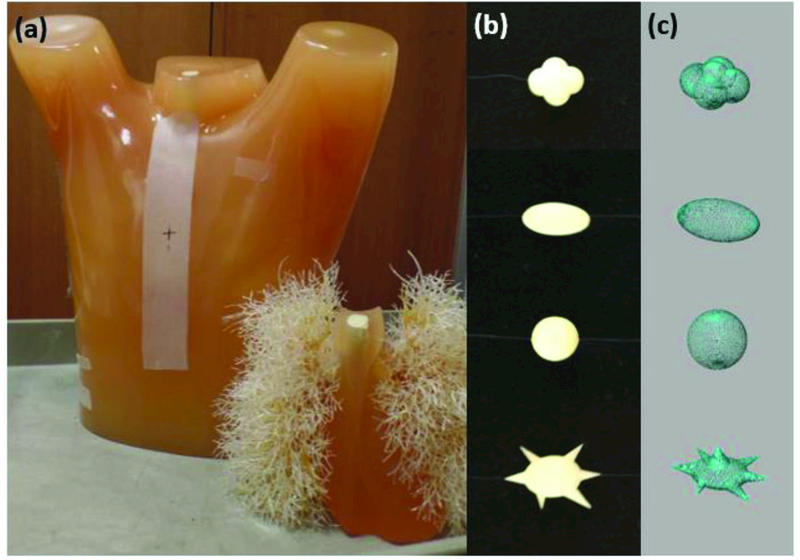
(a) An anthropomorphic thoracic phantom with lung insert containing realistic pulmonary vessels. (b) Sample physical lesions attached to the lung insert via a polystyrene buffer. (c) 3D CAD lesions used to model the physical lesions.
Table 1.
List of lesion characteristics
| Nominal | CIRS | |
|---|---|---|
| Diameter | Shape | Volume |
| (mm) | (mm3) | |
| 8, 10 | spherical | 280, 520 |
| 8, 10 | elliptical | 280, 530 |
| 8, 10 | lobular | 270, 530 |
| 8, 10 | spiculated | 270, 530 |
Phantom data acquisition involved two scans, once with and once without lesions at a single dose setting. Scans were performed using a standard thoracic CT protocol with a commercial CT scanner (SOMATOM Definition Flash; Siemens, Healthcare GmbH, Forchheim, Germany). Images were acquired with a flying focal spot at 120 kV, 1.0 pitch, 0.6 slice thickness, and 22 mGy CTDIvol. Phantom images were reconstructed at 0.6-mm slice thickness with 0.6-mm increments and 400-mm reconstructed field of view using the vendor-provided weighted filtered back-projection (FBP). A summary of the scan and reconstruction protocols is shown in Table 2. Raw image data were saved to enable projection-domain insertion of virtual lesions.
Table 2.
Scan and reconstruction parameters
| CTDIvol (mGy) | 22 |
| kVp | 120 |
| Pitch | 1 |
| Collimation (mm) | 128 × 0.6 |
| Rotation time (sec) | 0.5 |
| Reconstruction thickness (mm) | 0.6 |
| Reconstruction kernel | B31f |
Lesion Insertion
All virtual insertions used lesion-free phantom images with pre-defined locations for lesion insertion. Three virtual insertion methods were used: one projection-domain method (Method 1), and two image-domain methods (Methods 2 and 3).
Insertion Methods 1 and 2 are detailed in an earlier publication (22). Using those methods, 3D CAD lesions were registered with their corresponding physical lesions using a custom-built registration program (developed in Matlab R2016a, The MathWorks Inc., Natick, Massachusetts). An automatic intensity-based optimizer iteratively adjusted the position and orientation of each CAD lesion for error minimization with respect to the physical lesion (Figure 2). Registered lesions were voxelized to match the voxel size of the native CT data (x: 0.78 mm, 0.78 mm, z: 0.6 mm). Partial volume effects were minimized by super-sampling the registered CAD lesions at 10x the native CT voxel size, filtering them with an averaging kernel, and then down-sampling to the native CT voxel size. These partial-volume corrected lesions were then used as input to the blurring process of Methods 1 and 2 to accommodate the imaging rendition process (see Figure 3).
Figure 2.

Comparison of (a) registered and voxelized CAD lesions (b) CT images of physical lesions.
Figure 3.
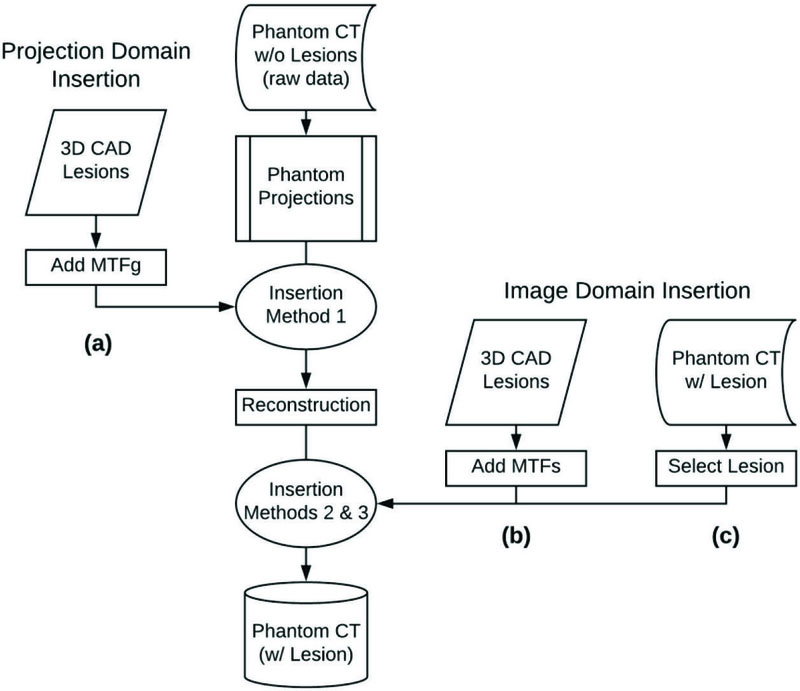
Summary of lesion insertion methods: (a) Method 1: projection-domain lesion insertion workflow, (b) Method 2: image-domain lesion insertion workflow using CAD lesions, (c) Method 3: image-domain lesion insertion workflow using a lesion blending method. The reader is referred to refs.(22, 25) for a full description of all lesion insertion methods.
For Methods 1 and 2, CT image blur was modeled in the frequency domain as the multiplication of the input object by the modulation transfer function (MTF) of the interacting subsystem(s). Applying this framework, the total system MTF (MTFs) was calculated using MTFs = MTFg × MTFr, where MTFg was a geometrical or pre-reconstruction MTF and MTFr was a reconstruction MTF. MTFg and MTFr represented the CT system blur imposed on the image of an object at different phases of the image development process. Since Method 1 modeled the pre-reconstruction blur imposed on the input object, MTFg was the only resolution subsystem used to model lesions inserted via the projection-based technique. Method 2 required MTFs that modeled the blur associated with the post-reconstructed image of the input object.
The process for inserting a lesion from a source image to a location in a target image using Method 3 is detailed in an earlier publication (25). Using this method, the lesions were “blended” into the target volume on a slice-by-slice basis. Using this process, the user drew an approximate bounding region of interest (ROI) containing the physical lesion in the source image. The user then selected a location for insertion in the target image. Using an expectation maximization approach, the method first automatically obtained an optimal boundary ∂Ω0 such that the difference in pixel values between the source and target images along the optimal boundary is close to a constant. The blended image I was then obtained by solving
| (1) |
where Is and It denote the source and target images, respectively. In essence, the blended image was such that the pixel values along the boundary ∂Ω0 were equal to those of the target image, but inside the region Ω0 with the blended image gradient following the gradient of the source image.
Clinical Phase
Patient image data were taken from the Reference Image Database to Evaluate Therapy Response (RIDER) database (Memorial Sloan Kettering Cancer Center). Although initially acquired in a test-retest format, only data from the initial “test” acquisition were used in this study. Subject images were obtained during a single breath hold with modern CT scanners using standard chest protocols. Scanners used included 16-detector row CT (Light-Speed 16; GE Healthcare, Milwaukee, Wisconsin) or 64-detector row CT (VCT; GE Healthcare). Image data were reconstructed using filtered back-projection with the lung kernel in 1.25 mm thin sections. Data consisted of CT image datasets of 30 subjects with pathologically confirmed malignant tumors (non-small cell lung cancer). Tumors were either isolated, or had various degrees of attachment to the pleura, mediastinum, or vascular structures. Also, some lesions were well-circumscribed while others had complex spiculations.
Lesion Insertion
From this phase of the study, only Method 2 was used for lesion insertion; Method 1 was precluded as the clinical cases did not have associated projection datasets, and Method 3 could not be readily used for insertion into backgrounds with clinical heterogeneity.
With the aid of an experienced radiologist (fellowship trained with over nine years of clinical experience), one tumor per subject was identified and segmented using an open-source segmentation software package (Seg3D, Center for Integrative Biomedical Computing, University of Utah, Salt Lake City, UT). Tumors ranged in size from 8 to 65 mm in average diameter. Binary segmentation masks were then fed into a previously developed and validated tool (Duke Lesion Tool, Duke University) outfitted with an iterative fitting routine (26) to generate computational tumor models corresponding to each real tumor. This process is summarized in Figure 4. Tumor selection was guided by the QIBA Profile tumor measurability criteria of sufficient conspicuity and reasonable geometrical simplicity (17).
Figure 4.
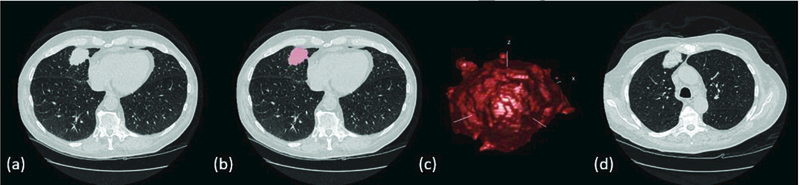
(a) Real tumor in patient CT image, (b) Segmentation mask overlay of patient tumor, 3D tumor model derived from patient CT image, (d) Hybrid CT data containing a real patient image with a virtually-inserted tumor.
Four copies of the simulated tumors were inserted into CT data containing the corresponding real tumors. Of the simulated tumors, two (simulated lesions 1 and 2) were 10 mm in nominal diameter, and two (simulated lesions 3 and 4) were approximately equivalent in volume to the real tumor. Subsequently, each patient image series contained one real and four virtually-inserted tumors. Where possible, simulated tumors were attached to vessel structures, the pleura, or the mediastinum to mimic that of real tumors.
Challenge Process
Eight and sixteen groups from academia and industry participated in the phantom and clinical phases of a public challenge, respectively. Participants downloaded the CT image data and the accompanying lesion location files. The approximate lesion locations were defined. In all, participants were tasked with measuring the volumes of a total of 64 lesions (4 datasets with 16 lesions per dataset) for phantom cases and 150 lesions (30 real + 120 simulated) for clinical cases. Groups were permitted to use their fully- or semi-automated segmentation tool of choice with the lesion identification scheme provided. Some participants reported using convolution neural networks for lesion identification and volume estimation. Some participants submitted results with no post-segmentation modifications, some results requiring only minor modifications, and others reported making major post-segmentation adjustments. One group (Group F) provided results from two separate algorithms. Each group uploaded their results using an instance of the open source MedICI platform designed for this challenge. All communications were handled through the QIBA staff at the Radiological Society of North America (RSNA) to maintain the anonymity of participants. See the Appendix for a synopsis of participant algorithm descriptions.
Statistical Methods
Statistical analysis was performed to compare the bias, precision, and equivalence of volume estimation between virtually-inserted and real lesions. For the phantom dataset, the two co-primary objectives of the study were to test the null hypotheses that both bias and precision of virtually-inserted lesions are not equivalent to physically inserted lesions; the alternative hypothesis was that the bias and precision of virtually-inserted lesions are equivalent. For phantom datasets (Methods 1, 2, and 3 vs physical), bias equivalence was tested using Schuirmann‟s two one-sided test (TOST) with an equivalence margin set at 5% (27). We reasoned that 16 lesions (2 sizes and 4 shapes) in the phantom phase, and 30 real/120 simulated lesions in the clinical phase with 10 different algorithms would provide 80% power (5% type-I error rate) assuming a high inter-method correlation of 0.9 and between-case CV <50%.
Bias was defined by the mean difference between the simulated lesion volume and the reference lesion volume (defined as the true physical volume in phantom data or average volume for real lesion across all participants in the clinical data) as
| (2) |
| (3) |
| (4) |
Where is the reference lesion volume and is the simulated lesion volume measured by the i-th group (i = 1,..., I) for the j-th case (j = 1,…, J) with the lesion inserted by the k-th insertion method (k = 1,…, K). In all bias calculations, a small percent bias indicates a more accurate measurement.
For secondary assessment of bias, a generalized linear model (GLM) was fit to the data, where the dependent variable was the individual (lesion-level) bias, and the independent variables were lesion shape, size, location, and virtual insertion method. GLM also accounted for the clustered nature of the data (i.e., multiple observations on the same lesion) at the 95% confidence intervals (CIs). Similar methods were used to assess the reproducibility (RDC), i.e. the variability among measurements from multiple segmentation tools applied to the same lesion.
Precision was characterized by the intra-lesion percent repeatability coefficient (%RC), estimated from measurements of the same lesion positioned at different locations. For repetitions of the jth case, the %RC was defined as
| (5) |
| (6) |
| (7) |
| (8) |
Where Vijkl is the volume measured by the i-th group (i = 1,…, I) for the j-th case (j = 1,…, J) that was inserted by the k-th insertion method (k = 1,…, K) at the l-th location (l = 1,…, L). Note there were two different copies of the same lesion, therefore there were 8 and 30 unique location pairs for phantom and clinical phase, respectively. All results were anonymized with respect to the segmentation tool. No IRB was required for this study.
RESULTS
Phantom Phase
Based on the physically inserted lesions, three (Groups B, G, and H) out of eight phantom phase participating groups were fully QIBA compliant, and one (Group F) was marginally compliant. Table 4.a–c summarizes these results. Among these four groups, the estimated bias were −1.8±1.4%, −2.5±1.1%, −3±1%, −1.8±1.5% (± 95% CI). TOST for physical phantom mean bias (±5% margin) yielded −1.83±0.1% and 7.67±0.4%, for compliant algorithms and all algorithms, respectively. When compared with the TOST mean bias (±5% margin) for the simulated lesions, Method 3 showed statistical equivalence, but only for compliant algorithms. Across all algorithms, the null hypothesis for Methods 1, 2, and 3 could not be rejected. Table 4.b shows the %RC with their associated 95% confidence interval for all phantom phase participants. For all algorithms, GLM indicated that only Method 2 had a statistically significant difference (p<0.05). Table 4.c provides a direct comparison between the performance of all virtual insertion methods compared to the physical insertion method across all participating phantom phase segmentation algorithms.
Table 4.a.
Phantom phase: mean Percent Bias with 95% confidence intervals for each of 8 participating groups.
| Group | Physical | Method 1 | Method 2 | Method 3 | ||||
|---|---|---|---|---|---|---|---|---|
| %Bias | CI | %Bias | CI | %Bias | CI | %Bias | CI | |
| Group A | 23.17 | [17.38,28.96] | 7.11 | [3.7,10.53] | 6.35 | [4.6,8.1] | 19.59 | [8.03,31.15] |
| Group B | −0.82 | [−3.29,1.66] | −1.74 | [−3.08,−0.4] | −2.38 | [−3.63,−1.13] | −0.89 | [−3.41,1.64] |
| Group C | 20.16 | [13.02,27.3] | 25.91 | [19.7,32.11] | 9.83 | [5.03,14.63] | 28.74 | [20.7,36.79] |
| Group D | 20.91 | [13.44,28.38] | 21.13 | [10.4,31.87] | 10.33 | [8.41,12.25] | 32.06 | [23.03,41.09] |
| Group E | 4.48 | [−3.69,12.65] | −0.54 | [10.75,9.67] | 3.22 | [−0.7,7.14] | 7.99 | [3.92,12.06] |
| Group F | −6.68 | [−8.96,−4.4] | −6.18 | [−8.95,−3.42] | −6.24 | [−8.84,−3.64] | −6.69 | [−9.08,−4.3] |
| Group G | −0.15 | [.2.61,2.31] | −1.28 | [−2.52,−0.04] | −1.81 | [−3.04,−0.58] | −0.19 | [−2.75,2.37] |
| Group H | 0.32 | [−2.27,2.91] | −0.94 | [−2.16,0.28] | −1.38 | [−2.4,−0.36] | 0.48 | [−2.12,3.08] |
Table 4.c.
Phantom phase: Participant algorithm compliance per physical and virtual lesion insertion method. Compliance with the QIBA Profile was determined based on guidance established in Table 3 in the context of the physical phantom only.
| Group | Physical | Method 1 |
Method 2 |
Method 3 |
|---|---|---|---|---|
| Group A | • | |||
| Group B | • | • | • | • |
| Group C | ||||
| Group D | ||||
| Group E | • | |||
| Group F* | • | • | • | • |
| Group G | • | • | • | • |
| Group H | • | • | • | • |
indicates QIBA Profile compliance
indicates algorithm with marginal QIBA Profile compliance
Table 4.b.
Phantom phase: mean Percent Repeatability Coefficient (%RC) with 95% confidence intervals for each of 8 participating groups.
| Group | Physical | Method 1 | Method 2 | Method 3 | ||||
|---|---|---|---|---|---|---|---|---|
| %RC | CI | %RC | CI | %RC | CI | %RC | CI | |
| Group A | 16.88 | [10.53,29.88] | 6.86 | [4.38,13.5] | 3.49 | [2.31,6.56] | 38.5 | [19.51,53.59] |
| Group B | 13.11 | [8.32,23.59] | 2.42 | [1.58,4.87] | 1.82 | [1.22,3.46] | 13.19 | [8.37.23.73] |
| Group C | 18.58 | [11.51,32.65] | 34.77 | [20.15,57.16] | 9.30 | [7.05,12.02] | 27.59 | [16.46,46.68] |
| Group D | 30.88 | [18.18,51.56] | 93.00 | [39.39,188.95] | 4.14 | [2.68,8.26] | 31.35 | [18.42,52.24] |
| Group E | 50.69 | [27.7,78.55] | 91.17 | [43.77,124.14] | 10.52 | [6.61,20.36] | 20.04 | [12.34,34.99] |
| Group F | 8.00 | [6.11,10.41] | 2.07 | [1.38.3.92] | 3.29 | [2.14,6.58] | 7.60 | [4.95,14.04] |
| Group G | 13.07 | [8.12,24.99] | 2.19 | [1.46,4.15] | 1.85 | [1.21,3.73] | 13.35 | [8.46,24] |
| Group H | 12.53 | [7.81,24.03] | 1.82 | [1.22,3.46] | 2.05 | [1.37,3.9] | 11.89 | [8.91,15.19] |
Measurement bias results are given in Figure 5 for all algorithms and only compliant algorithms, respectively. The magnitude of the differences in bias between physical and simulated lesions across all groups was 2.2%, 5.4%, and 2.5% for Methods 1, 2, and 3, respectively. Figure 6 shows the comparative %RDC between physical and virtual insertion methods. When assessed across all algorithms, %RDC had considerable overlap between physical lesions and lesions from Methods 1 and 3. For compliant algorithms only, insertion method with greatest to least overlap trended as Methods 3, 1, and 2, respectively. In GLM analyses for all algorithms (in aggregate), differences in lesion shape, size, and location were not significant predictors of bias. However, for compliant algorithms, spiculated shape significantly increased lesion measurement bias.
Figure 5.
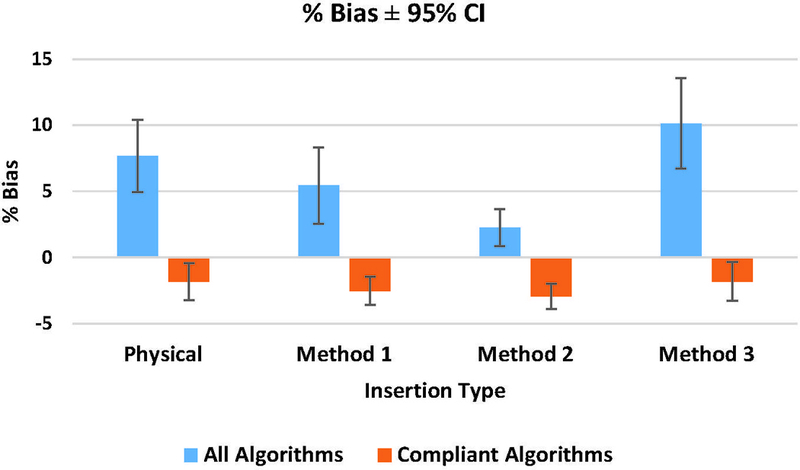
Phantom phase: mean Percent Bias for all algorithms and complaint algorithms with 95% CI.
Figure 6.
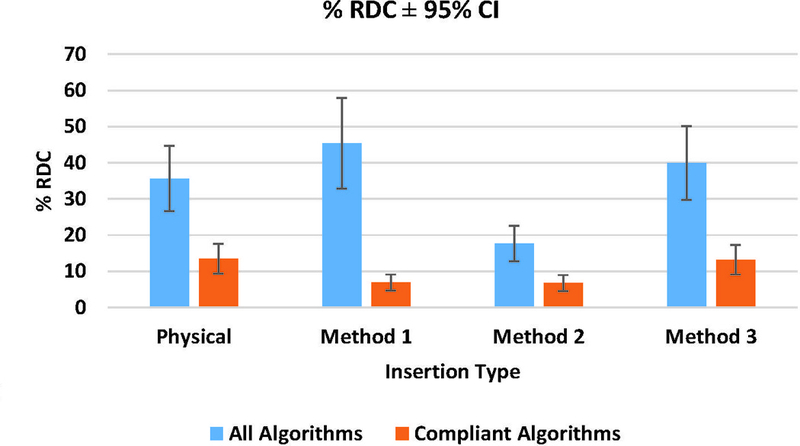
Phantom phase: mean Percent Reproducibility (%RDC) for all algorithms and compliant algorithms with 95% CI.
Clinical Phase
Table 5 shows the overall tumor %RC and %bias. Seven (Groups B, G, I, J, L, O, and P) out of sixteen clinical phase participating groups were deemed QIBA compliant.
Table 5.
Clinical phase: Overall Percent Repeatability Coefficient (%RC) and associated Percent Bias for all algorithms.
| Group | %Rc | %Bais | QIBA Complaint |
|---|---|---|---|
| Group A | 10.47 | 7.39 | |
| Group B | 7.44 | 2.96 | • |
| Group C | 11.77 | 10.89 | |
| Group D | 124.74 | 4.32 | |
| Group E | 127.19 | −12.41 | |
| Group F | 137.36 | −8.89 | |
| Group G | 9.20 | 2.54 | • |
| Group H | 17.95 | −8.22 | |
| Group I | 9.84 | 3.19 | • |
| Group J | 8.21 | −1.26 | • |
| Group K | 22.80 | −7.06 | |
| Group L | 6.66 | 0.33 | • |
| Group M | 19.70 | 1.77 | |
| Group N | 13.32 | −4.43 | |
| Group O | 8.26 | 3.04 | • |
| Group P | 11.95 | −1.10 | • |
indicates QIBA Profile compliance
Figure 7 shows the %RC stratified by tumor size for all participants. Large and small tumors were mostly 30 mm and 10 mm in nominal diameter, respectively. Generally, compliant groups (Groups B, G, and H) produced smaller %RC. RDC results in Figure 8 showed that the reproducibility coefficient for real tumors on average was twice as large as for simulated tumors. Segmentation of simulated tumors was in general less variable than for real tumors.
Figure 7.
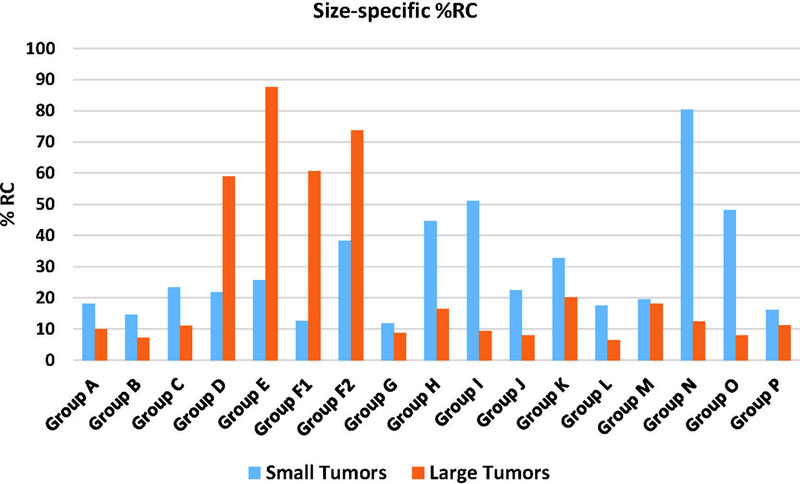
Clinical phase: Percent Repeatability Coefficient (%RC) for all algorithms comparing identical copies of the same virtual lesion that were inserted in different locations.
Figure 8.
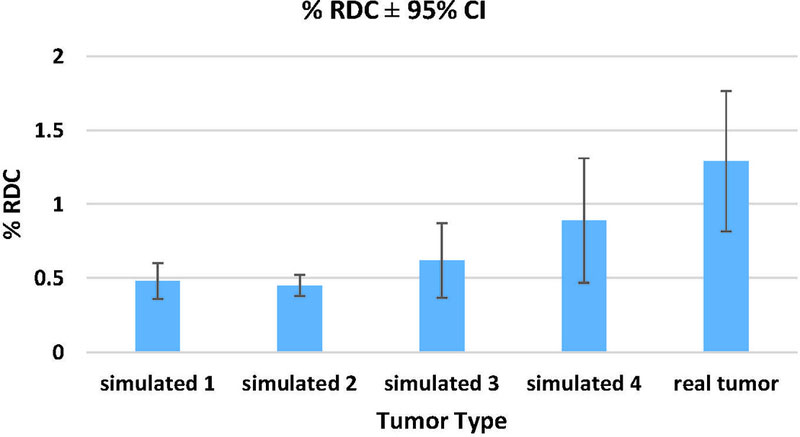
Clinical phase: Percent Reproducibility (%RDC) assessed across all 16 algorithms. RDC was calculated for each tumor with 95% CI. Note, simulated 1 and 2 were 10 mm3, while simulated 3 and 4 were the same size as the real lesions.
DISCUSSION
The objective of this study was to establish a new platform for quantitative imaging system analysis based on hybrid datasets. Our goals were 1) to evaluate the compliance of segmentation algorithms for CT volumetry, 2) to assess equivalence between real and simulated lesions using hybrid datasets, and 3) to study how lesion shape, size, location, segmentation algorithm, and insertion method affect volume estimation using GLM analysis. Building a strategic foundation for systematic evaluation of the technical performance of quantitative imaging biomarkers, the technical performance of hybrid datasets was assessed based on the comparability between hybrid datasets and phantom or actual patient data (i.e., similarity of simulated vs. real lesion volume measurements, measured as percent bias, repeatability coefficient (RC), and reproducibility (RDC)).
The performance of segmentation algorithms was assessed based on compliance with the bias and repeatability standards defined in the QIBA Profile CT Tumor Volumetry for Advanced Disease 2016–11-21b (link). Initially, algorithm profile compliance was assessed based on physical phantom lesion data. In phantom data, four out of eight participant algorithms were determined to be compliant or marginally compliant. In clinical data, seven out of sixteen clinical phase participating groups were deemed QIBA compliant.
In terms of equivalence between real and simulated datasets, comparisons were made between phantom data with physically-inserted lesions and three virtual lesion insertion methods. For compliant algorithms, Method 3 showed statistical equivalence. However, the null hypothesis for Method 1, Method 2, and Method 3 (all algorithms only), could not be rejected. As such, differences in bias and %RC that exceeded 5% were judged to be unacceptable in terms of using the insertion methods as replacements for actual physical phantom data.
Bias and %RC results in Table 4.a and highlighted in Figure 5, respectively, showed that across all algorithms (compliant and non-compliant), neither Methods 1 nor 3 yielded a significantly different bias as compared to the actual physical phantom scans. When considering compliant algorithms only, no difference in the bias of virtual insertion methods versus physical insertion was observed for any of the three insertion methods. This is summarized in Figure 5. These results mirrored what was observed in a prior study involving the aforementioned virtual insertion methods (22). Robins et al. found that volume measurements made using a single commercial segmentation algorithm yielded no difference in bias for any of the virtual insertion methods as compared to the physically-inserted lesions. Further, all of the virtual insertion methods reported similar uncertainty [3.59, 4.13], which indicated strong similarity in performance (22). Although not directly tested in our study, this segmentation algorithm was fully developed, and likely met the QIBA profile requirements. Therefore, it is not surprising that no significant bias was observed among profile-compliant algorithms by Robins et al. and in our study.
RC estimates were made using different locations of the lesion to approximate replicate measurements. RC showed that Method 3 yielded more measurements consistent with those of physical phantoms than Methods 1 and 2 (see Table 4.b). Smaller repeatability coefficient in Methods 1 and 2 could be attributed to a lack of variability in lesion morphological composition. Since Methods 1 and 2 require the development of lesions that were modeled to match the resolution degradation of the CT system, they are inherently susceptible to over-smoothing. Over-smoothing of lesion boundaries can deform lesion appearance, thus degrading the complexity of lesion morphology. The issue of over-smoothing is not present in Method 3, since this method extracts the image of the lesion from phantom data and inserts it back directly into CT data without blurring. Therefore, the re-inserted lesion is essentially an exact replica of the physical lesion.
Reproducibility (RDC) was measured for each algorithm relative to each insertion method. The RDC metric was used to gauge lesion measurement across an array of different algorithms. Across algorithms, a statistically significant difference was only found between the RDC of the physical lesions versus those from Method 2. Meanwhile, Method 3 performed most similarly to the physically-inserted phantom measurements. Note that a low RDC suggested that measurements were less dependent on the segmentation algorithm, and a high RDC suggested that the algorithms did not agree with each other.
On further inspection of the clinical phase results (see Tables 4.a and 4.b), it was also discovered that algorithms with partial compliance could potentially be over-reported as compliant. Partially compliant algorithms are those that were deemed complaint based on measurements of simulated lesions from Methods 1, 2 and 3, but were not considered complaint based on physical phantom measurements. For some algorithms, measurements of lesions simulated with Methods 1 and 2 satisfied the bias/RC requirements for compliance; however, these insertion methods did not fully capture inherent lesion variability. This over-reporting was likely the result of over-smoothing of the lesions, which is summarized in Tables 4.a and 4.c. Direct comparisons between measurements from the physical phantom and Methods 1 and 2 showed the potential for over-reporting of segmentation algorithm performance. Although we considered the magnitude of the measurement discrepancies to be reasonable, further development is needed to more accurately account for the true rendering of lesion variability in CT data.
GLM analyses were performed for all insertion methods relative to lesion shape, size, and location. For all insertion methods, when considering all algorithms, differences in lesion shape, size, and location were not statistically significant. Nonetheless, an assessment of compliant algorithms alone showed that spiculated shapes significantly impacted lesion measurement, while size and location did not. In terms statistically significant difference of insertion methods, it was only apparent in Method 2.
In the clinical phase, pathologically-confirmed clinical tumors were simulated and virtually-inserted into clinical data, such that each case consisted of one real patient tumor and four simulated copies. One image-domain lesion insertion method (Method 2) was evaluated. This was because the clinical phase made use of reconstructed CT data, eliminating the use of Method 1, and some tumors were in the vicinity of lung structures, limiting the effective 3D sizing application of Method 3. Unlike the phantom lesions, some clinical tumors were attached to lung structures and vasculature. This added to the complexity of modeling and reproducing the real tumors. Equivalence between real and simulated lesions was analyzed in terms of RDC. Clinical phase RDC results from 17 participating algorithms showed that the RDC for real tumors was twice as large as for simulated tumors. This result was reflected in Figure 8. However, because the clinical tumors in our study were significantly more spiculated and complex than phantom lesions, the clinical phase RCs and RDCs were generally larger than the RDCs reported in phantom phase (Figures 7 and 8). Generally, compliant algorithms produced lower RDC results. Similarly, in a study involving clinical test-retest data, Buckler et al. reported that algorithms meeting the QIBA profile had the lowest RDC. This suggested that perhaps compliant algorithms produced more stable measurements and had less of an influence on volume estimation.
One may wonder why simulated lesions were inserted into the same image as the original lesion. Since a goal of this study was to assess the equivalence between simulated and real lesions, it was necessary to create a controlled scenario where any potential difference was minimized. The virtual insertion of lesions using the image-domain method required that the target data be identical to the source data for an „apples to apples‟ comparison between real and simulated lesions. While it is possible to cross-embed lesions into images using our method, doing so would result in the introduction of potential confounding factors in assessing the equivalence of hybrid datasets as a potential surrogate to patient data.
There were several limitations of our study. Simple homogeneous lesions that do not precisely represent clinical reality were used in the phantom phase of this study. These lesions had identical attenuation. Lesions with ground-glass opacities were not included. Nevertheless, we believe that this simple study design has allowed us to achieve the aim of assessing hybrid datasets relative to reference phantom CT datasets for which ground truth was known. In the clinical phase, simulated tumors were not placed in the exact same locations as the real tumors for obvious reasons. However, location approximations were identified by an experienced radiologist (fellowship trained with over nine years of clinical experience) to account for general tumor environment similarity. Lastly, readers were given the option to choose window level and window width settings that they typically use at their institution. This afforded participants the opportunity to use settings they found to be most suitable for completing segmentation task with their algorithms.
This study embodied a “challenge” paradigm in segmentation tool performance evaluation. We assessed hybrid datasets (CT images with virtually-inserted lesions) in the phantom and clinical contexts. We sought to determine whether hybrid datasets could be used as surrogates to patient datasets for assessment of segmentation tool compliance to the CT volumetry profile. Given that phantoms tend to be over-simplified and lack biological variability, and ground truth is often difficult to obtain in clinical cases, virtually-inserting simulated lesions into real patient CT data could potentially provide a systematic and technically feasible platform for evaluating segmentation algorithms. Furthermore, additional benefits of this approach include eliminating patient risk, increasing study design flexibility, and decreasing cost. A prior study compared real clinical tumors and corresponding simulated models were using Bland and Altman analysis. Based on measurements from three commercial segmentation tools, results showed that real and simulated tumors were not statistically different (p = 0.3)(23).
In the current study, the differences between the simulated and real lesions were likewise small (in the order of 2–5% in terms of % bias difference and 0.1–16% in terms of % RC difference). Further, it could be argued that the TOST margins for equivalence were too conservative for practical equivalence. As such, more complex lesion models inserted into clinical images would almost certainly become the defining factor, instead of the insertion method. Thus, strictly speaking, the current study across a large cohort of segmentation algorithms indicate that the simulated lesions are not statistically equivalent to real ones, however, this offers three prospects going forward. First, given the reasonable level of interchangeability between real and simulated lesions, it is worthwhile to consider hybrid datasets as an approximate (but not exact) surrogate for volumetric compliance. Second, systematic difference between real and simulated lesions can be used as a basis to either calibrate the results from hybrid data to those of real lesions, or alternatively seek to define a different set of QIBA compliance definitions for hybrid datasets. Finally, further development and validation of simulation methods, particularly in the replication of real lesion variability, are warranted to enhance the quality and realism of hybrid datasets.
Table 3.
Percent Bias and repeatability coefficient (%RC) thresholds for QIBA compliance.
| % RC | Allowable Overall % Bias |
|---|---|
| 5% | ≤6.6% |
| 6% | ≤6.3% |
| 7% | ≤6.1% |
| 8% | ≤5.7% |
| 9% | ≤5.3% |
| 10% | ≤4.8% |
| 11% | ≤4.3% |
| 12% | ≤3.5% |
| 13% | ≤2.6% |
| 14% | ≤0.6% |
| 15% | ≤0% |
ACKNOWLEDGEMENT
The authors gratefully acknowledge the participation of the following individuals and entities in the challenge: Angel Albarich-Bayarri of QUIBIM, Hubert Beaumont of Median Technologies, Roshni Bhaglia and Suvadip Mukherjee of GE, F. Fieldai, A.J. Gearha, Rainer Grimmer and Yefeng Zheng of Siemens, Taylor Brunton Smith, Jocelyn Hoye, and Yuese Zheng of Duke University, Colin Jacobs of Radboud University, Julie Lisiecki of RSNA, Artem Mamonov of Massachusetts General Hospital, Ravi Mankala of PAREXEL, Tatsuaki Kobayashi of Visionary Imaging Services, Bernd Kümmerlen of MeVis Medical Solutions, Steve Metz of Philips, Mario Silva of University of Parma, Pierre Tervé of Keosys, Tiferet Gazit of Algotec, Amit Vasanji of Image IQ. Funding was provided by the Radiological Society of North America (RSNA) and National Institute of Biomedical Imaging and Bioengineering (NIBIB) through contract number HHSN268201300071C.
Abbreviations
- 3D
3 dimensional
- RIDER
Reference Image Database to Evaluate Therapy Response
- QIBA
Quantitative Imaging Biomarker Alliance
- CT
Computed Tomography
- CAD
Computer-aided design
- MTF
Modulation Transfer Function
- ROI
Region of interest
- TOST
Schuirmann’s two one-sided test
- %RC
Percent repeatability coefficient
- %bias
Percent bias
- %RDC
Percent reproducibility
- GLM
generalized linear model
- CI
Confidence interval
ALGORITHM DESCRIPTIONS
Sixteen groups participated in the challenge by submitting volume readings. Description of algorithms were provided.
| Participant | Algorithm Category / Degree of Automation |
Description of Process / Workflow |
|---|---|---|
| Group B | Limited boundary modification (on <15% of the lesions) |
Activate the lung lesion segmentation and draw a stroke over the lesion with using the LMB. Preferred location and extend for this stroke is the largest diameter of the lesion. The stroke is taken as seed for the segmentation. |
| Group C | Limited boundary modification (on <15% of the lesions) |
As the images were of chest and the tumors, data sets were in lung parenchyma, all the volume assessments were made using a fixed lung window/level display setting of 200 HU (window) and −1400 HU (level). A trained non-radiologist opened the images in a viewer and used the tumor locations to identify the tumors on images and outlined/draw ROIs of the identified tumors using automated algorithms. Finally, that image data were reviewed by trained radiologist for final assessment of outlines/ROIs. The trained radiologist evaluated the quality of the segmentation and adjusted outlines with automated and semiautomated tools, as necessary based on radiological/clinical judgment. Once trained radiologist was satisfied with all the outlines/ROIs of the respective tumor(s) data, the automated volume assessment tool was used to calculate volume. The images with ROI were converted to .nii format for submission. |
| Group D | Limited boundary modification (on <15% of the lesions) |
As the images were of chest and the tumors data sets were in lung parenchyma, all the volume assessments were made using a fixed lung window/level display setting of 200 HU (window) and −1400 HU (level). A trained non-radiologist opened the images in a viewer and used the tumor locations to identify the tumors on images and outlined/draw ROIs of the identified tumors using automated algorithms. The trained non-radiologist evaluated the quality of the segmentation and adjusted outlines with automated and semi-automated tools, as necessary. Once trained non- radiologist, was satisfied with all the outlines/ROIs of the respective tumor(s) data, the automated volume assessment tool was used to calculate volume. The images with ROI were converted to .nii format for submission. |
| Group E | Totally automatic (uses only seed points and ROI information) |
The algorithm uses a deep learning based initialization, and the result is refined via 3D graph cut. Only a single user click on the nodule is necessary |
| Group F | Totally automatic (uses only seed points and ROI information) |
The algorithm is an edge-based segmentation method that uniquely combines the image processing techniques of marker-controlled watershed and active contours. An operator needs to initialize the algorithm by manually drawing a region-of-interest encompassing the lesion on a single slice and then the watershed method generates an initial surface of the lesion in three dimensions, which is refined by the active contours. The volume, maximum diameter and maximum perpendicular diameter of a segmented lesion are then calculated automatically. |
| Group G | Moderate boundary adjustment (on <50% of the lesions) |
Started with an automatic single click segmentation. If the single click did not capture the volume, multiple clicks were made in different locations. If the multiple clicks were insufficient, manual corrections were made. |
| Group H | Totally automatic (uses only seed points and ROI information) |
The algorithm needs a single seed point to perform the segmentation. Therefore the user clicks on the rough area of the lesion to get a zoomed in image on which the precise seed is set as input to the algorithm |
| Group I | Moderate boundary adjustment (on <50% of the lesions) |
Processed by an automatic single click segmentation. Manual corrections were made when necessary. |
| Group J | Moderate boundary adjustment (on <50% of the lesions) |
One click segmentation seeded by the user. The seed point is typically in the center of tumor. |
| Group K | Moderate boundary adjustment (on <50% of the lesions) |
Began with single-click segmentations. Attempted multiple single-click segmentations if the first was unsuccessful. If unsuccessful after 5 single-click attempts, added/subtracted regions manually. |
| Group M | Moderate boundary adjustment (on <50% of the lesions) |
Single-click segmentations with occasional manual editing. |
Groups A, L, N, O, and P did not provide segmentation tool workflow description.
Footnotes
Publisher's Disclaimer: This is a PDF file of an unedited manuscript that has been accepted for publication. As a service to our customers we are providing this early version of the manuscript. The manuscript will undergo copyediting, typesetting, and review of the resulting proof before it is published in its final citable form. Please note that during the production process errors may be discovered which could affect the content, and all legal disclaimers that apply to the journal pertain.
Contributor Information
Marthony Robins, Carl E. Ravin Advanced Imaging Laboratories Medical Physics Graduate Program Duke University Medical Center, Durham, North Carolina 27705.
Jayashree Kalpathy-Cramer, Massachusetts General Hospital, Boston, MA.
Nancy A. Obuchowski, Cleveland Clinic Foundation, Cleveland, Ohio.
Andrew Buckler, Elucid Bioimaging Inc., 225 Main Street, Wenham, MA 01984.
Maria Athelogou, Definiens AG, München, Germany.
Rudresh Jarecha, PAREXEL Informatics, Billerica, MA 01821.
Nicholas Petrick, Center for Devices and Radiological Health, U.S. Food and Drug Administration, Silver Spring, MD 20993.
Aria Pezeshk, Center for Devices and Radiological Health, U.S. Food and Drug Administration, Silver Spring, MD 20993.
Berkman Sahiner, Center for Devices and Radiological Health, U.S. Food and Drug Administration, Silver Spring, MD 20993.
Ehsan Samei, Carl E. Ravin Advanced Imaging Laboratories Medical Physics Graduate Program Duke University Medical Center, Durham, North Carolina 27705.
REFERENCES
- 1.Lozano R, Naghavi M, Foreman K, Lim S, Shibuya K, Aboyans V, et al. “Global and regional mortality from 235 causes of death for 20 age groups in 1990 and 2010: a systematic analysis for the Global Burden of Disease Study 2010”. The Lancet 2013;380(9859):2095–128. [DOI] [PMC free article] [PubMed] [Google Scholar]
- 2.Molina JR, Yang P, Cassivi SD, Schild SE, Adjei AA, editors. Non-small cell lung cancer: epidemiology, risk factors, treatment, and survivorship. Mayo Clinic Proceedings; 2008: Elsevier. [DOI] [PMC free article] [PubMed] [Google Scholar]
- 3.Stewart BW, Kleihues P, Cancer IAfRo World cancer report: IARC press Lyon; 2003. [Google Scholar]
- 4.French SW. “Metastatic patterns of cancers: results from a large autopsy study”. Archives of pathology & laboratory medicine 2008;132(6):931. [DOI] [PubMed] [Google Scholar]
- 5.Humphrey L, Deffebach M, Pappas M, Baumann C, Artis K, Mitchell JP, et al. “Screening for lung cancer: Systematic review to update the US Preventive Services Task Force recommendation” 2013. [PubMed] [Google Scholar]
- 6.Thirion J- P, Calmon G. “Deformation analysis to detect and quantify active lesions in three-dimensional medical image sequences”. Medical Imaging, IEEE Transactions on 1999;18(5):429–41. [DOI] [PubMed] [Google Scholar]
- 7.Eisenhauer E, Therasse P, Bogaerts J, Schwartz L, Sargent D, Ford R, et al. “New response evaluation criteria in solid tumours: revised RECIST guideline (version 1.1)”. European journal of cancer 2009;45(2):228–47. [DOI] [PubMed] [Google Scholar]
- 8.Goldstraw P “The 7th Edition of TNM in Lung Cancer: what now?”. Journal of Thoracic Oncology 2009;4(6):671–3. [DOI] [PubMed] [Google Scholar]
- 9.Goldstraw P, Crowley J, Chansky K, Giroux DJ, Groome PA, Rami-Porta R, et al. “The IASLC Lung Cancer Staging Project: proposals for the revision of the TNM stage groupings in the forthcoming (seventh) edition of the TNM Classification of malignant tumours”. Journal of thoracic oncology 2007;2(8):706–14. [DOI] [PubMed] [Google Scholar]
- 10.MacMahon H, Naidich DP, Goo JM, Lee KS, Leung AN, Mayo JR, et al. “Guidelines for Management of Incidental Pulmonary Nodules Detected on CT Images: From the Fleischner Society 2017”. Radiology 2017:161659. [DOI] [PubMed]
- 11.Radiology ACo. Lung CT Screening Reporting and Data System (Lung-RADS): American College of Radiology; [Available from: http://www.acr.org/Quality-Safety/Resources/LungRADS.
- 12.Thirion J-P, editor Software to assist in monitoring treatment. IBC’s 3rd Annual Multiple Sclerosis Conference; 1995.
- 13.Thirion J-P, Calmon G. “Deformation analysis to detect and quantify active lesions in 3D medical image sequences” 1997. [DOI] [PubMed]
- 14.Jaffe CC. “Measures of response: RECIST, WHO, and new alternatives”. Journal of Clinical Oncology 2006;24(20):3245–51. [DOI] [PubMed] [Google Scholar]
- 15.Mozley PD, Schwartz LH, Bendtsen C, Zhao B, Petrick N, Buckler AJ. “Change in lung tumor volume as a biomarker of treatment response: a critical review of the evidence”. Annals of oncology 2010;21(9):1751–5. [DOI] [PubMed] [Google Scholar]
- 16.Park JO, Lee SI, Song SY, Kim K, Kim WS, Jung CW, et al. “Measuring response in solid tumors: comparison of RECIST and WHO response criteria”. Japanese journal of clinical oncology 2003;33(10):533–7. [DOI] [PubMed] [Google Scholar]
- 17.Buckler AJ, Danagoulian J, Johnson K, Peskin A, Gavrielides MA, Petrick N, et al. “Inter-Method Performance Study of Tumor Volumetry Assessment on Computed Tomography Test-Retest Data”. Academic radiology 2015;22(11):1393–408. [DOI] [PMC free article] [PubMed] [Google Scholar]
- 18.Tran LN, Brown MS, Goldin JG, Yan X, Pais RC, McNitt-Gray MF, et al. “Comparison of treatment response classifications between unidimensional, bidimensional, and volumetric measurements of metastatic lung lesions on chest computed tomography 1”. Academic radiology 2004;11(12):1355–60. [DOI] [PubMed] [Google Scholar]
- 19.Petrick N, Kim HJG, Clunie D, Borradaile K, Ford R, Zeng R, et al. “Comparison of 1D, 2D, and 3D nodule sizing methods by radiologists for spherical and complex nodules on thoracic CT phantom images”. Academic radiology 2014;21(1):30–40. [DOI] [PubMed] [Google Scholar]
- 20.McNitt-Gray MF, Kim GH, Zhao B, Schwartz LH, Clunie D, Cohen K, et al. “Determining the variability of lesion size measurements from ct patient data sets acquired under “no change” conditions”. Translational oncology 2015;8(1):55–64. [DOI] [PMC free article] [PubMed] [Google Scholar]
- 21.Athelogou M, Kim HJ, Dima A, Obuchowski N, Peskin A, Gavrielides MA, et al. “Algorithm Variability in the Estimation of Lung Nodule Volume From Phantom CT Scans: Results of the QIBA 3A Public Challenge”. Academic radiology 2016;23(8):940–52. [DOI] [PMC free article] [PubMed] [Google Scholar]
- 22.Robins M, Solomon J, Sahbaee P, Sedlmair M, Roy Choudhury K, Pezeshk A, et al. “Techniques for virtual lung nodule insertion: volumetric and morphometric comparison of projection-based and image-based methods for quantitative CT”. Phys Med Biol 2017;62(18):7280–99. [DOI] [PMC free article] [PubMed] [Google Scholar]
- 23.Robins M, Solomon J, Hoye J, Smith T, Ebner L, Samei E. Inter-algorithm Lesion Volumetry Comparison of Real and 3D Simulated Lung Lesions in CT SPIE Medical Imaging; 2017: International Society for Optics and Photonics. [Google Scholar]
- 24.Li Q, Gavrielides MA, Zeng R, Myers KJ, Sahiner B, Petrick N. “Volume estimation of low-contrast lesions with CT: a comparison of performances from a phantom study, simulations and theoretical analysis”. Physics in medicine and biology 2015;60(2):671. [DOI] [PMC free article] [PubMed] [Google Scholar]
- 25.Pezeshk A, Sahiner B, Zeng R, Wunderlich A, Chen W, Petrick N. “Seamless Insertion of Pulmonary Nodules in Chest CT Images”. IEEE Trans Biomed Eng 2015. [DOI] [PMC free article] [PubMed]
- 26.Solomon J, Samei E. “A generic framework to simulate realistic lung, liver and renal pathologies in CT imaging”. Physics in medicine and biology 2014;59(21):6637. [DOI] [PubMed] [Google Scholar]
- 27.Schuirmann DJ. “A comparison of the two one-sided tests procedure and the power approach for assessing the equivalence of average bioavailability”. Journal of pharmacokinetics and biopharmaceutics 1987;15(6):657–80. [DOI] [PubMed] [Google Scholar]