Figure 1.
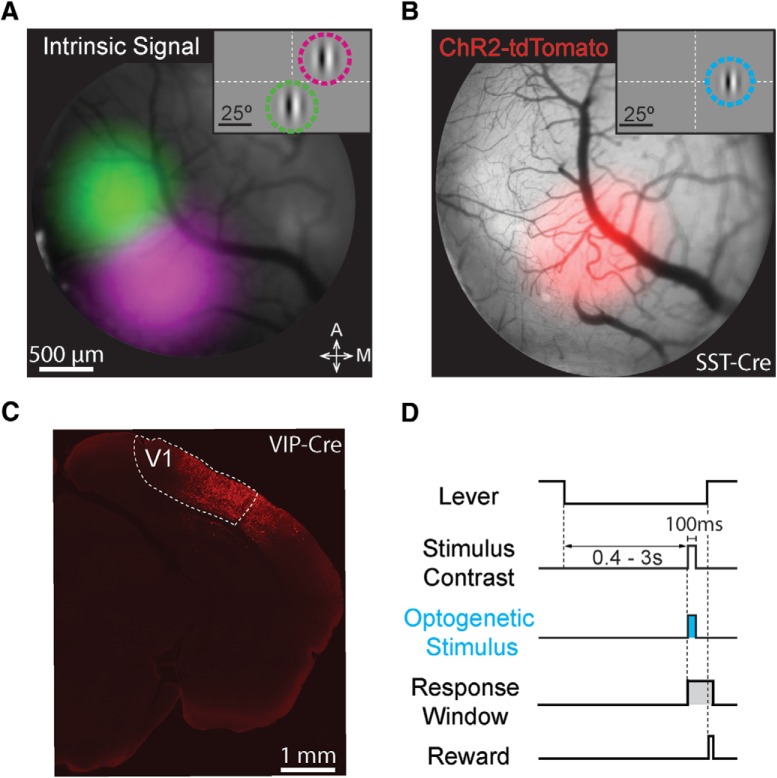
Targeting ChR2 to retinotopically defined areas of visual cortex. A, Pseudo-colored intrinsic autofluorescence responses to visual stimuli presented in two locations in a SST-Cre mouse. Magenta and green features represent 2D-Gaussian fits of responses to stimuli at visual field locations depicted in the inset (green: 0° azimuth, –20° elevation; magenta: 25° azimuth, +20° elevation; Gabor SD = 10°). Dashed lines represent horizontal and vertical meridians. A: anterior; M: medial. B, ChR2-tdTomato fluorescence (2D-Gaussian fit) from the same cortical region shown in A. The retinotopic location corresponding to maximal expression was used in all behavioral sessions (shown in inset; 25° azimuth, 0° elevation; Gabor SD = 6.75°). Conventions as in A. C, Representative confocal image of ChR2-tdTomato expression in the visual cortex (V1) of a VIP-Cre mouse. D, Trial schematic of the contrast increment detection task. Following the intertrial interval, a trial begins when the mouse depresses the lever. A visual stimulus could appear from 400–3000 ms following trial onset. The mouse had to release the lever within 700–900 ms after stimulus onset to receive reward. On a randomly selected half of the trials, ChR2-expressing interneurons were illuminated with blue light for 100 ms concurrent with the visual stimulus.

