

Abstract
Objective
Physiological changes potentially influence disease progression and survival along the Amyotrophic Lateral Sclerosis (ALS)‐Frontotemporal dementia (FTD) spectrum. The peripheral peptides that regulate eating and metabolism may provide diagnostic, metabolic, and progression biomarkers. The current study aimed to examine the relationships and biomarker potential of hormonal peptides.
Methods
One hundred and twenty‐seven participants (36 ALS, 26 ALS‐ cognitive, patients with additional cognitive behavioral features, and 35 behavioral variant FTD (bvFTD) and 30 controls) underwent fasting blood analyses of leptin, ghrelin, neuropeptide Y (NPY), peptide YY (PYY), and insulin levels. Relationships between endocrine measures, cognition, eating behaviors, and body mass index (BMI) were investigated. Biomarker potential was evaluated using multinomial logistic regression for diagnosis and correlation to disease duration.
Results
Compared to controls, ALS and ALS‐cognitive had higher NPY levels and bvFTD had lower NPY levels, while leptin levels were increased in all patient groups. All groups had increased insulin levels and a state of insulin resistance compared to controls. Lower NPY levels correlated with increasing eating behavioral change and BMI, while leptin levels correlated with BMI. On multinomial logistic regression, NPY and leptin levels were found to differentiate between diagnosis. Reduced Neuropeptide Y levels correlated with increasing disease duration, suggesting it may be useful as a potential marker of disease progression.
Interpretation
ALS‐FTD is characterized by changes in NPY and leptin levels that may impact on the underlying regional neurodegeneration as they were predictive of diagnosis and disease duration, offering the potential as biomarkers and for the development of interventional treatments.
Introduction
It is increasingly recognized that amyotrophic lateral sclerosis (ALS) and frontotemporal dementia (FTD) represent a spectrum of diseases with considerable overlap at genetic, pathological, and behavioral levels.1, 2, 3, 4 Patients along this spectrum also have differing changes in eating and metabolism5, 6 that may potentially effect disease progression and survival.7 It is widely accepted that ALS patients are hypermetabolic8, 9 which is associated with worse prognosis. Emerging research suggests that patients develop changes in eating behavior including changes in fat intake7 to overcome the hypermetabolic state.5 It is currently not known whether these changes in metabolism represent pathogenic drivers or are adaptive mechanisms to the underlying neurodegenerative process.
In FTD, key changes have been shown in the hypothalamus10 and associated peripheral and central peptides involved in the control of eating behavior and metabolism.10, 11, 12 In ALS, it is also emerging that changes in eating behavior can develop as patients develop cognitive change.7 The hypothalamus has been implicated in changes in body mass index (BMI) in both ALS patients and presymptomatic genetic cohorts.13 It is currently not known whether eating peptide levels that control eating behavior and metabolism, through interactions with the hypothalamus impact the neurodegenerative process. While their levels are predicted to correlate with metabolic changes including BMI, their impact on diagnostic features, like motor, cognitive, and/or behavioral change, may reflect a more direct link to the initiation of regional neurodegeneration disease and/or their duration and progression.
Given this potential link, the current study aimed to examine eating peptides (ghrelin, peptide tyrosine tyrosine or PYY, leptin, neuropeptide Y or NPY, and insulin) and their relationship to metabolic status, and clinical phenotype across the ALS‐FTD spectrum. The study also aimed to examine the biomarker potential of these neuroendocrine peptides to independently predict clinical diagnosis.
Methods
Patients
One hundred and twenty‐seven participants (36 ALS, 26 ALS‐cognitive: ALS patient with additional cognitive deficits, 35 bvFTD, compared to 30 control subjects) were recruited from the ForeFront clinics, Sydney, Australia. All patients met current clinical diagnostic criteria for probable ALS,14 ALS‐FTD15, or bvFTD.16 ALS patients with enteral feeding via PEG tube, or where a carer was not available, were excluded from the study. Carers completed all surveys at a single visit and at this visit cognitive measures, fasting blood samples, and BMI were measured.
The presence of abnormalities in the C9orf72, SOD1, TDP43, FUS, GRN, and MAPT genes was examined in all patients. Motor function was assessed using the ALS Functional Rating Scale (ALSFRS‐R)17 and patients were subclassified as limb or bulbar predominant based on their initial presentation. Cognitive function was assessed using previous validated criteria18, 19, 20 with ALS patients subclassified as ALS‐cognitive if they had ALS‐FTD20 (10 patients) or displayed behavioral or cognitive features that did not meet the criteria for ALS‐FTD (16 patients). Specifically, the presence of cognitive features was demonstrated by showing abnormalities on two validated tasks of executive function, with patients scoring below the fifth percentile. These tests were excluded letter fluency, the Hayling sentence completion test, letter fluency (P), category fluency (animals), and Trails (time B‐A).19 The presence of behavioral features was established by impairment in at least two nonoverlapping behaviors assessed by carer questionnaire (Cambridge Behavioral Inventory‐CBI),19, 21 and corroborated with carer interview. The CBI has been validated as sensitive to behavioral changes in ALS.22, 23 Healthy controls were recruited from a panel of volunteers and were age‐ and education‐matched and scored above 88/100 on the Addenbrooke's Cognitive Examination‐Revised (ACE‐R).24
Standard protocols and approvals and role of funding source
This study was approved by the University of New South Wales and the South Eastern Sydney Area Health Service human ethics committees. Written informed consent was obtained.
Eating behavior and physical measurements
Eating behavior
Carers completed the Appetite and Eating Habits Questionnaire (APEHQ)11, 25 and Cambridge Behavioural Inventory (CBI), which have been validated previously to assess eating behavior in ALS and FTD.7
Assessment of daily food intake
Information on overall caloric intake, macronutrient composition, and food preferences was obtained using the Dietary Questionnaire for Epidemiological Studies (DQES) (http://www.cancervic.org.au/about-our-research/cancer-statistics/nutritional_assessment_services), a questionnaire completed by carers. Output provides comprehensive information on food and drink intake (e.g., water, kilojoule, total fat, total protein, carbohydrates, and sugars).
Physical measurements
Height and weight were measured (shoes removed). BMI was calculated: weight (kg)/height (m2).
Peripheral peptide levels
Blood samples
Blood samples were obtained following a 10‐hour fast. Sixteen milliliter of blood was collected in two serum separating tubes (SST) and 4 mL in an EDTA tube. SST tubes were centrifuged at 3500 rpm for 10 min after resting for 30 min. A portion of the serum sample was frozen at −80°C for batch analysis for leptin. To inhibit protein degradation, 260 μL of Aprotinin – Bovine (Serine protease inhibitor) and 40 μL of Ile‐Pro‐Ile (an inhibitor of dipeptidyl peptidase IV) was added to the RDTA tube. The sample with inhibitors was centrifuged immediately at 3500 rpm for 10 min then the plasma was extracted and snap frozen by immersion in liquid nitrogen. The sample was then stored frozen at −80°C prior to batch analysis for ghrelin, NPY, and PYY. Ten percent of the cohort was duplicated in each assay to account for intra‐assay variations. % Coefficient of variation of <10% was accepted as a valid assay.
Eating peptides
Quantitative sandwich ELISA techniques were used to measure concentration of leptin (Quantikine, RnD Systems, Minneapolis) and NPY (Merck, St Louis) in human serum. The absorbance was measured at 450 nm and the concentration of peptides in serum was obtained in pg/mL (NPY) and ng/mL (Leptin). Competitive Enzyme Immunoassay (EIA) techniques were used to measure concentration of ghrelin in human serum (Sigma Aldrich, St Louis, MO) and PYY in human plasma (Aviva Systems Biology, San Diego, CA). The absorbance was measured at 450 nm and the concentration of peptides was obtained in ng/mL for ghrelin and pg/mL for PYY.
Insulin levels
Fasting serum insulin was measured using ELISA (Mercodia, Uppsala, Sweden). Absorption was determined using a microplate reader (POLARstar Omega, BMG Labtech, Ortenbeg, Germany) at a wavelength of 450 nm.
Insulin resistance
Insulin resistance was calculated with the homeostasis model assessment of insulin resistance (HOMA‐IR)26, 27 using the following formula:
Low HOMA‐IR values indicate high insulin sensitivity, whereas high HOMA‐IR values indicate low insulin sensitivity (insulin resistance).
Data analysis
Data were analyzed using IBM SPSS statistics (version 24.0). Kolmogorov–Smirnov tests were used to determine suitability of variables for parametric analyses. Analysis of variance (ANOVA), followed by Tukey post hoc tests, was used to determine group differences for the demographic/clinical (age, ACE‐R) and eating (AEHQ, CBI eating, BMI) variables. Differences in frequency patterns of categorical variables (e.g., sex) were examined with Chi‐squared tests and post hoc Fisher exact tests (P < 0.05 regarded as significant).
A multinomial regression model was created to examine the ability of the measured peptide levels to predict diagnosis (outcome variable referenced to bvFTD) and post hoc Kruskal–Wallis tests followed by post hoc Mann–Whitney U tests corrected for multiple comparisons (P ≤ 0.01 regarded as significant) were used to confirm group differences. Multiple linear regression analyses, using hierarchical and enter regression models, were used to determine the relationships between key peptides and the diagnostic variables of cognitive status (Total ACE‐R) and eating behavior (CBI total eating score, APEHQ and BMI) as well as disease duration. Age was also included in the models as a covariate to account for changes in peptide levels with age. Post hoc Spearman correlations were used to confirm relationships. ALSFRS scores were not included in the regression modeling as this measure is not used to assess bvFTD patients.
Results
Demographics and diagnostic variables
The study cohort consisted of 62 ALS patients (36 ALS, 26 ALS‐cognitive), 35 bvFTD, and 30 healthy controls. Patient demographics confirmed representative disease cohorts for cognition, and eating behavior (Tables 1 and 2).
Table 1.
Demographic and clinical characteristics for the ALS, FTD and control groups
| ALS | ALS‐cog | bvFTD | Controls | F value | Post hoc test | |
|---|---|---|---|---|---|---|
| Sex (M:F) | 26:10 | 20:6 | 23:12 | 17:13 | NS1 | N/A |
| Age (years) | 56.1 ± 11.5 | 62.3 ± 10.3 | 63.4 ± 9.3 | 66.5 ± 13.8 | **4.9 | Controls > ALS |
| Disease duration (years) | 1.7 ± 1.1 | 2.9 ± 2.2 | 6.3 ± 2.9 | N/A | ***37.4 | ALS < bvFTD |
| ACE‐R total (100) | 94 ± 3.2 | 82 ± 11.8 | 80 ± 10.3 | 94 ± 3.6 | ***28.0 | Controls > ALS‐cog, bvFTD; ALS > ALS‐cog, bvFTD |
| ALSFRS scores | 38.7 ± 7.2 | 41.3 ± 5.8 | NA | NA | NS | N/A |
| Limb: bulbar onset | 27:9 | 18:8 | NA | NA | NS | NA |
Data presented as mean ± standard deviation. NS, not significant; N/A, not applicable.
*P < 0.05, **P < 0.01, ***P < 0.001.
1Chi‐square test.
Table 2.
Eating behavioral scores across the ALS‐FTD spectrum
| ALS | ALS‐cog | bvFTD | Controls | F value | Post Hoc | |
|---|---|---|---|---|---|---|
| APEHQ total | 21.9 ± 22.3 | 40.1 ± 27.8 | 65.7 ± 35.9 | N/A | 12.2*** | bvFTD > ALS‐Cog, ALS |
| CBI: Eating total | 0.5 ± 0.6 | 3.6 ± 4.9 | 7.6 ± 3.2 | N/A | 23.9*** | bvFTD > ALS‐cog > ALS |
| BMI | 25.5 ± 4.2 | 29.3 ± 5.3 | 29.5 ± 4.7 | 25.0 ± 3.3 | 7.6*** | bvFTD = ALS‐cog > ALS, Control |
| CBI total frequency score | 17.2 ± 11.0 | 45.7 ± 32.5 | 70.9 ± 28.5 | N/A | 22.1*** | bvFTD > ALS‐cog > ALS |
| Total caloric intake | 8348 ± 3072 | 9207 ± 4754 | 9735 ± 4314 | 6672 ± 1806 | 3.0* | bvFTD > Control |
Data presented as mean ± standard deviation.
*P < 0.05, **P < 0.01, ***P < 0.001.
Predictive eating peptide levels
On multinomial regression, the measured peptide levels were found to be predictive of diagnosis (χ 2 = 60.9, P < 0.001). The individual OR are shown in Table 3, with NPY being predictive of a diagnosis of ALS, ALS‐cognitive, and control subjects compared to bvFTD, leptin was also predictive of bvFTD compared to controls.
Table 3.
Multinomial regression: relationship of peptides to diagnosis
| Parameter | Odds ratio | P value | 95% Confidence interval |
|---|---|---|---|
| ALS | |||
| Insulin | 1.04 | 0.126 | 0.988–1.1 |
| Leptin | 1.0 | 0.095 | 1.0–1.1 |
| NPY | 1.4*** | 0.000 | 1.1–1.5 |
| ALS‐cog | |||
| Insulin | 1.0 | 0.301 | 0.975–1.1 |
| Leptin | 1.0 | 0.347 | 1.0–1.0 |
| NPY | 1.3** | 0.001 | 1.1–1.4 |
| Control | |||
| Insulin | 0.849 | 0.09 | 0.703–1.0 |
| Leptin | 1.2* | 0.020 | 1.1–1.3 |
| NPY | 1.2* | 0.045 | 1.1–1.4 |
All results compared to bvFTD group.
*P < 0.05, **P < 0.01, ***P < 0.001.
Assessment of group differences for NPY (H (3) = 25.3 P < 0.001) showed increased levels in ALS (mean = 52.7 ± 18.2 pg/mL, U = 278.0, P = 0.002) and ALS‐cognitive (mean = 45.4 ± 15.7 pg/mL, U = 216.0, P = 0.003) compared to controls (mean = 39.5 ± 8.2 pg/mL) and decreased levels in bvFTD (mean = 33.4 ± 9.4 pg/mL) compared to ALS (U = 202.0, P < 0.001), ALS‐cognitive (U = 216.0, P = 0.003) and controls (U = 280.0, P = 0.01).
Assessment of group differences for leptin (H (3) = 11.3, P = 0.01) showed elevated levels in all diagnostic groups (ALS mean = 10.548 ± 8.819 ng/mL; U = 266.0, P = 0.01; ALS‐cognitive mean = 13.312 ± 15.032 ng/mL; U = 178.0, P = 0.006; bvFTD mean = 15.878 ± 14.823 ng/mL; U = 2145.0, P < 0.001) compared to controls (mean = 5.994 ± 3.723 ng/mL).
The blood levels for ghrelin and PYY did not differ across groups (Fig. 1).
Figure 1.
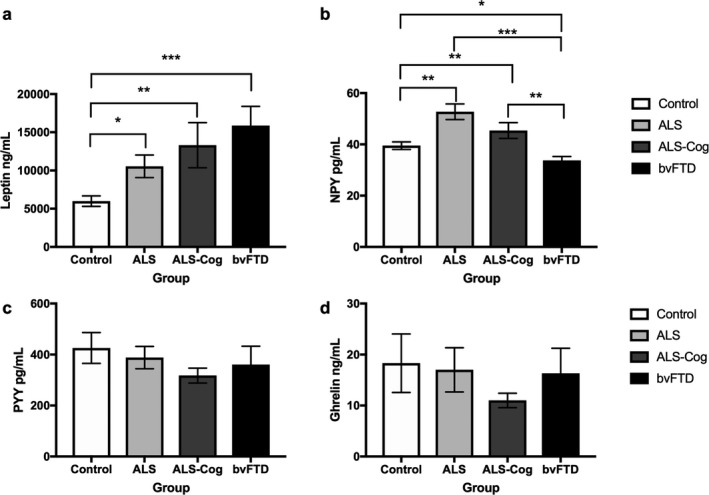
Eating blood peptide levels across the ALS‐FTD spectrum. Blood levels of (A) Leptin, (B) NPY, (C) PYY and (D) ghrelin. *P < 0.05, **P < 0.01, ***P < 0.001.
Insulin levels and HOMA‐IR scores as a reflection of insulin resistance (Fig. 2) also differed across the groups, with a state of increased insulin resistance and increased insulin levels (H (3) = 16.1, P < 0.001) in ALS (mean = 15.8 ± 24.9 mU/L, U = 266.0, P = 0.01), ALS‐ cognitive (mean = 13.7 ± 11.9 mU/L, U = 174.0, P = 0.007), and bvFTD (mean 11.9 ± 5.7, U = 145.0, P < 0.001) compared to controls (mean = 6.33 ± 2.4).
Figure 2.
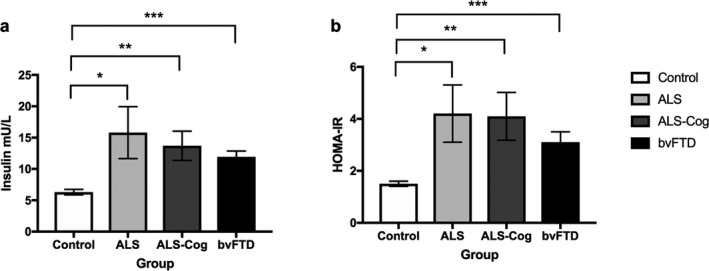
Insulin and HOMA‐IR levels across the ALS‐FTD spectrum. (a) Insulin and (b) HOMA‐IR results *P < 0.05, **P < 0.01, ***P < 0.001.
Predictive linear regression models and correlations
In a model combining all study participants with the following predictors – age, NPY, ACE score, insulin, and leptin – and disease duration as the outcome variable, NPY (F = 4.2, P = 0.002) (β = −0.284, P = 0.01) emerged as a significant predictor of disease duration; specifically, higher NPY levels predicted a shorter disease duration and explained 30% of the score variance. Age was also a predictor of disease duration (β = 0.297, P = 0.007). Insulin, leptin, and ACE‐R scores did not contribute significantly to this model. A separate model to identify predictors of eating behavior, NPY was also found to be a significant predictor of total CBI eating behavior (F = 5.1, P < 0.001) (β = −0.295, P = 0.028), along with ACE‐R scores (β = −0.319, P = 0.018), Insulin, leptin, and age did not contribute significantly to this model. Additional correlational analyses showed that decreasing NPY levels correlated with increasing abnormal eating behavior (CBI eating total score) (r s = −0.478, P < 0.001), increased BMI levels (r s = −0.285, P = 0.005), and increasing disease duration (r s = −0.352, P = 0.001). In contrast, NPY levels were not correlated with age (r s = −0.001, P = 0.991) or total caloric intake (r s = 0.057, P = 0.540).
Leptin, as expected, was a significant predictor of BMI (F = 8.5, P < 0.001) (β = 0.539, P < 0.001) that is, increased leptin levels were associated with increased BMI, and correlated positively with BMI in post hoc comparisons (r s = 0.620, P < 0.001). Although not predictive, increased serum insulin levels also correlated with increased BMI (r s = 532, P < 0.001). There were no correlations between leptin or insulin and eating behavior scores or disease duration.
In a model of predictors (age, NPY, insulin, leptin) of cognition (ACE‐R scores) (F = 6.7, P < 0.001), NPY (β = 0.242, P = 0.01) and leptin (β = −0.389, P < 0.001) were predictors of cognitive change. In post hoc comparisons, there was a positive correlation between NPY levels and ACE‐R scores (r s = 0.221, P = 0.01), and a negative correlation between leptin and ACE‐ R scores (r s = −0.226, P = 0.01). Increased serum insulin levels correlated with decreased ACE‐R scores (r s = −0.231, P = 0.01).
Discussion
Across the ALS‐FTD spectrum, changes in the peripheral levels of certain eating peptides (NPY and leptin) differentiate between ALS and FTD and normal controls. All patient groups (ALS, ALS‐cognitive and bvFTD) exhibited elevated levels of leptin, insulin, and a state of insulin resistance as measured by the HOMA‐IR score compared to the control group, supporting their role in peripheral metabolism (Fig. 3). In contrast, peripheral NPY levels not only correlated with eating behavior but also with cognitive and behavioral scores and disease duration, suggesting a more central role in the underlying neurodegeneration. Peripheral NPY levels were increased in ALS and ALS‐cognitive compared to controls, but decreased in bvFTD, and on mutinomial logistic regression were found to predict diagnosis between ALS, ALS‐cognitive and bvFTD, and between bvFTD and controls. Overall, these data show that NPY levels could be harnessed to assist with monitoring and potentially treating the underlying disease, while leptin and/or insulin are relevant for metabolic status.
Figure 3.
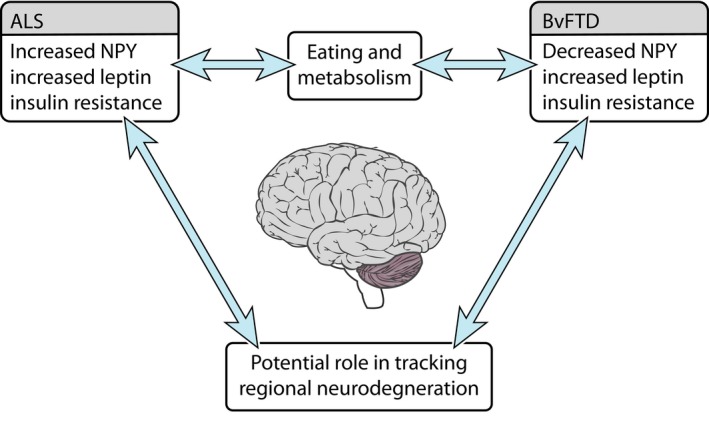
Eating neuropeptide changes along the ALS‐FTD. Neuropeptide changes likely reflect an interaction between eating behavior and metabolism and neurodegeneration. These changes offer the potential to track regional neurodegeneration. ALS, Amyotrophic lateral sclerosis; bvFTD, behavioral variant frontotemporal dementia.
Involvement of the hypothalamus appears central to any change in eating peptides and metabolism.28 The hypothalamus is increasingly recognized as potentially responsible for changes in eating behavior in ALS and FTD and hence metabolic status. Previous studies have shown that hypothalamic atrophy is present in both ALS13 and FTD12, 29 and that in bvFTD there are increased agouti related peptide (AgRP) levels which could potentially stimulate abnormal eating behavior.12 AgRP is found in the appetite stimulating pathway of the hypothalamus where AgRP and NPY containing neurons in the arcuate nucleus (ARC) are targeted by circulating ghrelin to stimulate appetite and eating behavior. In this setting, NPY is a potent orexigenic peptide and plays a significant role in eating behavior‐stimulation of NPY neurons in the arcuate nuclei by fasting or energy loss leads to increased food intake and suppression of energy expenditure.30 NPY is also found in the peripheral nervous system and adrenal gland.30 As adrenalectomy does not significantly affect peripheral NPY levels31 and there is some correlation between CSF NPY levels and plasma NPY levels,32 it is thought that peripheral NPY levels have a neural origin. To date, changes in the peripheral NPY levels across the ALS‐FTD were unknown.
Our data strongly support a role for NPY not only in eating behavior, but also in differentiating and targeting the disease process to particular brain systems and networks initially involved in the ALS‐FTD spectrum of disorders. Regression analyses revealed that NPY levels were predictive of diagnosis and also correlated with disease duration (increased levels associated with shorter disease duration). Peripheral NPY levels were increased in ALS and ALS‐cognitive compared to controls and decreased in bvFTD patients compared to controls, ALS and ALS‐cognitive patients. NPY levels were further predictive of eating behavior (increased NPY associated with less abnormal eating behavior as measured on the CBI eating total score) and of cognition (lower NPY predicted lower ACE‐R scores). There was no correlation between total caloric intake and NPY levels. These results suggest that NPY levels may be reflective of overall energy stores, rather than just caloric intake, with ALS known to be associated with decreased energy stores, despite similar caloric intake to controls, potentially leading to an almost “starved state” increasing NPY levels. In bvFTD patients have increased energy consumption and stores10 potentially decreasing NPY levels. The data from the current study showing that NPY levels correlated to clinical phenotype and disease duration suggest that NPY levels may offer potential to track neurodegenerative disease type and progression. Similar findings using CSF NPY levels have been observed in Alzheimer's disease and bvFTD,33 with the previous suggestion that NPY levels could offer potential as a trackable biomarker.
The strong predictive correlations of NPY levels to core diagnostic clinical features in addition to their reflection of eating behavior, supports a role in the underlying pattern of neurodegeneration. In ALS, NPY has been hypothesized to contribute to neuronal activity in the motor cortex of the brain, with ALS mouse models showing decreased NPY interneurons at symptom onset, but increased NPY interneurons by end stage disease.34 Interneurons are believed to contribute to cortical hyperexcitability, a core feature of ALS pathogenesis.35 The increased levels of NPY in ALS seen in the current study, that decreases with disease duration, could potentially be explained by levels increasing to overcome a paucity of NPY interneurons early in the disease that changes with disease progression. Further studies are required to investigate the relationship between serum NPY levels, NPY interneurons and cortical excitability longitudinally along the ALS‐FTD spectrum.
In contrast to NPY, peripheral leptin from adipocytes is important in the hypothalamic appetite suppressing pathway36 and correlates with body fat stores.37 In the current study, all patient groups demonstrated elevated leptin levels. The current study showed a strong correlation with BMI, suggesting that the increased levels seen in the bvFTD group are likely related to increased BMI and subsequent fat stores related to abnormal eating behavior. The increased levels in the ALS group seems counterintuitive, as the ALS group was matched to the control group for BMI. Previous studies in ALS have shown that increased leptin levels are associated with a lower risk of ALS in large population studies, and once patients develop ALS higher leptin levels are associated with an improved survival.38 It is plausible that these findings are related to fat stores and not simply just BMI. This hypothesis is further suggested by studies showing increased abdominal fat deposition in ALS, with a positive effect on survival,39 and anecdotally patients often complain of abdominal fat deposition despite low or normal BMI. Further investigation is required to ascertain if increased leptin levels in ALS may be a reflection of changes in adipocyte deposition, through measures of body composition. Studies are also required to ascertain whether leptin is simply a marker of changes in body composition or potentially the underlying neurodegenerative process. A recent study in a SOD‐1 animal model of ALS reported improved survival in leptin deficient mice. This finding was hypothesized to be due to improved caloric intake and reduced energy consumption that is, improved energy stores.40 Further studies are required to ascertain whether this survival benefit in animal models is due to increased food consumption and fat deposition which is seen in leptin deficient humans, and has been shown to improve survival in humans with ALS.39, 41
Our findings suggest that both NPY and leptin levels may be markers of cognitive change in ALS, with changing (increased leptin, decreased NPY) levels as patients develop cognitive deficits as measured by the ACE‐R. As both eating peptides are involved, it could be that NPY plays a more central mediating role in the neurodegenerative process while leptin relates to fat storage as patients develop eating behavior change which worsens with cognitive involvement.11 It is widely accepted that bvFTD patients have a longer survival than ALS patients,42 and leptin has been hypothesized to potentially improve survival in ALS by increasing lipolysis and hence energy stores, and by a potential neuroprotective effect.43 It is plausible that leptin may have similar effects in bvFTD.
Abnormal eating behavior has been related to the development of a state of insulin resistance,44 although there has been much debate in ALS over the presence of insulin resistance and its effect on disease progression and survival. In the present study, increased insulin levels and insulin resistance were present in the ALS and bvFTD groups. There is some suggestion that insulin resistance may act as a protective factor in ALS.45, 46, 47 Whilst insulin levels correlated with BMI, they were highest in the ALS group which had the lowest BMI (matched to the control subjects). This suggests that whilst insulin levels may be somewhat related to BMI, there are other factors at play potentially related to the neurodegenerative process. Further studies are required to ascertain how insulin levels change the underlying pathology in ALS and FTD and influence survival.
The current study has shown that peripheral levels of NPY are predictive of diagnosis and disease duration of different ALS‐FTD phenotypes, and as such may be important biomarkers for tracking underlying disease and metabolic indices. We highlight the potential role of NPY as a potential marker of central neurodegenerative processes, while leptin may be related to fat stores and insulin to underlying metabolic status. Further studies are required to ascertain the relationship between peripheral NPY, insulin and leptin levels and central CSF levels and their effect on underlying pathology. The current study is potentially limited by the small sample size and lack of follow‐up data. Further investigation is required through longitudinal studies to validate whether these peptides are prognostic for disease progression or different disease stages, and/or for metabolic changes and whether changes are present presymptomatically. Currently, the heterogeneity of disease progression48 in the ALS‐ FTD spectrum is not well understood. Markers that could potentially predict a patient's progression (i.e., fast vs. slow progressors) are urgently needed. Potentially, markers of metabolism may address this issue, given the relationship between eating behavior, lipids and survival.41 Larger longitudinal studies in both ALS and FTD cohorts are also required to enable within‐group analyses of slow and fast progressors in terms of metabolism and eating peptides including NPY and leptin. Pathological studies, animal model studies and eventually clinical trials modifying metabolic factors and eating behavior are also crucial to disentangle whether these peptides are markers of or pathogenic drivers of neurodegeneration.
Conflict of Interest
No author reports a conflict of interest.
Author Contributions
Rebekah Ahmed: study concept, data analysis, manuscript preparation, and writing. Katherine Phan: data analysis, manuscript preparation, and writing. Elizabeth Highton‐ Williamson: data analysis, manuscript preparation and writing. Cherie Strikwerda‐ Brown: data analysis, manuscript preparation, and writing. Jashelle Caga: data analysis, manuscript preparation, and writing. Eleanor Ramsey: data analysis, manuscript preparation, and writing. Margie Zoing: data analysis, manuscript preparation, and writing. Emma Devenney: data analysis, manuscript preparation, and writing. Woojin Kim: data analysis, manuscript preparation, and writing. John: Hodges: data analysis, manuscript preparation, and writing. Olivier Piguet: data analysis, manuscript preparation, and writing. Glenda Halliday: study concept, data analysis, manuscript preparation, and writing. Matthew Kiernan: study concept, data analysis, manuscript preparation, and writing.
Acknowledgments
This work was supported in part by funding to Forefront, a collaborative research group dedicated to the study of frontotemporal dementia and motor neurone disease, from the National Health and Medical Research Council of Australia (NHMRC) program grant (#1037746 to GH, MK and JH) and the Australian Research Council Centre of Excellence in Cognition and its Disorders Memory Program (#CE110001021 to OP and JRH) and other grants/sources (NHMRC project grant #1003139 to OP), Royal Australasian College of Physicians and MND Research Institute of Australia. We are grateful to the research participants involved with the ForeFront research studies. RA is a NHMRC Early Career Fellow (#1120770). GH is a NHMRC Senior Principal Research Fellow (#1079679). OP is an NHMRC Senior Research Fellow (#1103258).
Funding Information
This work was supported in part by funding to Forefront, a collaborative research group dedicated to the study of frontotemporal dementia and motor neurone disease, from the National Health and Medical Research Council of Australia (NHMRC) program grant (#1037746 to GH, MK and JH) and the Australian Research Council Centre of Excellence in Cognition and its Disorders Memory Program (#CE110001021 to OP and JRH) and other grants/sources (NHMRC project grant #1003139 to OP), Royal Australasian College of Physicians and MND Research Institute of Australia. We are grateful to the research participants involved with the ForeFront research studies. RA is a NHMRC Early Career Fellow (#1120770). GH is a NHMRC Senior Principal Research Fellow (#1079679). OP is an NHMRC Senior Research Fellow (#1103258).
Funding Statement
This work was funded by National Health and Medical Research Council of Australia (NHMRC) grants 1037746 and 1003139; MND Research Institute of Australia grant ; Australian Research Council Centre of Excellence in Cognition and its Disorders Memory Program grant CE110001021; NHMRC Early Career Fellow grant 1120770; NHMRC Senior Principal Research Fellow grant 1079679; NHMRC Senior Research Fellow grant 1103258.
References
- 1. Burrell JR, Halliday GM, Kril JJ, et al. The frontotemporal dementia‐motor neuron disease continuum. Lancet 2016;389:919–931. [DOI] [PubMed] [Google Scholar]
- 2. Hardiman O, van den Berg LH, Kiernan MC. Clinical diagnosis and management of amyotrophic lateral sclerosis. Nat Rev Neurol 2011;7:639–649. [DOI] [PubMed] [Google Scholar]
- 3. Kiernan MC, Vucic S, Cheah BC, et al. Amyotrophic lateral sclerosis. Lancet 2011;377:942–955. [DOI] [PubMed] [Google Scholar]
- 4. Vucic S, Rothstein JD, Kiernan MC. Advances in treating amyotrophic lateral sclerosis: insights from pathophysiological studies. Trends Neurosci 2014;37:433–442. [DOI] [PubMed] [Google Scholar]
- 5. Ahmed RM, Irish M, Piguet O, et al. Amyotrophic lateral sclerosis and frontotemporal dementia: distinct and overlapping changes in eating behaviour and metabolism. Lancet Neurol 2016a;15:332–342. [DOI] [PubMed] [Google Scholar]
- 6. Ahmed RM, Dupuis L, Kiernan MC. Paradox of amyotrophic lateral sclerosis and energy metabolism. J Neurol Neurosurg Psychiatry 2018a;89:1013–1014. [DOI] [PubMed] [Google Scholar]
- 7. Ahmed RM, Caga J, Devenney E, et al. Cognition and eating behavior in amyotrophic lateral sclerosis: effect on survival. J Neurol 2016b;263:1593–1603. [DOI] [PubMed] [Google Scholar]
- 8. Steyn FJ, Ioannides ZA, van Eijk RPA, et al. Hypermetabolism in ALS is associated with greater functional decline and shorter survival. J Neurol Neurosurg Psychiatry 2018;89:1016–1023. [DOI] [PMC free article] [PubMed] [Google Scholar]
- 9. Kasarskis EJ, Mendiondo MS, Matthews DE, et al. Estimating daily energy expenditure in individuals with amyotrophic lateral sclerosis. Am J Clin Nutri 2014;99:792–803. [DOI] [PMC free article] [PubMed] [Google Scholar]
- 10. Ahmed RM, Irish M, Henning E, et al. Assessment of eating behavior disturbance and associated neural networks in frontotemporal dementia. JAMA Neurol 2016c;73:282–290. [DOI] [PubMed] [Google Scholar]
- 11. Ahmed RM, Irish M, Kam J, et al. Quantifying the eating abnormalities in frontotemporal dementia. JAMA Neurol 2014a;71:1540–1546. [DOI] [PubMed] [Google Scholar]
- 12. Ahmed RM, Latheef S, Bartley L, et al. Eating behavior in frontotemporal dementia: peripheral hormones vs hypothalamic pathology. Neurology 2015;85:1310–1317. [DOI] [PMC free article] [PubMed] [Google Scholar]
- 13. Gorges M, Vercruysse P, Muller HP, et al. Hypothalamic atrophy is related to body mass index and age at onset in amyotrophic lateral sclerosis. J Neurol Neurosurg Psychiatry 2017;88:1033–1041. [DOI] [PubMed] [Google Scholar]
- 14. EFNS Task Force on Diagnosis and Management of Amyotrophic Lateral Sclerosis , Andersen PM, Abrahams S, et al. EFNS guidelines on the clinical management of amyotrophic lateral sclerosis (MALS)–revised report of an EFNS task force. Eur J Neurol 2012;19:360–375. [DOI] [PubMed] [Google Scholar]
- 15. Strong MJ. The syndromes of frontotemporal dysfunction in amyotrophic lateral sclerosis. Amyotrophic Lateral Scler 2008;9:323–338. [DOI] [PubMed] [Google Scholar]
- 16. Rascovsky K, Hodges JR, Knopman D, et al. Sensitivity of revised diagnostic criteria for the behavioural variant of frontotemporal dementia. Brain 2011;134:2456–2477. [DOI] [PMC free article] [PubMed] [Google Scholar]
- 17. Kaufmann P, Levy G, Thompson JL, et al. The ALSFRSr predicts survival time in an ALS clinic population. Neurology 2005;64:38–43. [DOI] [PubMed] [Google Scholar]
- 18. Mioshi E, Caga J, Lillo P, et al. Neuropsychiatric changes precede classic motor symptoms in ALS and do not affect survival. Neurology 2014;82:149–155. [DOI] [PubMed] [Google Scholar]
- 19. Mioshi E, Lillo P, Yew B, et al. Cortical atrophy in ALS is critically associated with neuropsychiatric and cognitive changes. Neurology 2013;80:1117–1123. [DOI] [PubMed] [Google Scholar]
- 20. Strong MJ, Abrahams S, Goldstein LH, et al. Amyotrophic lateral sclerosis ‐ frontotemporal spectrum disorder (ALS‐FTSD): revised diagnostic criteria. Amyotroph Lateral Scler Frontotemporal Degener 2017;18:153–174. [DOI] [PMC free article] [PubMed] [Google Scholar]
- 21. Wedderburn C, Wear H, Brown J, et al. The utility of the Cambridge Behavioural Inventory in neurodegenerative disease. J Neurol Neurosurg Psychiatry 2008;79:500–503. [DOI] [PubMed] [Google Scholar]
- 22. Lillo P, Mioshi E, Zoing MC, et al. How common are behavioural changes in amyotrophic lateral sclerosis? Amyotrophic Lateral Scler 2011;12:45–51. [DOI] [PubMed] [Google Scholar]
- 23. Lillo P, Savage S, Mioshi E, et al. Amyotrophic lateral sclerosis and frontotemporal dementia: a behavioural and cognitive continuum. Amyotrophic Lateral Scler 2012;13:102–109. [DOI] [PubMed] [Google Scholar]
- 24. Mioshi E, Dawson K, Mitchell J, et al. The Addenbrooke's Cognitive Examination Revised (ACE‐R): a brief cognitive test battery for dementia screening. Int J Geriatr Psychiatry 2006;21:1078–1085. [DOI] [PubMed] [Google Scholar]
- 25. Ikeda M, Brown J, Holland AJ, et al. Changes in appetite, food preference, and eating habits in frontotemporal dementia and Alzheimer's disease. J Neurol Neurosurg Psychiatry 2002;73:371–376. [DOI] [PMC free article] [PubMed] [Google Scholar]
- 26. Soriguer F, Colomo N, Valdes S, et al. Modifications of the homeostasis model assessment of insulin resistance index with age. Acta Diabetol 2014;51:917–925. [DOI] [PubMed] [Google Scholar]
- 27. Mathews GJ, Bloom SD, Fuller GM, et al. Shell model calculation for the 71 Ga(nu, e‐)71Ge solar neutrino detector. Phys Rev C: Nucl Phys 1985;32:796–804. [DOI] [PubMed] [Google Scholar]
- 28. Coll AP, Farooqi IS, O'Rahilly S. The hormonal control of food intake. Cell 2007;129:251–262. [DOI] [PMC free article] [PubMed] [Google Scholar]
- 29. Piguet O, Petersen A, YinKaLam B, et al. Eating and hypothalamus changes in behavioral‐variant frontotemporal dementia. Ann Neurol 2011;69:312–319. [DOI] [PMC free article] [PubMed] [Google Scholar]
- 30. Mercer RE, Chee MJ, Colmers WF. The role of NPY in hypothalamic mediated food intake. Front Neuroendocrinol 2011;32:398–415. [DOI] [PubMed] [Google Scholar]
- 31. Renshaw D, Hinson JP. Neuropeptide Y and the adrenal gland: a review. Peptides 2001;22:429–438. [DOI] [PubMed] [Google Scholar]
- 32. Baker DG, Bertram TM, Patel PM, et al. Characterization of cerebrospinal fluid (CSF) and plasma NPY levels in normal volunteers over a 24‐h timeframe. Psychoneuroendocrinology 2013;38:2378–2382. [DOI] [PubMed] [Google Scholar]
- 33. Edvinsson L, Minthon L, Ekman R, et al. Neuropeptides in cerebrospinal fluid of patients with Alzheimer's disease and dementia with frontotemporal lobe degeneration. Dementia 1993;4:167–171. [DOI] [PubMed] [Google Scholar]
- 34. Clark RM, Blizzard CA, Young KM, et al. Calretinin and Neuropeptide Y interneurons are differentially altered in the motor cortex of the SOD1(G93A) mouse model of ALS. Sci Rep 2017;7:44461. [DOI] [PMC free article] [PubMed] [Google Scholar]
- 35. Vucic S, Nicholson GA, Kiernan MC. Cortical hyperexcitability may precede the onset of familial amyotrophic lateral sclerosis. Brain 2008;131:1540–1550. [DOI] [PubMed] [Google Scholar]
- 36. Farooqi IS, Bullmore E, Keogh J, et al. Leptin regulates striatal regions and human eating behavior. Science 2007;317:1355. [DOI] [PMC free article] [PubMed] [Google Scholar]
- 37. Harris RB. Direct and indirect effects of leptin on adipocyte metabolism. Biochem Biophys Acta 2014;1842:414–423. [DOI] [PMC free article] [PubMed] [Google Scholar]
- 38. Nagel G, Peter RS, Rosenbohm A, et al. Adipokines, C‐reactive protein and Amyotrophic Lateral Sclerosis ‐ results from a population‐ based ALS registry in Germany. Sci Rep 2017;7:4374. [DOI] [PMC free article] [PubMed] [Google Scholar]
- 39. Lindauer E, Dupuis L, Muller HP, et al. Adipose tissue distribution predicts survival in amyotrophic lateral sclerosis. PLoS ONE 2013;8:e67783. [DOI] [PMC free article] [PubMed] [Google Scholar]
- 40. Lim MA, Bence KK, Sandesara I, et al. Genetically altering organismal metabolism by leptin‐deficiency benefits a mouse model of amyotrophic lateral sclerosis. Hum Mol Genet 2014;23:4995–5008. [DOI] [PMC free article] [PubMed] [Google Scholar]
- 41. Ahmed RM, Highton‐Williamson E, Caga J, et al. Lipid metabolism and survival across the frontotemporal dementia‐amyotrophic lateral sclerosis spectrum: relationships to eating behavior and cognition. J Alzheimers Dis 2018b;61:773–783. [DOI] [PubMed] [Google Scholar]
- 42. Hodges JR, Davies R, Xuereb J, et al. Survival in frontotemporal dementia. Neurology 2003;61:349–354. [DOI] [PubMed] [Google Scholar]
- 43. de Candia P, Matarese G. Leptin and ghrelin: sewing metabolism onto neurodegeneration. Neuropharmacology 2017;136:307–316. [DOI] [PubMed] [Google Scholar]
- 44. Ahmed RM, MacMillan M, Bartley L, et al. Systemic metabolism in frontotemporal dementia. Neurology 2014b;83:1812–1818. [DOI] [PubMed] [Google Scholar]
- 45. Paganoni S, Hyman T, Shui A, et al. Pre‐morbid type 2 diabetes mellitus is not a prognostic factor in amyotrophic lateral sclerosis. Muscle Nerve 2015;52:339–343. [DOI] [PMC free article] [PubMed] [Google Scholar]
- 46. Mariosa D, Kamel F, Bellocco R, et al. Association between diabetes and amyotrophic lateral sclerosis in Sweden. Eur J Neurol 2015;22:1436–1442. [DOI] [PMC free article] [PubMed] [Google Scholar]
- 47. Jawaid A, Salamone AR, Strutt AM, et al. ALS disease onset may occur later in patients with pre‐morbid diabetes mellitus. Eur J Neurol 2010;17:733–739. [DOI] [PubMed] [Google Scholar]
- 48. Gomeni R, Fava M; Pooled Resource Open‐Access . ALSCTC amyotrophic lateral sclerosis disease progression model. Amyotroph Lateral Scler Frontotemporal Degener 2014;15:119–129. [DOI] [PubMed] [Google Scholar]