Abstract
Background
Subarachnoid hemorrhage (SAH) survivors experience significant neurological disability, some of which is under‐recognized by neurovascular clinical teams. We set out to objectively determine the occurrence of hearing impairment after SAH, characterize its peripheral and/or central origin, and investigate likely pathological correlates.
Methods
In a case‐control study (n = 41), participants were asked about new onset hearing difficulty 3 months post‐SAH, compared with pre‐SAH. Formal audiological assessment included otoscopy, pure tone audiometry, a questionnaire identifying symptoms of peripheral hearing loss and/or auditory processing disorder, and a test of speech understanding in noise. A separate cohort (n = 21) underwent quantitative susceptibility mapping (QSM) of the auditory cortex 6 months after SAH, for correlation with hearing difficulty.
Results
Twenty three percent of SAH patients reported hearing difficulty that was new in onset post‐SAH. SAH patients had poorer pure tone thresholds compared to controls. The proportion of patients with peripheral hearing loss as defined by the World Health Organization and British Audiological Society was however not increased, compared to controls. All SAH patients experienced symptoms of auditory processing disorder post‐SAH, with speech‐in‐noise test scores significantly worse versus controls. Iron deposition in the auditory cortex was higher in patients reporting hearing difficulty versus those who did not.
Conclusion
This study firmly establishes hearing impairment as a frequent clinical feature after SAH. It primarily consists of an auditory processing disorder, mechanistically linked to iron deposition in the auditory cortex. Neurovascular teams should inquire about hearing, and refer SAH patients for audiological assessment and management.
Introduction
Subarachnoid hemorrhage (SAH) survivors experience significantly reduced quality of life which is not well reflected by conventional clinical outcome measures such as the modified Rankin Scale (mRS) or Glasgow Outcome Score (GOS). This “hidden” disability is the topic of increasing research and is probably multifactorial, for example arising from cognitive deficits1 and post‐traumatic stress disorder.2 Hearing impairment, whether it is of peripheral and/or central origin, may be another mediator of poor outcome. During development of a SAH‐specific clinical outcome tool,3 which involved sessions with SAH patient focus groups, we noted a high prevalence (21.4%) of new onset subjective hearing difficulty post‐SAH. In a retrospective analysis of prospectively collected data from 277 SAH patients, Vos et al. investigated the prevalence and risk factors of subjective hearing difficulty after SAH,4 concluding that subjectively reported hearing difficulty occurs in 1 of every 5 SAH patients.
Hearing difficulty may be peripheral in nature (i.e., present as a decline in hearing acuity on an audiogram) or central (i.e., typically a normal pure tone audiogram but increased difficulty with hearing in noise and processing speech). The latter category is known as auditory processing disorder (APD).5 While an audiogram provides information around the detection of pure tone (i.e., hearing sensitivity) it does not provide information about real world signals such as speech perception, particularly in less favorable listening environments. APD has its origins in impaired neural function, which includes both the afferent and efferent pathways of the central auditory nervous system (CANS), as well as other neural processing systems that provide ‘top down’ modulation of the CANS.5 These other systems include, but are not limited to the cognitive functions of language, speech, attention, executive function, memory and emotion. APD is often found alongside and may contribute to primary disorders of those systems, and may thus include both auditory and cognitive elements.5 Individuals with APD typically present with listening difficulties and other behaviors consistent with hearing loss, despite a normal audiogram. These behaviors include greater difficulty with hearing when there is background noise (the most common complaint), mishearing speech, and frequent requests for repetition.5 A number of pathologies such as early brain injury, vasospasm, vascular injury, and iron deposition occurring after SAH have potential to affect peripheral and central auditory systems including the cochlea, vestibulocochlear nerves, brainstem nuclei, and higher areas of the CANS.
The British Society of Audiology differentiates between three categories of APD5: (1) developmental APD (presenting in childhood); (2) acquired APD (associated with aging or a known post‐natal event, such as an infection or neurological trauma, e.g., SAH); and (3) secondary APD (where APD occurs in the presence, or as a result, of peripheral hearing loss).
We hypothesized that (i) hearing impairment occurs after SAH, more than one would expect in a control population of similar age and gender, (ii) hearing impairment after SAH is multifactorial, including peripheral hearing loss and central APD. To address these hypotheses, we performed a prospective study of SAH patients and controls, with detailed objective audiological assessment, in order to better understand and quantify the hearing difficulties reported by SAH patients.
Methods
Definitions
In this manuscript we use the term hearing loss to define diminished hearing on an audiogram, APD to define hearing difficulty of central origin, hearing impairment to define both hearing loss and APD, and hearing difficulty for the subjective report of decreased hearing by participants.
Cohort 1: audiological study
This was a prospective case‐control study of hearing impairment after SAH, recruiting patients from a neurovascular specialist nurse follow‐up clinic for SAH patients treated by endovascular coiling (surgically clipped patients were followed‐up in a surgical clinic), 3 months post‐ictus. Control participants were recruited by advertisement in the University and Hospital. For SAH and control participants, inclusion criteria were age greater than 18 years and English language proficiency, while exclusion criteria consisted of otological abnormalities, exposure to loud noise in the previous 24 h, and conductive hearing loss, as defined by an air bone gap >12 dB (two standard deviations from normative data6, 7, 8). For SAH participants, an additional inclusion criterion was a post‐ictal interval of at least 3 months after aneurysmal or non‐aneurysmal atraumatic SAH. The study was conducted under National Research Ethics Committee Approval (LREC ref: 12/SC/0666, for SAH patients) and institutional approval (ERGO ref: 17752, for control participants).
For new onset hearing difficulty, patients were asked whether they noticed a change in hearing subsequent to the SAH. Formal audiological assessment included otoscopy, pure tone audiometry, a questionnaire identifying symptoms of peripheral hearing loss and/or APD and a speech‐in‐noise test.
Since there are currently no validated APD adult questionnaires,5 one was adapted from the Children's Auditory Performance Scale9 for the purposes of this study, and consisted of 20 questions (Table S1). The questionnaire took the participant's otological history and enquired about otological and hearing impairment, comparing before to after SAH. Specifically, it covered hearing in the presence of competing noise, hearing in a quiet environment, auditory memory sequencing, localization, difficulty using a telephone, mishearing of words and hyperacusis, pre‐ and post‐SAH. The sum of responses to APD questions was converted to a percentage, and used as an ecological or real life report (i.e., subjective measure) of APD, before and after SAH.
Otoscopy (Heine Mini 3000) and pure tone audiometry (PTA) (Kamplex AD 27, TDH headphones, B27 bone transducer with Radioear P3333 headband) were carried out in accordance with British Society of Audiology (BSA) recommendations.10 Hearing loss was defined according to BSA criteria10 (mean threshold at 0.25, 0.5, 1, 2 and 4 kHz is >20 dB in any ear) and World Health Organization (WHO) criteria11 (mean threshold at 0.5, 1, 2 and 4 kHz is >25 dB in better ear).
The fixed noise Bamford‐Kowal‐Bench (BKB) test was used as a speech‐in‐noise test.12 It was administered using Sennheiser HAD 300 headphones and a laptop with BKB test material. The test comprised of recorded sentences presented against a background of noise (multi‐speaker babble) with a fixed level of −10 dB signal‐to‐noise ratio. The intensity level of the recorded sentences was set at each participant's most comfortable level to accommodate for differences in peripheral hearing thresholds. To minimize interference from cognitive deficits, a pre‐requisite was that participants were able to correctly repeat BKB sentences in quiet, that is, the absence of competing noise. Each BKB sentence was scored based on correctly repeated keywords, culminating in the overall percentage score of correct answers.
SAH severity at presentation was assessed by the World Federation of Neurosurgical Societies (WFNS) grade,13 overall SAH bleed size was assessed by the modified Fisher scale,14 and disability at 3 months was assessed by the mRS15 and GOS.16, 17 Delayed ischemic neurological deficit (DIND) was defined as the occurrence of hemiparesis, dysphasia, a new focal deficit 72 h post‐SAH or a GCS drop of 2 or more not attributable to other causes.18 Transcranial Doppler flow was measured through both middle cerebral arteries (MCA) at periodic intervals during admission; the maximal blood flow was recorded and a threshold of 200 cm/second was used to define severe vasospasm.19
The extent of blood clot present in the Sylvian fissure on the admission computed tomography imaging was scored visually (using a visual analog score as follows: 0 for no blood clot, and 1, 2, and 3 for partial filling, complete filling, and dilation of the Sylvian fissure with blood respectively) and measured by its maximum thickness in millimeters in the posterior limb (in cases where blood was present in both Sylvian fissures, the worst side was considered). The two variables were highly correlated (Spearman r = 0.86, P < 10−11) and gave the same results in all analyzes. The presence of blood around the vestibulocochlear nerves was recorded, as either present or absent, and whether symmetrical or asymmetrical, and in the case of the latter, which side had most blood clot.
Cohort 2: susceptibility‐weighted imaging study
A separate group of 21 SAH patients who had previously been recruited to develop a new SAH‐specific outcome tool and map deficits against location of iron deposition underwent susceptibility‐weighted magnetic resonance imaging (MRI) of the brain 6 months after ictus. They are not the same patients as in Cohort 1. On the day of imaging they were asked whether they had experienced a change in their hearing after SAH, compared to before SAH, during completion of a SAH outcome tool.3 They were also asked about their handedness to determine hemisphere dominance. Three‐dimensional susceptibility‐weighted image (SWI) datasets were acquired axially on a 1.5 Tesla Siemens Symphony MRI scanner (Siemens Healthcare AG, Erlangen, Germany) with radiofrequency spoiling and flow compensation in all three orthogonal gradient directions (TR = 50 msec, TE=40 msec, flip angle = 12°, resolution = 1.3 × 0.9 × 2.0 mm3). In addition an isotropic three‐dimensional structural T1‐weighted image was acquired (TR = 2200 msec, TE = 2.88 msec, flip angle = 12°, resolution=1.2 × 1.2 × 1.2 mm). SWI images were processed using the software package SPIN (Signal Processing in NMR, SpinTech, Detroit, MI, USA) to generate susceptibility‐weighted imaging and mapping (SWIM) volumes for quantitative susceptibility mapping (QSM) (examples in Fig. 1). All subsequent image processing was performed in FMRIB Software Library (FSL).20 Structural T1 was brain extracted using BET.21 Structural T1 and SWIM volumes were registered to the Montreal Neurological Institute (MNI) standard space, using FMRIB's non‐linear image registration tool.22 A gray matter T1 mask was produced using FAST23 and susceptibility was quantified in the gray matter of Heschl's gyrus, planum polare, and planum temporale using the Harvard‐Oxford cortical atlas.24 A priori, a voxel was considered to have detectable iron signal if its susceptibility value was greater than two standard deviations above the signal in white matter as calculated using a series of 10 age and gender‐matched control patients undergoing follow‐up of non‐ruptured aneurysms or aneurysm screening, on the same scanner. Blood clot volume on the admission CT was quantified using MIPAV (Medical Image Processing, Imaging and Visualization) v7.2. The CT image signal intensity threshold was set between 50 and 80 Hounsfield units, and converted to a binary mask. Regions of interest representing blood clot were drawn manually on each slice, and summed into single three‐dimensional volumes.
Figure 1.
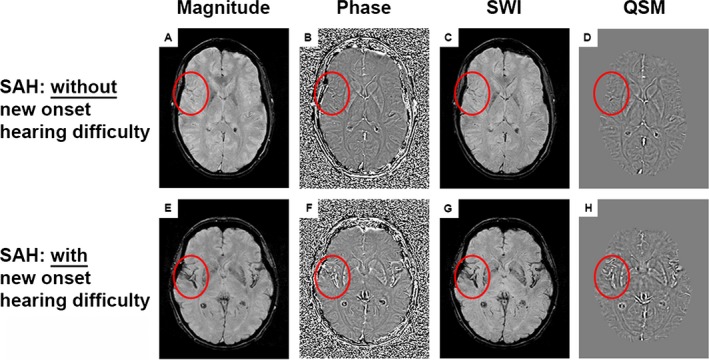
Susceptibility weighted imaging and mapping. (A and E) magnitude images; (B and F) filtered phase images; (C and G) susceptibility‐weighted images (SWI); (D and H) quantitative susceptibility maps (QSM). (A–D) SAH patient without new onset hearing difficulty. (E–H) SAH patient with new onset hearing difficulty. Iron deposition can be observed in multiple locations as high signal intensity on the QSM image (such as within the red border, which encircles the Sylvian fissure and auditory cortex).
Statistical analysis
Statistical analysis was conducted in SPSS v23. Group comparisons were performed with Student's t test for parametric data (age and BKB score), Wilcoxon's test for paired non‐parametric data (APD questionnaire scores), and Mann‐Whitney's test for unpaired non‐parametric data (QSM). Cross‐tabulated data were analyzed with the Fisher exact test (gender, hearing loss, lateralization of hearing loss, and blood). Analysis of covariance (ANCOVA) was used to correct for the effect of age on BKB score and PTA thresholds. Linear regression was used to explore predictors of APD and BKB scores. Logistic regression was used to explore predictors of sensorineural hearing loss. To investigate the role of hearing loss as a mediator in the causation of APD, regression‐based mediation analysis25 was performed using the regression path analysis modeling tool PROCESS,26, 27 with age as covariate. Significance for the indirect effect was tested using bootstrapping (n = 5000) with 95% intervals. Effect size was calculated and reported as percent mediation. Alpha was 0.05.
Results
Patient characteristics of Cohorts 1 and 2
The demographics and clinical features for participants in Cohorts 1 and 2 are shown in Table 1. Cohort 1 consisted of 41 SAH patients and 19 control participants. One SAH patient with conductive hearing loss was excluded, and one SAH patient withdrew half‐way through the assessment, resulting in 39 SAH patients and 19 controls meeting the inclusion criteria. Controls were similar in age and gender (P > 0.05, t‐test and Fisher exact test respectively). Cohort 2 consisted of 21 SAH patients.
Table 1.
Participant characteristics
| Study 1 | Study 2 | |||
|---|---|---|---|---|
| SAH | Control | P | SAH | |
| Number | 39 | 19 | 21 | |
| Age (years)a | 59, 35–79 | 57, 26–76 | NSc | 57, 30–76 |
| Modified Fisher gradeb | ||||
| 0 | 2, 5% | |||
| 1 | 7, 18% | |||
| 2 | 8, 21% | |||
| 3 | 9, 23% | 9, 43% | ||
| 4 | 13, 33% | 12, 57% | ||
| WFNS gradeb | ||||
| 1 | 23, 59% | 14, 67% | ||
| 2 | 6, 15% | 6, 29% | ||
| 3 | 1, 3% | |||
| 4 | 6, 15% | 1, 5% | ||
| 5 | 3, 8% | |||
| mRS at 3 months post‐SAHb | ||||
| 0 | 4, 10% | 4, 19% | ||
| 1 | 23, 59% | 16, 76% | ||
| 2 | 9, 23% | 1, 5% | ||
| 3 | 2, 5% | |||
| 4 | 1, 3% | |||
| GOS at 3 months post‐SAHb | ||||
| 3 | 1, 3% | 5, 24% | ||
| 4 | 5, 13% | 6, 29% | ||
| 5 | 33, 84% | 10, 48% | ||
| Genderb | ||||
| Male | 13, 33% | 6, 32% | NSd | 3, 14% |
| Female | 26, 67% | 13, 68% | 18, 86% | |
| Interventionb | ||||
| Coiled | 31, 79% | 21, 100% | ||
| Clipped | 0, 0% | 0, 0% | ||
| No aneurysm identified | 8, 21% | |||
| Aneurysm locationb | ||||
| Anterior | 25, 64% | 17, 81% | ||
| Posterior | 6, 15% | 4, 19% | ||
| No aneurysm identified | 8, 21% | |||
Mean and rangea, number and %b, c t test, dFisher exact test, NS = P > 0.05. WFNS = World Federation of Neurosurgical Societies grade; mRS = modified Rankin Scale; GOS = Glasgow Outcome Score.
Cohort 1: auditory processing disorder
Patients were assessed at 3 months post‐SAH. Twent‐three percent of SAH patients reported a new hearing difficulty after SAH, compared to before SAH. When asked specifically about symptoms suggestive of APD, using the questionnaire, all SAH patients reported a change, comparing before SAH with 3 months after SAH. Wilcoxon paired testing revealed a significant difference between the APD questionnaire scores before and after SAH (P = 0.0002, Fig. 2, median scores were 94 before SAH (IQR 12) and 81 after SAH (IQR 25), out of 100). BKB testing revealed a significant difference in BKB scores between patients and controls (P = 0.007, Fig. 3, means of percentage correct were 61% ± 10% and 34% ± 19%), which was retained in an ANCOVA after correction for age. To see which factors predicted APD after SAH as measured by the BKB test, stepwise linear regression were conducted including age, gender, WFNS, Fisher, aneurysmal status, aneurysmal Rx, and Sylvian blood clot thickness. Only age was a significant predictor of the BKB score (r 2 = 0.38, beta = −0.62, P < 0.001). The addition of DIND (available in 30 patients) or vasospasm (as maximal MCA blood flow or as a binary variable, available in 31 patients) did not affect the findings. There was no significant difference in Sylvian blood clot thickness between patients who experienced new onset hearing difficulty versus those who did not (P = 0.84, t‐test).
Figure 2.
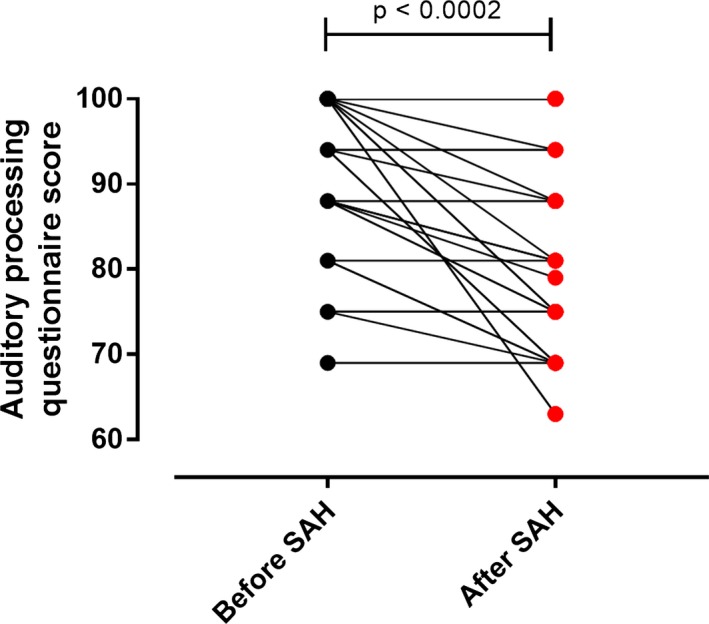
Hearing and auditory processing questionnaire. Lines connect APD questionnaire scores of individual patients before and after SAH. Wilcoxon test.
Figure 3.
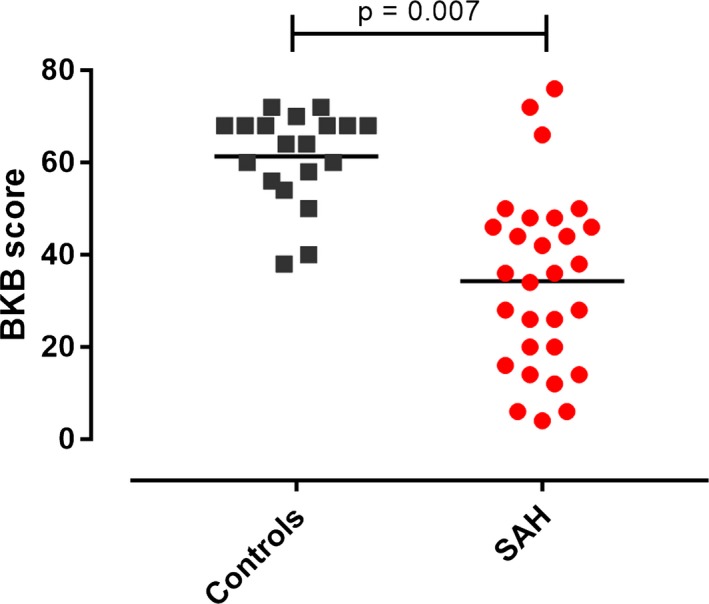
Speech‐in‐noise (Bamford‐Kowal‐Bench, BKB) test scores. The BKB score was the percentage of correct answers, Student t test.
Both right and left PTA mean thresholds were poorer in patients versus controls, correcting for age (7.6 decibels increase in right PTA, P = 0.024; 10.3 decibels increase in left PTA, P = 0.003; ANCOVA; Fig. 4). To see which factors predicted PTA mean threshold after SAH, stepwise linear regression was conducted including age, gender, WFNS, Fisher, aneurysmal status, aneurysmal Rx, and blood clot around the vestibulocochlear nerve: only age was a significant predictor of mean PTA threshold (r 2=0.33, beta = 0.57, P < 0.001). The addition of DIND (available in 30 patients) or vasospasm (as maximal MCA blood flow or as a binary variable, available in 31 patients) did not affect the findings.
Figure 4.
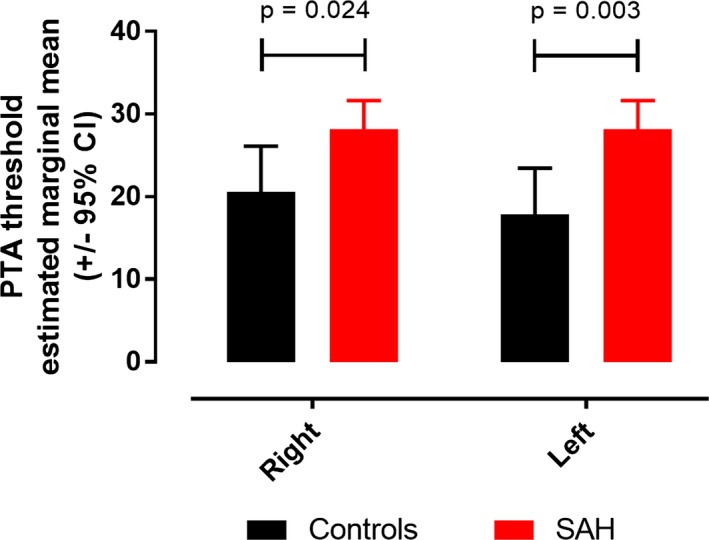
Pure tone audiogram. ANCOVA estimated marginal means for right and left pure tone audiogram mean thresholds.
APD may be acquired (associated with a known post‐natal event, such as an infection or neurological trauma, e.g., SAH) or secondary (occurring in the presence, or as a result, of peripheral hearing loss). Since both APD and peripheral deficits were noted after SAH (Figs. 2, 3, 4), we next assessed whether mean PTA threshold was contributing to APD. Mediation analysis is a mathematical technique to assess whether a predictor (in this case SAH) affects a dependent variable (in this case APD as assessed by BKB score, assuming this variable represents APD severity) indirectly through an intervening variable, or mediator (in this case mean PTA threshold). Age was included as a covariate in view of its effect on both BKB and mean PTA threshold. The total and direct effects of SAH on BKB were highly significant (Fig. 5). Mean PTA threshold had a minor, narrowly significant, effect on BKB, accounting for 11% of the total effect of SAH on BKB.
Figure 5.
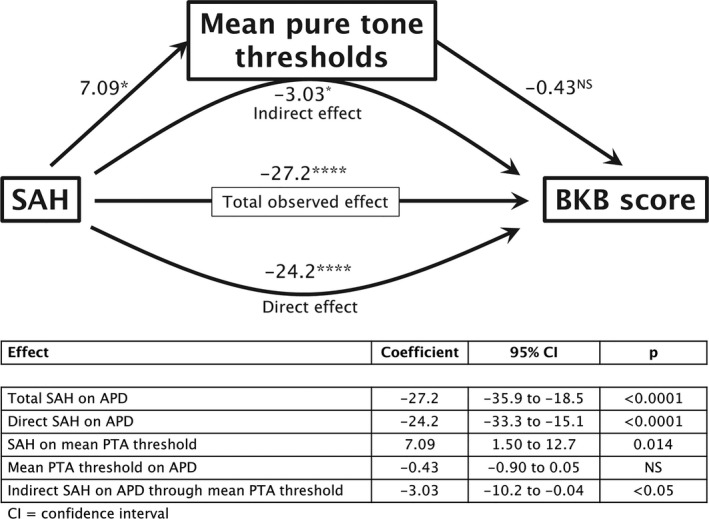
Regression‐based mediation analysis: path diagram. A positive coefficient is indicative of poorer hearing when mean PTA threshold (peripheral hearing deficit) is the outcome, while a negative coefficient is indicative of poorer hearing when BKB score (APD) is the outcome. NS = P > 0.05, * = P < 0.05, **** = P < 0.0001
Cohort 2: iron deposition in the auditory cortex
Iron is deposited in the outer layers of the cortex after SAH.28, 29 In a separate cohort of 21 SAH patients, SWI was performed 6 months after ictus; patients were asked whether they had experienced a change in their hearing after SAH, compared to before the SAH as part of their assessment with the recently‐described SAH outcome tool.3 The QSM results from SWIM were used to derive a relative measure of iron deposition in the auditory cortex, in patients with and without hearing difficulty, as shown in Figure 6A–C. All SAH patients had detectable iron signal in the auditory cortex, but this was more striking in those who experienced hearing difficulty (Fig. 6G–I) versus those who did not (Fig. 6D–F). In the nondominant hemisphere, iron content in the auditory cortex was higher in patients with hearing difficulty (Fig. 7A). This difference was more significant in the secondary auditory cortex (planum polare and planum temporale) than in the primary auditory cortex (Heschl's gyrus). There was no difference in auditory cortex iron content in the dominant hemisphere (Fig. 7B).
Figure 6.
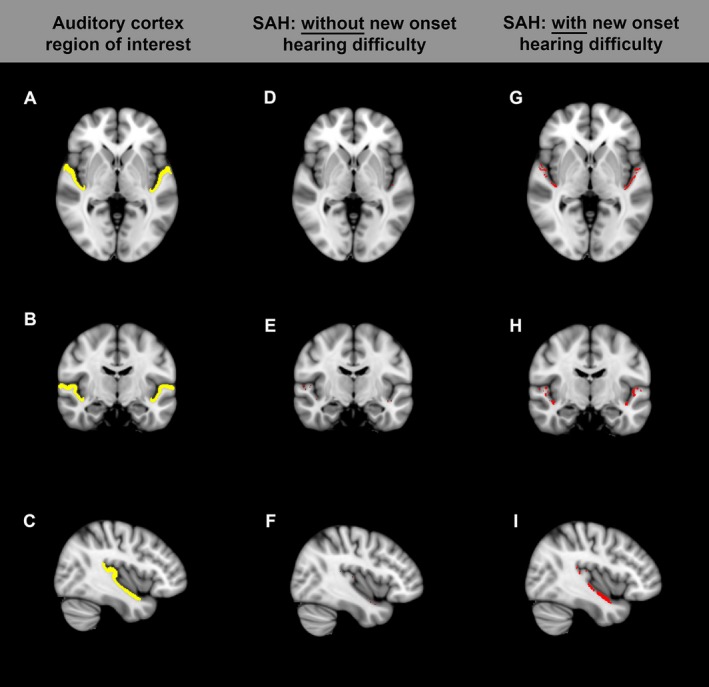
Auditory cortex region of interest (yellow in A–C). (D–F) SAH patient without hearing difficulty. (G–I) SAH patient with hearing difficulty. Red denotes voxels in the auditory cortex region of interest with detectable iron signal.
Figure 7.
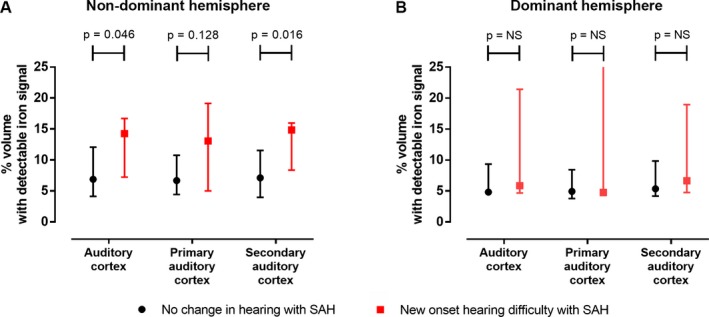
Quantitative susceptibility mapping. Medians (and interquartile range), Mann–Whitney test.
Discussion
This controlled prospective study with objective audiological assessment firmly establishes hearing impairment, and more specifically APD, as a common clinical feature after SAH. Subjective evidence is reported by 20–25% of patients if simply asked about a new onset worsening in hearing with the SAH. Although around 25% of 40–70 year old people in the general population (UK Biobank study) report hearing difficulty,30 it is important to note that both in our study and the preceding one,4 the hearing difficulty reported by 20–25% was new onset in nature, that is, presented only after SAH. If questioned specifically about symptoms in keeping with APD, all patients in our study reported the onset of such symptoms after their SAH. Given the high prevalence of new hearing difficulty after SAH, affecting 20–25% of SAH patients, it is surprising how this clinical feature has so far been overlooked. The most likely explanation is that since SAH patients suffer from a multitude of neurological, cognitive, and psychosocial deficits, hearing impairment has received less attention. There is currently no validated APD adult questionnaire5 which makes it difficult for the clinician to quantify and make decisions around onward referral and management. It is possible that hearing impairment contributes to the impact of SAH on patients’ daily functioning, since hearing deficit affects quality of life.31 In addition there is a reciprocal relationship between hearing difficulty and cognitive performance,32 which may amplify the impact of both. Further studies are needed to assess the impact of this common symptom on quality of life after SAH, and the relationship with cognitive decline. APD may include both auditory and cognitive elements.5 The high co‐occurrence of APD with language, attention, memory, and executive difficulties underscores the importance of a multi‐faceted approach.5
One cannot rely only on subjective questioning about hearing impairment since this may be influenced by recall and other subjective factors. Objective testing revealed marked evidence of hearing impairment after SAH, compared to a control group of similar age and gender. Hearing impairment may be either peripheral or central in origin. There was no difference in hearing loss as defined by BSA or WHO thresholds between patients and controls, but mean PTA thresholds were significantly poorer in SAH patients versus controls (i.e., lower responses to quieter sound levels). All participants reported new onset symptoms of APD post‐SAH when questioned, and this was objectively confirmed in 59% of patients, who had BKB scores below the reference range. Mean PTA threshold had a minor, narrowly significant, effect on APD, accounting for 11% of the total effect of SAH on APD.
Auditory processing deficit: mechanisms
The underlying pathological mechanism underlying the occurrence of APD post‐SAH is probably multifactorial, possibly including hypoxia, mechanical stretching, bystander damage from inflammation and neurotoxicity from extracellular hemoglobin and iron deposition. In this study hearing difficulty was associated with iron deposition in the auditory cortex. This is keeping with the previous finding that hearing difficulty was more likely to be associated with aneurysms of the middle cerebral artery, which supplies the superior aspect of the temporal lobe.4 The location of the auditory cortex in the Sylvian fissure could potentially increase susceptibility to pathology resulting from trapping of blood clot, hemoglobin and inflammatory cells in the fissure.
The side with maximum blood clot on the admission CT corresponded to the side with maximum iron deposition 6 months later (Table S2). While thickness of blood clot in the Sylvian fissure on the admission CT did not correlate with objective hearing impairment 3 months after SAH, iron content in the auditory cortex 6 months post‐SAH correlated with hearing difficulty. It is important to note that these two observations were made in two different study populations. There may be a threshold of blood clot volume above which iron deposition is seen. Also, one may speculate that the volume of blood clot and local deposition of iron within this region are not tightly linked, and factors other than the volume of Sylvian blood clot play a more important role in determining iron deposition in the auditory cortex 6 months later. Such factors may include the way blood settles after SAH, local cerebrospinal fluid dynamics, efficiency of clot resolution, and host inflammatory response.
Iron deposition in the non‐dominant auditory cortex was associated with hearing difficulty, while iron deposition in the dominant auditory cortex was not. The most likely explanation for this is the fact that in patients with hearing difficulty, the blood clot was randomly more deposited on the non‐dominant side, and the same was found for iron deposition (Table S2). Another potential, but unlikely, explanation is that there are differences between right and left auditory cortices with respect to susceptibility to blood clot or iron deposition and associated neurotoxicity. Heschl's gyrus is smaller on the non‐dominant side33 and this may theoretically provide easier access to blood during SAH, though the difference is likely to be minor and non‐consequential. It is also highly unlikely that the non‐dominant auditory cortex impacts on auditory function after SAH at the exclusion of the dominant side. Both auditory cortices contribute to the perception of sound. Magnetoencephalography suggests that speech is not predominantly processed in the left hemisphere as traditionally thought, but instead engages cortical areas bilaterally with marked right hemispheric involvement.34 There is multiple evidence supporting the concept of asymmetric speech parsing between the two cortices, such that different components of speech are analyzed in parallel, similar to a dual‐core processor on a computer.35 There appear to be two main specializations, which are linked. Firstly, the left auditory cortex responds better to rapidly modulated speech content, while right temporal cortex responds better to slowly modulated signals.36 Plosive consonants need fast processing while fricative, affricate, nasal, and liquid consonants, as well as vowels are longer in duration. Slowly modulation is important for discriminating syllables and in a wider sense appreciating different voices, prosody in speech and music. Secondly (and consequent to the first), the left auditory cortex has a higher temporal resolution, while the right auditory cortex is better at resolving spectral information since time is permitting.37 Spectral information (pitch37 and frequency modulation direction38), is another important determinant in perception of sound, with relevance to sentence type, prosody in speech and music.
Peripheral hearing deficit: mechanisms
The underlying pathological mechanism underlying the occurrence of the peripheral hearing deficit after SAH is also probably multifactorial. It is tempting to draw parallels with superficial siderosis,39 where chronic bleeding and iron deposition around the vestibulocochlear nerve results in a peripheral hearing problem. We did not find evidence for an association between blood clot around the eighth nerve and deficits in hearing thresholds, so it is likely that diffusion of blood products plays a more important role than apposition of blood clot. Other potential mechanisms include stretching of the vestibulocochlear nerve or damage to its nuclei and connections in the brainstem.
Implications for clinical management
It is important to ask about hearing difficulty after SAH in neurovascular follow‐up clinics, and at the very least, symptomatic patients should be referred for audiological assessment. Peripheral hearing loss is an indication for hearing aid prescription, and is associated with a cost‐effective improvement in quality of life.40, 41 Assistive listening devices, designed specifically for people with normal hearing can also be used to treat APD, since critical speech elements are preserved and masking by background noise and reverberation are minimized. Long‐term benefits of such systems have mostly been investigated in children,42, 43, 44 but have recently started to be applied in stroke.45, 46 Current intervention strategies can be divided into three main categories, namely (1) modifying the listening environment (architectural interventions and acoustic treatments, i.e., adding soft furnishings, noise absorbent partitions/screens, and assistive listening devices), (2) auditory training (computer and non‐computer based) and (3) compensatory strategies (metacognitive and meta‐linguistic strategies).5 Strategies modifying the listening environment have the highest evidence base.5 A number of auditory training strategies may be used to treat symptoms of APD, though none have been subjected to rigorous assessment in a randomized controlled setting.47 Finally cognitive assessment of SAH patients in both research and clinical settings should be preceded by formal audiological testing, since over‐diagnosis of cognitive dysfunction may occur in the presence of hearing difficulty.32
Strengths and limitations
This study has several strengths including the presence of a control group of similar age and gender, the use of objective measures of hearing difficulty, assessment of both peripheral and central components, and the availability of QSM measures of iron deposition. The study provides definitive evidence of hearing impairment after SAH and establishes that most of this is related to APD. It suggests that the pathological substrate is iron deposition in the secondary auditory cortex.
Limitations include the small sample size, the absence of clipped patients and the bias toward patients with better outcome. There is currently no validated APD questionnaire available for adults. The in‐house questionnaire used for APD is not validated. APD may overlap with cognitive deficits, which were not formally assessed; however we only proceeded to perform BKB testing if the participants could repeat the BKB sentences in quiet. APD may arise due to lesions at several points in the central auditory pathway, including the brainstem (cochlear nuclei, superior olivary complex, and inferior colliculus), the thalamus (medial geniculate nucleus),48 the auditory cortex and its dorsal and ventral projection streams.49 Brainstem‐sensitive electrophysiological data (auditory brainstem responses and stapedial acoustic reflex thresholds) were not available. SWI artifact and resolution precluded detailed imaging study of the medial geniculate nucleus. Finally, tissue magnetic susceptibility may be related to other factors besides the quantity of iron in the tissue. Examples include an increase in the proportion of venous blood content and tissue oxygen extraction fraction (which would result in a higher concentration of paramagnetic deoxyhemoglobin), changes in tissue microstructure which may alter the magnetic behavior of iron‐containing particles, and changes in diamagnetic calcium and myelin content.50 Hence the linear relationship between QSM‐derived and laboratory assays of iron in cadaveric brain51 may break down in pathological conditions such as SAH.
Future directions
Hearing assessment and APD screen are recommended for patients post‐SAH during follow‐up. Reduced concentration and fatigue are common attributes post‐SAH, and since many SAH patients tend to have a low tolerance for lengthy assessments, further research is warranted to develop an optimal audiological test battery. Also needed is an evaluation of higher order functions, known to play a role in auditory processing. The high co‐occurrence of APD with language, attention, memory, and executive difficulties5 underscores the importance of an integrated and multi‐faceted approach in assessing and managing the difficulties reported by SAH patients. Finally, a pragmatic randomized controlled trial of auditory screening and intervention after SAH is warranted.
Author Contributions
N.C., C.V., L.F., D.B., and I.G. contributed to the conception and design of the study; all authors contributed to different aspects of data acquisition; S.M., O.M., L.D., H.T., R.S, and I.G. analyzed the data; N.C. wrote the first draft of the manuscript; C.V., A.D., M.E.H., D.B, and I.G. contributed to the manuscript's revision; all authors approved the final version of the manuscript.
Conflict of Interest
Nothing to report.
Supporting information
Table S1. Otological/hearing history and auditory processing disorder (APD) questionnaire.
Table S2. Asymmetry of blood clot and iron deposition in the SAH population of the SWI study.
Acknowledgment
The authors thank the University of Southampton for funding, and the study participants for their time and dedication.
Funding Information
The authors thank the University of Southampton for funding, and the study participants for their time and dedication.
Funding Statement
This work was funded by University of Southampton grant .
References
- 1. Kreiter KT, Copeland D, Bernardini GL, et al. Predictors of cognitive dysfunction after subarachnoid hemorrhage. Stroke 2002;33:200–208. [DOI] [PubMed] [Google Scholar]
- 2. Visser‐Meily JM, Rinkel GJ, Vergouwen MD, et al. Post‐traumatic stress disorder in patients 3 years after aneurysmal subarachnoid haemorrhage. Cerebrovasc Dis 2013;36:126–130. [DOI] [PubMed] [Google Scholar]
- 3. Pace A, Mitchell S, Casselden E, et al. A subarachnoid haemorrhage‐specific outcome tool. Brain 2018;141:1111–1121. [DOI] [PubMed] [Google Scholar]
- 4. Vos EM, Greebe P, Visser‐Meily JMA, et al. Subjective hearing impairment after subarachnoid haemorrhage: prevalence and risk factors. J Neurol Sci 2017;15:184–186. [DOI] [PubMed] [Google Scholar]
- 5. British Society of Audiology (BSA). Auditory processing disorder special interest group. [Internet]. Bathgate, UK: BSA, 2018. https://www.thebsa.org.uk/wp-content/uploads/2018/02/Position-Statement-and-Practice-Guidance-APD-2018.pdf. [Google Scholar]
- 6. Margolis RH, Wilson RH, Popelka GR, et al. Distribution characteristics of normal pure‐tone thresholds. Int J Audiol 2015;54:796–805. [DOI] [PMC free article] [PubMed] [Google Scholar]
- 7. Margolis RH, Wilson RH, Popelka GR, et al. Distribution characteristics of air‐bone gaps: evidence of bias in manual audiometry. Ear Hear 2016;37:177–188. [DOI] [PMC free article] [PubMed] [Google Scholar]
- 8. Studebaker GA. Intertest variability and the air‐bone gap. J Speech Hear Disord 1967;32:82–86. [DOI] [PubMed] [Google Scholar]
- 9. Smoski WJ, Brunt MA, Tannahill JC. Listening characteristics of children with central auditory processing disorders. Lang Speech Hear 1992;23:145–152. [Google Scholar]
- 10. British Society of Audiology (BSA). [Internet]. Bathgate, UK: BSA, 2011. http://www.thebsa.org.uk/wp-content/uploads/2014/04/BSA_RP_PTA_FINAL_24Sept11_MinorAmend06Feb12.pdf [Google Scholar]
- 11. World Health Organization (WHO). [Internet]. Geneva, Switzerland: WHO, 1991. http://apps.who.int/iris/bitstream/10665/58839/1/WHO_PDH_91.1.pdf. [Google Scholar]
- 12. Bench J, Kowal A, Bamford J. The BKB (Bamford‐Kowal‐Bench) sentence lists for partially‐hearing children. Br J Audiol 1979;13:108–112. [DOI] [PubMed] [Google Scholar]
- 13. Teasdale GM, Drake CG, Hunt W, et al. A universal subarachnoid hemorrhage scale: report of a committee of the World Federation of Neurosurgical Societies. J Neurol Neurosurg Psychiatry 1988;51:1457. [DOI] [PMC free article] [PubMed] [Google Scholar]
- 14. Frontera JA, Claassen J, Schmidt JM, et al. Prediction of symptomatic vasospasm after subarachnoid hemorrhage: the modified fisher scale. Neurosurgery 2006;59:21–27; discussion ‐7. [DOI] [PubMed] [Google Scholar]
- 15. Farrell B, Godwin J, Richards S, Warlow C. The United Kingdom transient ischaemic attack (UK‐TIA) aspirin trial: final results. J Neurol Neurosurg Psychiatry 1991;54:1044–1054. [DOI] [PMC free article] [PubMed] [Google Scholar]
- 16. Jennett B, Snoek J, Bond MR, Brooks N. Disability after severe head injury: observations on the use of the Glasgow Outcome Scale. J Neurol Neurosurg Psychiatry 1981;44:285–293. [DOI] [PMC free article] [PubMed] [Google Scholar]
- 17. Wilson JT, Pettigrew LE, Teasdale GM. Structured interviews for the Glasgow Outcome Scale and the extended Glasgow Outcome Scale: guidelines for their use. J Neurotrauma 1998;15:573–585. [DOI] [PubMed] [Google Scholar]
- 18. Vergouwen MD, Vermeulen M, van Gijn J, et al. Definition of delayed cerebral ischemia after aneurysmal subarachnoid hemorrhage as an outcome event in clinical trials and observational studies: proposal of a multidisciplinary research group. Stroke 2010;41:2391–2395. [DOI] [PubMed] [Google Scholar]
- 19. Vora YY, Suarez‐Almazor M, Steinke DE, et al. Role of transcranial Doppler monitoring in the diagnosis of cerebral vasospasm after subarachnoid hemorrhage. Neurosurgery 1999;44:1237–1247; discussion 47‐8. [PubMed] [Google Scholar]
- 20. Smith SM, Jenkinson M, Woolrich MW, et al. Advances in functional and structural MR image analysis and implementation as FSL. NeuroImage 2004;23:S208–S219. [DOI] [PubMed] [Google Scholar]
- 21. Smith SM. Fast robust automated brain extraction. Hum Brain Mapp 2002;17:143–155. [DOI] [PMC free article] [PubMed] [Google Scholar]
- 22. FMRIB . Oxford centre for functional MRI of the brain (FMRIB). [Internet]. Oxford: FMRIB, 2004. https://fsl.fmrib.ox.ac.uk/fsl/fslwiki/FNIRT. [Google Scholar]
- 23. Zhang YY, Brady M, Smith S. Segmentation of brain MR images through a hidden Markov random field model and the expectation‐maximization algorithm. IEEE T Med Imaging 2001;20:45–57. [DOI] [PubMed] [Google Scholar]
- 24. Desikan RS, Ségonne F, Fischl B, et al. An automated labeling system for subdividing the human cerebral cortex on MRI scans into gyral based regions of interest. NeuroImage 2006;31:968–980. [DOI] [PubMed] [Google Scholar]
- 25. Preacher KJ, Hayes AF. Asymptotic and resampling strategies for assessing and comparing indirect effects in multiple mediator models. Behav Res Methods 2008;40:879–891. [DOI] [PubMed] [Google Scholar]
- 26. Hayes AF. Introduction to mediation, moderation, and conditional process analysis : a regression‐based approach, 2nd ed New York, USA: Guilford Press, 2018. [Google Scholar]
- 27. Hayes AF. [Internet]. Columbus, Ohio: Hayes AF, 2018. http://www.processmacro.org/index.html. [Google Scholar]
- 28. Lee JY, Keep RF, He Y, et al. Hemoglobin and iron handling in brain after subarachnoid hemorrhage and the effect of deferoxamine on early brain injury. J Cereb Blood Flow Metab 2010;30:1793–1803. [DOI] [PMC free article] [PubMed] [Google Scholar]
- 29. Garland P, Durnford AJ, Okemefuna AI, et al. Heme‐hemopexin scavenging is active in the brain and associates with outcome after subarachnoid hemorrhage. Stroke 2016;47:872–876. [DOI] [PubMed] [Google Scholar]
- 30. Rönnberg J, Hygge S, Keidser G, Rudner M. The effect of functional hearing loss and age on long‐ and short‐term visuospatial memory: evidence from the UK biobank resource. Front Aging Neurosci 2014;6:326. [DOI] [PMC free article] [PubMed] [Google Scholar]
- 31. Chia E‐M, Wang JJ, Rochtchina E, et al. Hearing impairment and health‐related quality of life: the blue mountains hearing study. Ear Hear 2007;28:187–195. [DOI] [PubMed] [Google Scholar]
- 32. Fulton SE, Lister JJ, Bush ALH, et al. Mechanisms of the hearing–cognition relationship. Semin Hear 2015;36:140–149. [DOI] [PMC free article] [PubMed] [Google Scholar]
- 33. Schneider P, Sluming V, Roberts N, et al. Structural and functional asymmetry of lateral Heschl's gyrus reflects pitch perception preference. Nat Neurosci 2005;8:1241. [DOI] [PubMed] [Google Scholar]
- 34. Alexandrou AM, Saarinen T, Makela S, et al. The right hemisphere is highlighted in connected natural speech production and perception. NeuroImage 2017;15:628–638. [DOI] [PubMed] [Google Scholar]
- 35. Eggermont JJ, Wang X. Temporal coding in auditory cortex In: Winer JA, Schreiner CE, eds. The auditory cortex. pp. 309–328. Boston, MA: Springer US, 2011. [Google Scholar]
- 36. Poeppel D. The analysis of speech in different temporal integration windows: cerebral lateralization as ‘asymmetric sampling in time’. Speech Commun 2003;41:245–255. [Google Scholar]
- 37. Zatorre RJ, Belin P, Penhune VB. Structure and function of auditory cortex: music and speech. Trends Cogn Sci 2002;6:37–46. [DOI] [PubMed] [Google Scholar]
- 38. Brechmann A, Scheich H. Hemispheric shifts of sound representation in auditory cortex with conceptual listening. Cereb Cortex 2005;15 578–587. [DOI] [PubMed] [Google Scholar]
- 39. Koeppen AH, Michael SC, Li D, et al. The pathology of superficial siderosis of the central nervous system. Acta Neuropathol 2008;116:371. [DOI] [PubMed] [Google Scholar]
- 40. Davis A, Smith P, Ferguson M, et al. Acceptability, benefit and costs of early screening for hearing disability: a study of potential screening tests and models. Health Technol Assess 2007;11:1–294. [DOI] [PubMed] [Google Scholar]
- 41. Ferguson MA, Kitterick PT, Chong LY, et al. Hearing aids for mild to moderate hearing loss in adults. Cochrane Database Syst Rev 2017;9:CD012023. [DOI] [PMC free article] [PubMed] [Google Scholar]
- 42. Hanschmann H, Wiehe S, Müller‐Mazzotta J, Berger R. Sprachverständnis im Störgeräusch mit und ohne Frequenzmodulationsanlage. HNO 2010;58:674–679. [DOI] [PubMed] [Google Scholar]
- 43. Johnston KN, John AB, Kreisman NV, et al. Multiple benefits of personal FM system use by children with auditory processing disorder (APD). Int J Audiol 2009;48:371–383. [DOI] [PubMed] [Google Scholar]
- 44. Kuk F, Jackson A, Keenan D, Lau CC. Personal amplification for school‐age children with auditory processing disorders. J Am Acad Audiol 2008;19:465–480. [DOI] [PubMed] [Google Scholar]
- 45. Koohi N, Vickers D, Chandrashekar H, et al. Auditory rehabilitation after stroke: treatment of auditory processing disorders in stroke patients with personal frequency‐modulated (FM) systems. Disabil Rehabil 2017;39:586–593. [DOI] [PubMed] [Google Scholar]
- 46. Koohi N, Vickers D, Warren J, et al. Long‐term use benefits of personal frequency‐modulated systems for speech in noise perception in patients with stroke with auditory processing deficits: a non‐randomised controlled trial study. BMJ Open 2017;7:e013003. [DOI] [PMC free article] [PubMed] [Google Scholar]
- 47. British Society of Audiology (BSA). [Internet]. Bathgate, UK: BSA, 2011. http://www.thebsa.org.uk/wp-content/uploads/2011/04/Current-APD-Management-2.pdf. [Google Scholar]
- 48. Pickles JO. Chapter 1 ‐ auditory pathways: anatomy and physiology In: Aminoff MJ, Boller F, Swaab DF, eds. Handbook of clinical neurology: The human auditory system, Vol. 129. pp. 3–25. Amsterdam, The Netherlands: Elsevier, 2015. [DOI] [PubMed] [Google Scholar]
- 49. Hackett TA. Chapter 2 ‐ anatomic organization of the auditory cortex In: Aminoff MJ, Boller F, Swaab DF, eds. Handbook of clinical neurology: The human auditory system, Vol. 129. pp. 27–53. Amsterdam, The Netherlands: Elsevier, 2015. [DOI] [PubMed] [Google Scholar]
- 50. Duyn JH, Schenck J. Contributions to magnetic susceptibility of brain tissue. NMR Biomed 2017;30:1–2. [DOI] [PMC free article] [PubMed] [Google Scholar]
- 51. Zheng W, Nichol H, Liu S, et al. Measuring iron in the brain using quantitative susceptibility mapping and X‐ray fluorescence imaging. NeuroImage 2013;78:68–74. [DOI] [PMC free article] [PubMed] [Google Scholar]
Associated Data
This section collects any data citations, data availability statements, or supplementary materials included in this article.
Supplementary Materials
Table S1. Otological/hearing history and auditory processing disorder (APD) questionnaire.
Table S2. Asymmetry of blood clot and iron deposition in the SAH population of the SWI study.


