

Abstract
Objectives
We quantitatively examined the motor‐imagery ability in stroke patients using a bimanual circle‐line coordination task (BCT) and clarified the relationship between motor‐imagery ability and motor function of hemiplegic upper limbs and the level of use of paralyzed limbs.
Methods
We enrolled 31 stroke patients. Tasks included unimanual‐line (U‐L)—drawing straight lines on the nonparalyzed side; bimanual circle‐line (B‐CL)—drawing straight lines with the nonparalyzed limb while drawing circles with the paralyzed limb; and imagery circle‐line (I‐CL)—drawing straight lines on the nonparalyzed side during imagery drawing on the paralyzed side, using a tablet personal computer. We calculated the ovalization index (OI) and motor‐imagery ability (image OI). We used the Fugl–Meyer motor assessment (FMA), amount of use (AOU), and quality of motion (QOM) of the motor activity log (MAL) as the three variables for cluster analysis and performed mediation analysis.
Results
Clusters 1 (FMA <26 points) and 2 (FMA ≥26 points) were formed. In cluster 2, we found significant associations between image OI and FMA, AOU, and QOM. When AOU and QOM were mediated between image OI and FMA, we observed no significant direct association between image OI and FMA, and a significant indirect effect of AOU and QOM.
Interpretation
In stroke patients with moderate‐to‐mild movement disorder, image OI directly affects AOU of hemiplegic upper limbs and their QOM in daily life and indirectly influences the motor functions via those parameters.
Introduction
Poststroke hemiplegia suppresses motor output and sensory feedback, gradually shrinking the cerebral cortex area representing a paralyzed limb. Such neuroplasticity is believed to cause “learned nonuse,” wherein the brain learns not to use the affected limb.1 Continued inactivity and decreased movement results decreases gray matter motor‐related areas that had previously avoided damage, a factor correlating with upper limb motor dysfunction degree.2 Current rehabilitation medicine emphasizes the active use of paralyzed limbs soon after stroke onset. Use‐dependent plasticity is proven from both animal3 and clinical studies on stroke patients,4 thus aggressively adopting constraint‐induced movement therapy (CIMT) in rehabilitation medicine for upper limb hemiplegia.5
Fugl–Meyer motor assessment (FMA)‐upper extremity motor is part of an international assessment of upper limb impairment tests and is considered the standard for assessing upper limb motor paralysis.6, 7 However, motor activity log (MAL) is an assessment method specifically developed to overcome learned nonuse5 [subscales: the amount of use (AOU), amount of paralyzed upper limb use in daily life, and quality of movement (QOM), measuring how skillfully a paralyzed limb can be used in daily life]. High AOU scores indicate paralyzed limb use in daily life, whereas high QOM scores indicate good quality use (from patient perspective) of the paralyzed limb. Reportedly, CIMT contributes toward improving upper limb motor functions and frequency of use.8, 9, 10, 11 Moreover, the state of paralyzed limb use assessed by MAL and the motor functions of a paralyzed limb assessed by FMA are significantly associated.12
Taub et al., in various motor trials using paralyzed upper limbs, found that stroke patients experienced many failures, experiences that served as a punishment in a cognitive process‐suppressing behavior using the paralyzed limb. This process, they warned, could also lead to learned nonuse.1 While voluntary movement requires an intention to move on by the subjects, the learned nonuse model indicates damage to the motor imagery stored as intentions and memories relating to paralyzed limb use caused by continuous behavioral errors owing to motor paralysis. Ultimately, this may hinder upper limb motor‐function recovery.
In stroke‐associated upper limb paralysis, motor‐imagery tasks have been incorporated into clinical interventions to improve motor functions13, 14, 15, 16 and have proven efficacy.17, 18 While motor‐imagery tasks contribute to improving poststroke upper limb motor dysfunction, the mechanism whereby increased motor‐imagery ability contributes to improving motor functions remains unclear. Recently, reduced frequency of autonomous upper limb use has been shown to contribute to motor neglect, which has been linked to motor representation and image disappearance in the brain.19 Thus, upper limb motor representations and images may increase body use frequency. An increase in actual use may follow a dose‐dependent motor‐learning process promoting upper limb motor‐function recovery. On this basis, we hypothesized that the remaining motor‐imagery ability of a paralyzed upper limb could be used to increase limb use in daily life, thus contributing to limb's motor‐function recovery. This study aimed to verify the hypothesis that the motor‐imagery abilities of the paralyzed upper limbs of stroke patients, with MAL as a mediator, are linked indirectly with FMA.
Methods
Participants
In our multicenter, cross‐sectional study of stroke patients at four hospitals and one elderly care center, we followed the Declaration of Helsinki and clinical guidelines on medical research on human participants. We explained the study in advance to the participants orally and in writing and obtained their written consent. The Kio University ethics committee approved this study (approval No.: H27‐20).
We enrolled 58 stroke patients with upper limb motor paralysis contralateral to the damaged hemisphere. After excluding patients scoring <23 points (cutoff) on cognitive function test [mini‐mental state examination (MMSE); perfect score: 30 points],20 we analyzed 31 patients, including 16 with right and 15 with left hemisphere damage. All patients were right handed. We provided traditional rehabilitation medicine for all patients. The time since onset was 28–4528 days (mean disease duration: 1119 ± 1294 days). Table 1 shows participants’ characteristics and basic assessment results.
Table 1.
Characteristics of participants
| Participants | FMA | AOU | QOM | MMSE | The time since onset (day) | Cluster |
|---|---|---|---|---|---|---|
| 1 | 33 | 0.462 | 0.615 | 23 | 3176 | 2 |
| 2 | 13 | 0.083 | 0.083 | 29 | 2914 | 1 |
| 3 | 43 | 0.710 | 0.570 | 30 | 1221 | 2 |
| 4 | 44 | 3.500 | 2.643 | 27 | 2226 | 2 |
| 5 | 53 | 1.380 | 2.150 | 29 | 3246 | 2 |
| 6 | 55 | 3.400 | 3.600 | 30 | 51 | 2 |
| 7 | 63 | 4.930 | 4.640 | 30 | 423 | 2 |
| 8 | 28 | 0.070 | 0.070 | 27 | 432 | 2 |
| 9 | 8 | 0.000 | 0.000 | 25 | 135 | 1 |
| 10 | 8 | 0.000 | 0.000 | 26 | 389 | 1 |
| 11 | 15 | 0.000 | 0.000 | 26 | 1263 | 1 |
| 12 | 26 | 0.231 | 0.308 | 30 | 2876 | 2 |
| 13 | 31 | 0.750 | 0.500 | 30 | 44 | 2 |
| 14 | 61 | 4.000 | 3.833 | 29 | 785 | 2 |
| 15 | 62 | 2.460 | 1.620 | 26 | 28 | 2 |
| 16 | 64 | 4.500 | 4.300 | 27 | 98 | 2 |
| 17 | 42 | 0.660 | 0.750 | 30 | 672 | 2 |
| 18 | 4 | 0.167 | 0.167 | 25 | 4528 | 1 |
| 19 | 29 | 0.111 | 0.111 | 29 | 802 | 2 |
| 20 | 41 | 0.850 | 0.420 | 28 | 78 | 2 |
| 21 | 46 | 0.583 | 1.000 | 30 | 2660 | 2 |
| 22 | 60 | 1.720 | 1.360 | 29 | 79 | 2 |
| 23 | 41 | 0.840 | 0.690 | 28 | 180 | 2 |
| 24 | 47 | 0.692 | 0.538 | 26 | 74 | 2 |
| 25 | 8 | 0.000 | 0.000 | 26 | 70 | 1 |
| 26 | 18 | 0.231 | 0.154 | 25 | 2897 | 1 |
| 27 | 19 | 0.417 | 0.417 | 25 | 1936 | 1 |
| 28 | 20 | 0.000 | 0.000 | 29 | 1245 | 1 |
| 29 | 12 | 0.125 | 0.250 | 27 | 40 | 1 |
| 30 | 32 | 0.000 | 0.000 | 29 | 68 | 2 |
| 31 | 65 | 5.000 | 4.700 | 30 | 33 | 2 |
FMA, Fugl–Meyer motor assessment; AOU, Amount of use, QOM, Quality of motion; MMSE, mini‐mental state examination.
Bimanual coupling task
We employed bimanual coupling task (BCT), developed to quantitatively evaluate motion intention/image existence21 and initially used clinically in phantom limb patients.22 In BCT, using the healthy limb, the participant has to draw straight lines while simultaneously intending to draw circles with the affected limb. The degree to which the straight lines become elliptical is compared to that when the participant is not asked to draw circles and is used to obtain the “ovalization index” (OI), which assigns a quantitative value to the participant's motor‐image ability. In research on brain damaged patients with motor neglect of an upper limb on the affected side, when patients were asked to move the affected limb, the straight lines drawn by the healthy limb did not distort, confirming motor intention loss/decrease.19
An examiner explained the task to the participants, and they were allowed to practice it until they understood it. Subsequently, task was performed under following conditions (Fig. 1A). (1) As the control condition, using the nonparalyzed limb, the participants performed unimanual‐line drawing movements only (U‐L condition). For BCT, (2) while drawing straight lines with the nonparalyzed limb, they were asked to draw circles with the paralyzed limb (bimanual circle‐line (B‐CL) condition), and (3) they were asked not to move the paralyzed limb but imagine drawing circles with it (imaginary circle‐line (I‐CL) condition). During this, the participants sat in a chair at a desk. For the start posture, the nonparalyzed limb was placed on a tablet personal computer (PC) on the desk holding a stylus. At examiner's oral signal, they started drawing on the tablet PC, which recorded the trajectory of their motions. For all three conditions, the participants repeatedly drew straight lines on the tablet PC using the nonparalyzed limb. The paralyzed limb configuration varied depending on the condition. For the U‐L condition, the participants placed the paralyzed limb on the thigh and did not move it. For the B‐CL condition, we placed a pen in the paralyzed limb and asked them to draw circles on paper. We instructed patients with severe motor paralysis to try to move the limb; in some cases the joints did not actually move. For the I‐CL condition, we did not ask the participants to move the paralyzed limb, but rather to imagine performing the same movements as they had in the B‐CL condition.
Figure 1.
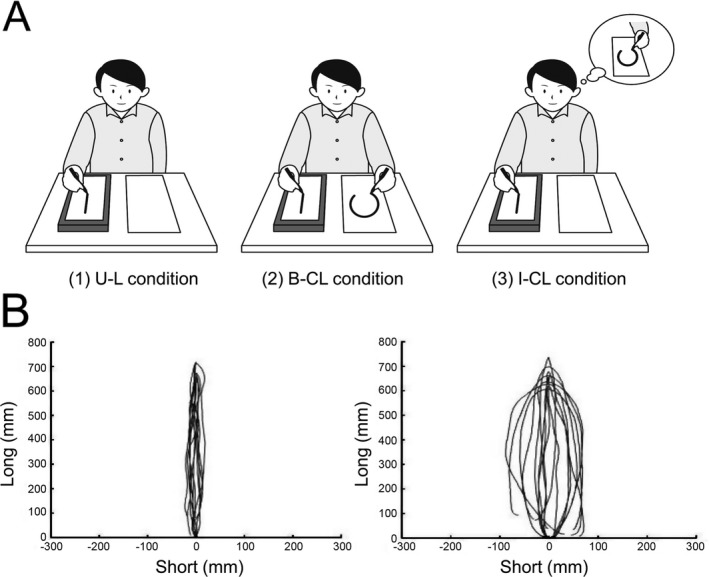
Bimanual coupling task and an example of a trajectory. (A) Participants performed in three conditions. (1) U‐L condition: participants performed unimanual‐line drawing movements only using the nonparalyzed limb as the control condition. (2) B‐CL condition: participants were asked to draw circles with the paralyzed limb while drawing straight lines with the nonparalyzed limb (bimanual circle‐line condition). (3) I‐CL condition: participants were asked not to move the paralyzed limb but instead to imagine drawing circles with it (imaginary circle‐line condition). For all three conditions, the participants repeatedly drew straight lines on the tablet personal computer using the nonparalyzed limb. (B) On the left side is an example of a trajectory in U‐L condition; on the right side is an example of a trajectory in I‐CL condition. The paralyzed limb's motor image ability was defined as the I‐CL condition OI value minus the U‐L condition OI value (image OI).
We placed no constraints on the speed/size with which the patients could draw the lines and circles. If a limb appeared to stop, we gave them an oral warning to ensure continuous movements. The patients performed three sets of 12 sec each for all three conditions in random order with their eyes closed and with 1‐min rest between each condition.
Calculation of ovalization index
We obtained an OI (%) of the lines drawn with the intact hand to quantify the distortion extent of intact‐hand line trajectories, according to previous studies.19, 23 We extracted respective circular figures from the recorded trajectories in each trial by identifying two apical endpoints of respective back‐and‐forth cycle trajectories. We established long and short axes for respective circular figures. We calculated an arbitrary variable from each cycle trajectory using the formula variable = [standard deviation of short‐axis data/standard deviation of long‐axis data] × 100. For each patient, we defined the OI as the mean value of the variables computed on all recorded cycle trajectories under respective conditions. An OI value of near 0 indicated no distortion of the trajectory toward a circular transfiguration and that of 100 indicated that the trajectory became a precise circle.
We subtracted the OI values from the U‐L and B‐CL/I‐CL condition to obtain the bimanual coupling effect (bimanual OI), as per the protocol described in a previous study.19, 23 The paralyzed limb's motor‐image ability was defined as the I‐CL condition OI value minus the U‐L condition OI value (image OI) (Fig. 1B).
Motor‐function evaluation
FMA‐upper extremity motor was used for paralyzed upper limb motor‐function evaluation.6 This scale has 33 items (overall score range, 0–66 points), assessing, through semi‐structured interviews with patients, the frequency and quality of paralyzed upper limb use in everyday life and the 14 movement items of MAL‐14 (e.g., “pick up a glass” and “put your arm through a sleeve”). For this subscale, the patient self‐evaluates paralyzed limb use frequency in everyday life/AOU and paralyzed limb's movement quality/QOM on six levels (0–5).24, 25 Here, we used the Japanese version and calculated mean values for each item based on a reported scoring method. Higher values indicated more skillful paralyzed limb use in everyday life.
Statistical analysis
We normalized the OI values under the three conditions using Shapiro–Wilk test, comparing them using one‐way repeated measures analysis of variance. We used a paired t‐test as a post hoc test, with Bonferroni method to correct P values.
Because MAL has a set floor effect in stroke patients,26 we performed hierarchical cluster analysis (Ward's method) using the three variables of FMA, AOU, and QOM to eliminate floor effect influence. Participants with floor effects were exploratorily extracted in advance with cluster analysis, using Ward's method, and were excluded from the mediation analysis. This was performed to clarify the relationship between motor‐imagery abilities and the frequency of body use and motor‐function recovery, which was the main objective of this study.
We examined FMA association with AOU and QOM in each cluster. Because AOU and QOM did not exhibit normality in clusters 1 and 2 using Shapiro–Wilk test (cluster 1: FMA‐W = 0.92, P = 0.09, AOU‐W = 0.83, P = 0.002, QOM‐W = 0.83, P = 0.002; cluster 2: FMA‐W = 0.93, P = 0.49, AOU‐W = 0.79, P = 0.01, QOM‐W = 0.80, P = 0.01), we used Spearman's rank association coefficient to analyze associations.
To verify our hypothesis, we created two mediation models (AOU and QOM model) to conduct mediation analysis. To test the significance of indirect effect in mediation analysis, we estimated the bootstrap method's 95% confidence intervals (CI) using the bootstrap bias correction technique (2,000 samples generated using nonparametric method).
We used R (ver. 3.2.2) for the comparisons, association analyses, and cluster analyses. We used HAD (ver. 14.8) for mediation analyses.27 We accepted the significance level at 5%.
Results
Comparison of OI values under three conditions
Multiple comparisons showed significantly higher OI value in both B‐CL and I‐CL conditions than that in the U‐L condition (postBonferroni correction, P < 0.00003 in both) (Fig. 2). We did not observe a significant difference between the B‐CL and I‐CL conditions (postBonferroni correction, P = 0.359). The bimanual OI was 3.67% ± 3.44%, and the image OI was 2.94% ± 3.33%, a nonsignificant difference (P = 0.24).
Figure 2.
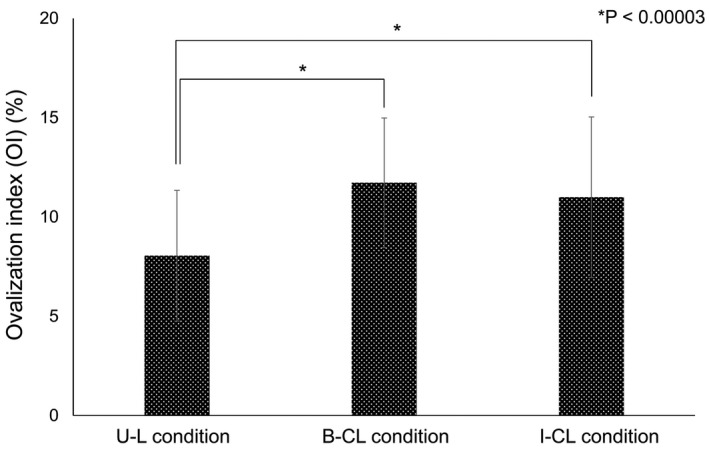
Comparison of ovalization index in three conditions. The OI values for the U‐L, B‐CL, and I‐CL conditions were 8.0 ± 3.3%, 11.7 ± 3.3%, and 10.1 ± 4.0% (F = 21.1, P < 0.0001). By postBonferroni correction, the OI value was significantly higher in the B‐CL condition than that in the U‐L condition (P < 0.00003). The OI value was also significantly higher in the I‐CL condition than that in the U‐L condition (P < 0.00003). We did not observe a significant difference between the B‐CL and I‐CL conditions (P = 0.359).
Data clustering
Based on cluster analysis results, we created two groups: cluster 1 (n = 10) and cluster 2 (n = 21) (Fig. 3A). Based on the method of McClain et al., to determine the optimal number of clusters,28 two clusters were calculated to be optimal. The FMA score of participants in cluster 1 was <26 points and that in cluster 2 was >26. When calculating the association coefficients for FMA with AOU and QOM by cluster, we found significant associations between FMA and both AOU and QOM in cluster 2 but not in cluster 1 (Fig. 3B).
Figure 3.
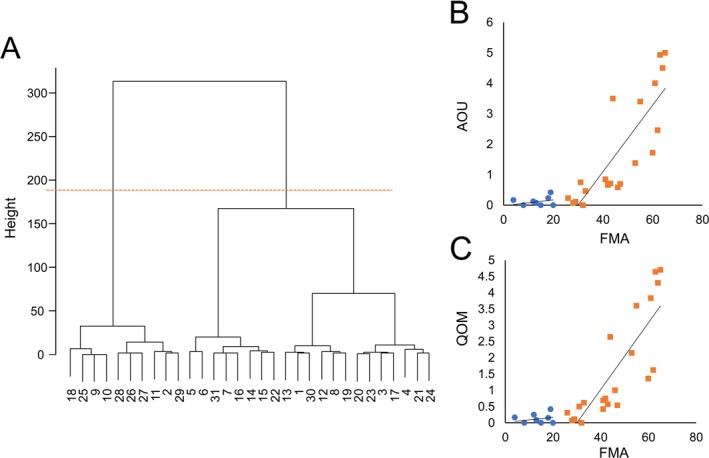
The dendrogram by cluster analysis and the association between FMA and AOU or QOM. (A) The dendrogram is shown on the left side. The orange dotted line divides the patients into two clusters. The cluster centroids for cluster 1 were FMA: 12.50, AOU: 0.10, and QOM: 0.11, and those for cluster 2 were FMA: 46.00, AOU: 1.75, and QOM: 1.64. The cluster sum of squares for cluster 1 was 268.85 and that for cluster 2 was 3,576.66. B: The scatter plot on the right shows the relationship between FMA and AOU (top) or QOM (bottom). The blue dots are cluster 1 and the orange squares are cluster 2. When calculating the association coefficients for FMA with AOU and QOM by cluster, we found significant associations between FMA and both AOU and QOM in cluster 2 (AOU: r = 0.86, S = 214.57, P = 5.56e‐07; QOM: r = 0.90, S = 152.55, P = 2.56e‐08), but not in cluster 1 (AOU: r = 0.216, S = 129.36, P = 0.549; QOM: r = 0.137, S = 142.32, P = 0.705). Cluster 1 showed a floor effect.
Association model based on mediation analysis
The AOU model results in cluster 2 subgroup showed a significant positive association between image OI and FMA, without a moderator. However, with AOU (mediating variable), there was no significant association between image OI and FMA, although we observed significant positive associations between image OI and AOU and between AOU and FMA (Fig. 4A). Moreover, we found the indirect effect of image OI and FMA via AOU to have a bootstrap CI (95% CI) of 0.61–3.75 and to exhibit a significant positive effect. Similarly with the QOM model, without a moderator we observed a significant positive association between image OI and FMA, which disappeared with QOM (mediating variable) introduction, although we observed significant positive associations between image OI and AOU and between AOU and FMA (Fig. 4B). We found the indirect effect of image OI and FMA via QOM to have a bootstrap CI (95% CI) of 0.74–3.55 and to exhibit a significant positive effect.
Figure 4.
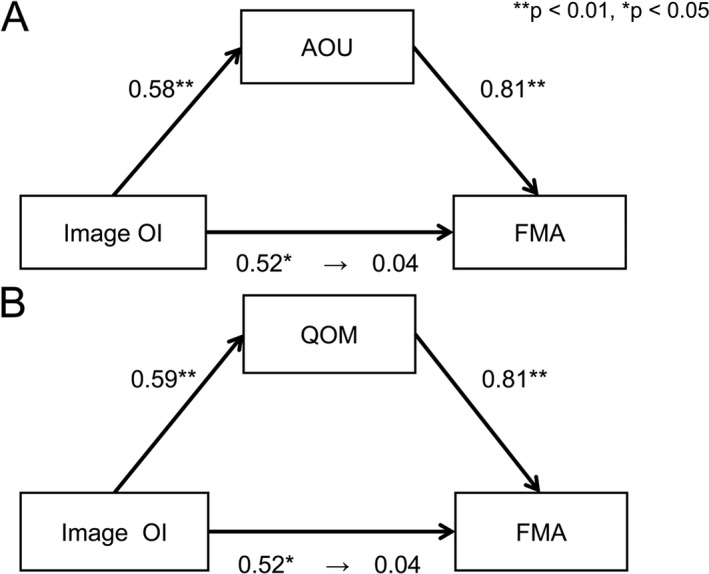
The results of mediation analysis. These figures were created using cluster 2 data. The figure above is the result of the AOU model and the figure below is the result of the QOM model. (A) We found a significant positive association between image OI and FMA (standardized β 0.516, SE 0.835, P = 0.017), but no significant association between image OI and FMA (standardized β 0.044, SE 0.680, P = 0.784), although we observed significant positive associations between image OI and AOU (standardized β 0.584, SE 0.104, P = 0.005) and between AOU and FMA (standardized β 0.584, SE 0.104, P = 0.005) with AOU as a mediating variable. (B) We found a significant positive association between image OI and FMA (standardized β 0.516, SE 0.835, P = 0.017), but no significant association between image OI and FMA (standardized β 0.042, SE 0.689, P = 0.796); however, significant positive associations were observed between image OI and QOM (standardized β 0.588, SE 0.097, P = 0.005) and between QOM and FMA (standardized β 0.805, SE 1.312, P < 0.001) with QOM as a mediating variable. The coefficients being displayed are normalization coefficients.
Discussion
In this study, we used the OI from BCT to quantify upper limb motor‐imagery ability of poststroke hemiplegia patients. Our results showed that, compared to that in the U‐L condition, where only the nonparalyzed limb draws lines, the OI was significantly higher in the B‐CL (the paralyzed limb simultaneously drew circles) and I‐CL conditions (the paralyzed limb was not moved but the participant imagined drawing circles with it). The OI values in the B‐CL and I‐CL conditions did not differ significantly. These comparisons of mean OI values, used as paralyzed upper limb motor‐imagery ability indicator, show that poststroke hemiplegia patients can retain some motor‐imagery ability in the affected upper limb.
Garbarini et al.,19 who also examined the OI values of poststroke hemiplegia patients, observed no significant differences among the U‐L, B‐CL, and I‐CL conditions. They concluded that in hemiplegia patients, no bimanual coupling effect occur and that poststroke hemiplegia patients have reduced motor‐imagery ability. This discrepancy between our study and theirs may be attributed to differences in when measurements were performed after stroke onset. Reportedly, the participants were evaluated a mean 36 days after onset, with most patients in the acute/initial recovery stage.19 In the present study, measurements were performed for mean 1119 days after onset, with most patients in the recovery/chronic stage. The participants recruited in the previous study had severe motor paralysis, including motor neglect after stroke. Therefore, we infer that OI value difference was influenced by movement disorder severity. In our study, the OI values were comparable with those observed in healthy people (mean age, 68.5 years)19 and with those in deafferented patients previously reported,29 confirming motor‐imagery ability in poststroke hemiplegia patients. Studies using brain imaging devices to record brain activities during motor imagery have confirmed activity in motor‐related regions resembling those of healthy people.30, 31
As shown in a previous study,26 our data confirmed floor effect existence in MAL values, using cluster analysis dividing the participants into two clusters. In cluster 1, the MAL subscale items of AOU and QOM were low, with narrow distributions, demonstrating a floor effect. FMA scores of cluster 1 were low (<26 points). Thus, these results indicate that these participants almost never used their paralyzed limbs in daily life and had severe motor dysfunction. Conversely, FMA scores of cluster 2 were ≥26 points; AOU and QOM values of cluster 2 were dispersed, showing no evidence of a floor effect. Only in cluster 2, we observed FMA scores with positive significant associations with AOM and QOM. This supports a previous study12 reporting a significant association between paralyzed upper limb use frequency and paralyzed limb motor functions.
Cluster 2 population, with FMA scores significantly associated with AOM and QOM, was used for the primary objective of this study: performing mediation analysis on how image OI as motor‐imagery ability indicator impacts each variable. We therefore analyzed models of two hypotheses (AOU/QOM model) using cluster 2 data. The results showed that without a moderator, image OI and FMA were significantly associated. However, with AOU/QOM (moderator), this significant association disappeared, although we observed significant associations between both image OI and AOU/QOM and between FMA and AOU/QOM. Moreover, from their bootstrap CIs, the indirect effects of image OI and FMA via AOU/QOM were found to be significantly positive. Thus, we showed that the upper limb motor‐imagery ability of poststroke hemiplegia patients does not directly affect upper limb motor functions but serves to increase the frequency of daily life use and improve QOM, indirectly impacting upper limb motor functions.
Motor imagery is a dynamic state wherein a subject mentally simulates a given action.32 Reportedly, interventions using motor‐imagery tasks improve upper limb motor functions.13, 14, 15, 16, 17 The present study indicated that motor‐imagery ability retention/improvement can increase the frequency of upper limb use in daily life, resulting in improved upper limb motor functions through use‐dependent plasticity. While a person's voluntary movement requires the intention for limb movement, continuous behavioral errors caused by poststroke motor paralysis could hinder a person's intention of paralyzed limb use, disrupting upper limb usage and recovery. Motor‐imagery ability retention or improvement can increase a person's intention of upper limb use in daily life. Research on poststroke hemiplegia patients has shown the relationship between the extent of and change in caudal side activity of the primary motor cortex (a posterior region called area 4p) during motor imagery and upper limb function recovery.33 A relationship exists between the primary motor cortex's caudal side and upper limb motor skills.34 Thus, motor‐imagery ability retention or increase can improve upper limb motor skills, thus improve the QOM, resulting in improved upper limb motor functions.
Based on the results of our study, we conclude that in stroke patients with mild‐to‐moderate upper limb motor dysfunction, motor‐imagery ability directly affected the frequency and QOM in daily life; thus, through these variables, it indirectly affected upper limb motor functions. AOU and QOM exhibited a floor effect in patients with severe motor dysfunction and thus were not suitable for use in statistical analysis. However, these results can only be discussed for mild‐to‐moderate motor dysfunction (a limitation of the present study); in the future, we need to use assessments besides MAL, such as having participants wear an accelerometer during the day to record items such as frequency of use in daily life and to re‐examine these factors as mediating variables. Our research considered neither which hemisphere was damaged nor the presence/absence of higher brain dysfunction complications, such as motor neglect. Motor neglect impact has been suggested as a factor causing in reduced upper limb use21 In addition, we could not identify different hand dominances because all participants were right handed. Future research requires extensively examining subtypes with larger sample sizes. Moreover, longitudinal studies to determine whether motor‐imagery training increases image OI values and whether this improves poststroke upper limb usage and motor dysfunction are warranted. In addition, in the future, we need to determine the cases that cause OI increase, contribute to motor‐function recovery, and the type of brain reorganization that occurs. Despite these limitations and the unanswered questions, the present study demonstrated that BCT can be used to easily quantify motor‐imagery ability in patients with poststroke hemiplegia. Mediation analysis verified our hypothesis that motor‐imagery ability retention or improvement further improves in the AOU and QOM in daily life, thus improving upper limb motor functions.
Conflict of Interest
The authors declare no conflicts of interest associated with this manuscript.
Acknowledgments
We would like to thank M. Kouno and R. Ogura for their support in clinical data collection.
Funding Information
Additionally, this work was supported by JSPS KAKENHI Grant Numbers JP17K01546, and MEXT KAKENHI Grant Number JP 17H05915.
Funding Statement
This work was funded by JSPS KAKENHI grant JP17K01546; MEXT KAKENHI grant JP 17H05915.
References
- 1. Taub E, Uswatte G, Elbert T. New treatments in neurorehabilitation founded on basic research. Nat Rev Neurosci 2002;3:228–236. [DOI] [PubMed] [Google Scholar]
- 2. Gauthier LV, Taub E, Mark VW, et al. Atrophy of spared gray matter tissue predicts poorer motor recovery and rehabilitation response in chronic stroke. Stroke 2012;43:453–457. [DOI] [PMC free article] [PubMed] [Google Scholar]
- 3. Nudo RJ. Remodeling of cortical motor representations after stroke: implications for recovery from brain damage. Mol Psychiatry 1997;2:188–191. [DOI] [PubMed] [Google Scholar]
- 4. Mark VW, Taub E, Morris DM. Neuroplasticity and constraint‐induced movement therapy. Eura Medicophys 2006;42:269–284. [PubMed] [Google Scholar]
- 5. Taub E, Miller NE, Novack TA, et al. Technique to improve chronic motor deficit after stroke. Arch Phys Med Rehabil 1993;74:347–354. [PubMed] [Google Scholar]
- 6. Fugl‐Meyer AR, Jääskö L, Leyman I, et al. The post‐stroke hemiplegic patient. 1. A method for evaluation of physical performance. Scand J Rehabil Med 1975;7:13–31. [PubMed] [Google Scholar]
- 7. Gladstone DJ, Danells CJ, Black SE. The Fugl‐Meyer assessment of motor recovery after stroke: a critical review of its measurement properties. Neurorehabil Neural Repair 2002;16:232–240. [DOI] [PubMed] [Google Scholar]
- 8. Wolf SL, Winstein CJ, Miller JP, et al. Effect of constraint‐induced movement therapy on upper extremity function 3 to 9 months after stroke: the EXCITE randomized clinical trial. JAMA 2006;296:2095–2104. [DOI] [PubMed] [Google Scholar]
- 9. Myint JM, Yuen GF, Yu TK, et al. A study of constraint‐induced movement therapy in subacute stroke patients in Hong Kong. Clin Rehabil 2008;22:112–124. [DOI] [PubMed] [Google Scholar]
- 10. Bonifer NM, Anderson KM, Arciniegas DB. Constraint‐induced movement therapy after stroke: efficacy for patients with minimal upper‐extremity motor ability. Arch Phys Med Rehabil 2005;86:1867–1873. [DOI] [PubMed] [Google Scholar]
- 11. Takebayashi T, Amano S, Hanada K, et al. A one‐year follow‐up after modified constraint‐induced movement therapy for chronic stroke patients with paretic arm: a prospective case series study. Top Stroke Rehabil 2015;22:18–25. [DOI] [PubMed] [Google Scholar]
- 12. Santisteban L, Térémetz M, Bleton JP, et al. Upper limb outcome measures used in stroke rehabilitation studies: a systematic literature review. PLoS ONE 2016;11:e0154792. [DOI] [PMC free article] [PubMed] [Google Scholar]
- 13. Page SJ. Imagery improves motor function in chronic stroke patients with hemiplegia: a pilot study. Occuo Ther J Res 2000;20:200–215. [Google Scholar]
- 14. Crosbie JH, McDonough SM, Gilmore DH, Wiggam MI. The adjunctive role of mental practice in the rehabilitation of the upper limb after hemiplegic stroke: a pilot study. Clin Rehabil 2004;18:60–68. [DOI] [PubMed] [Google Scholar]
- 15. Dijkerman HC, Ietswaart M, Johnston M, MacWalter RS. Does motor imagery training improve hand function in chronic stroke patients? A pilot study Clin Rehabil 2004;18:538–549. [DOI] [PubMed] [Google Scholar]
- 16. Hewett TE, Ford KR, Levine P, Page SJ. Reaching kinematics to measure motor changes after mental practice in stroke. Top Stroke Rehabil 2007;14:23–29. [DOI] [PubMed] [Google Scholar]
- 17. Page SJ, Levine P, Leonard A. Mental practice in chronic stroke: results of a randomized, placebo‐controlled trial. Stroke 2007;38:1293–1297. [DOI] [PubMed] [Google Scholar]
- 18. Langhorne P, Coupar F, Pollock A. Motor recovery after stroke: a systematic review. Lancet Neurol 2009;8:741–754. [DOI] [PubMed] [Google Scholar]
- 19. Garbarini F, Rabuffetti M, Piedimonte A, et al. ‘Moving’ a paralysed hand: bimanual coupling effect in patients with anosognosia for hemiplegia. Brain 2012;135:1486–1497. [DOI] [PubMed] [Google Scholar]
- 20. Folstein MF, Folstein SE, McHugh PR. “Mini‐mental state”. A practical method for grading the cognitive state of patients for the clinician. J Psychiatr Res 1975;12:189–198. [DOI] [PubMed] [Google Scholar]
- 21. Franz EA, Zelaznik HN, McCabe G. Spatial topological constraints in a bimanual task. Acta Psychol 1991;77:137–151. [DOI] [PubMed] [Google Scholar]
- 22. Franz EA, Ramachandran VS. Bimanual coupling in amputees with phantom limbs. Nat Neurosci 1998;1:443–444. [DOI] [PubMed] [Google Scholar]
- 23. Garbarini F, Pia L, Piedimonte A, et al. Embodiment of an alien hand interferes with intact‐hand movements. Curr Biol 2013;23:R57–R58. [DOI] [PubMed] [Google Scholar]
- 24. Van der Lee JH, Beckerman H, Knol DL, et al. Clinimetric properties of the Motor Activity Log for the assessment of arm use in hemiparetic patients. Stroke 2004;35:1410–1414. [DOI] [PubMed] [Google Scholar]
- 25. Uswatte G, Taub E, Morris D, et al. Reliability and validity of the upper‐extremity Motor Activity Log‐14 for measuring real‐world arm use. Stroke 2005;36:2493–2496. [DOI] [PubMed] [Google Scholar]
- 26. Chuang IC, Lin KC, Wu CY, et al. Using Rasch analysis to validate the motor activity Log and the lower functioning motor activity log in patients with stroke. Phys Ther 2017;97:1030–1040. [DOI] [PubMed] [Google Scholar]
- 27. Shimizu H. An introduction to the statistical free software HAD: suggestions to improve teaching, learning and practice data analysis. J Media Inform Commun 2016;1:59–73. [Google Scholar]
- 28. McClain JO, Rao VR. CLUSTISZ: a program to test for the quality of clustering of a set of objects. J Mark Res 1975;12:456–460. [Google Scholar]
- 29. Osumi M, Sumitani M, Wake N, et al. Structured movement representations of a phantom limb associated with phantom limb pain. Neurosci Lett 2015;605:7–11. [DOI] [PubMed] [Google Scholar]
- 30. Szameitat AJ, Shen S, Conforto A, Sterr A. Cortical activation during executed, imagined, observed, and passive wrist movements in healthy volunteers and stroke patients. NeuroImage 2012;62:266–280. [DOI] [PubMed] [Google Scholar]
- 31. Sharma N, Baron JC, Rowe JB. Motor imagery after stroke: relating outcome to motor network connectivity. Ann Neurol 2009;66:604–616. [DOI] [PMC free article] [PubMed] [Google Scholar]
- 32. Decety J. The neurophysiological basis of motor imagery. Behav Brain Res 1996;77:45–52. [DOI] [PubMed] [Google Scholar]
- 33. Sharma N, Jones PS, Carpenter TA, Baron JC. Mapping the involvement of BA 4a and 4p during motor imagery. NeuroImage 2008;41:92–99. [DOI] [PubMed] [Google Scholar]
- 34. Rathelot JA, Strick PL. Subdivisions of primary motor cortex based on cortico‐motoneuronal cells. Proc Natl Acad Sci USA 2009;106:918–923. [DOI] [PMC free article] [PubMed] [Google Scholar]