

Abstract
Objectives
High‐frequency spinal cord stimulation (HF‐SCS) at 10 kHz has proven to be efficacious in the treatment of chronic back and leg pain in a randomized, controlled, trial (SENZA‐RCT). However, large observational studies have yet to be published. Therefore, we performed a real‐world, multicenter, retrospective, review of therapy efficacy in 1660 patients with chronic trunk and/or limb pain.
Methods
Data were collected in a real‐world environment and retrospectively sourced from a global database. Included patients were trialed and/or permanently implanted with HF‐SCS at 10 kHz between April 2014 and January 2018. We evaluated responder rates at 3, 6, and 12 months post‐implantation. Response was defined as ≥50% pain relief from baseline. A last visit analysis included responder rate along with overall change in function, sleep, quality of life, and medication intake versus baseline.
Results
Eighty‐four percent of our HF‐SCS‐treated patients had both chronic back and leg pain. At least 70% of patients reported response to therapy throughout 12 months of follow‐up. This sustained responder rate was corroborated by the last visit value (74.1%). Most patients reported concomitant improvements in function (72.3%), sleep (68.0%), and quality of life (90.3%) at their last visit versus baseline. Thirty‐two percent of patients reported decreased medication intake at their last visit.
Interpretation
Sustained and effective pain relief was experienced by >70% of our HF‐SCS‐treated patients, consistent with the findings of a previously published randomized, controlled, trial. Our review provides complementary evidence to support the treatment of chronic back and leg pain with this therapy.
Introduction
Chronic pain is a pervasive health issue worldwide.1, 2 It places a substantial burden on society, families, and individuals.3 Low back pain is one of the most prevalent chronic pain syndromes. It affects over 500 million people globally and is the largest single cause of years lived with disability.4 Persistent back and/or radicular leg pain secondary to spinal surgery, also known as failed back surgery syndrome (FBSS), is quite a common condition in the population with similar levels of prevalence and incidence to rheumatoid arthritis.5, 6 Despite the availability of numerous treatment modalities, satisfactory pain control remains elusive for many patients.
Interventional pain management specialists have used traditional low‐frequency spinal cord stimulation (LF‐SCS) to treat FBSS for several decades. Its effectiveness has been established in patients with predominant leg pain.7, 8 It is generally accepted after decades of experience and research in this area that LF‐SCS provides around 50% pain relief in approximately half of patients.9 While this is an overall success story for many patients with intractable pain, the therapy has key limitations. Half of patients do not achieve satisfactory pain control, and for many that do initially, long‐term studies suggest that therapy effectiveness can diminish after several years.10, 11, 12, 13, 14, 15 Achieving good outcomes in patients with predominant axial back pain is especially challenging.16 In addition, the necessary paresthesia which characterizes successful LF‐SCS is uncomfortable for some patients, particularly if they experience overstimulation during postural changes.17, 18
New stimulation waveforms offer the opportunity to improve clinical outcomes and provide a more comfortable patient experience. High‐frequency spinal cord stimulation (HF‐SCS) at 10 kHz has proven to do both. In an RCT, the therapy was compared with LF‐SCS in subjects with chronic back and leg pain.19 At 24 months after implantation, for both back and leg pain, approximately half of LF‐SCS subjects were responders to therapy (at least 50% pain relief from baseline), while around three‐quarters were responders to HF‐SCS at 10 kHz. Over‐and‐above the long‐term superiority over LF‐SCS, subjects receiving HF‐SCS at 10 kHz did not experience any paresthesia or stimulation‐related discomfort.20
Within the clinical evidence hierarchy, randomized, controlled, trials are the gold‐standard study design to minimize bias and confounding factors.21 Their goal is to generate, as far as is reasonably possible within the study setting and design, credible evidence of a cause‐and‐effect relationship between a treatment and an outcome in a target population. The role of RCTs is well‐established and central to the practice of evidence‐based medicine. However, while the validity of RCTs can be high within their target population, their external validity may be limited by strict patient selection, limited duration, and rigorous clinical protocols.21, 22, 23 A closer reflection of everyday clinical practice may be accomplished using pragmatic observational studies. Although such studies cannot infer causal relationships, they can produce complementary evidence to validate the outcomes of RCTs.23 In the case of HF‐SCS at 10 kHz, results from observational studies in large groups of patients have yet to be published. Therefore, we performed a real‐world, multicenter, retrospective, review of the efficacy of this therapy in 1660 patients with chronic trunk and/or limb pain.
Methods
Study design and setting
Data for this international, retrospective, multicenter, review were drawn from a real‐world, global, database populated with anonymized records from all included patients who were trialed and/or permanently implanted with a Senza™ system delivering HF‐SCS at 10 kHz and maintained by Nevro Corp., Redwood City, CA, USA. Eight sites (both academic and non‐academic centers) across three countries participated in this review. Each site had at least 100 implanted patients over a 2‐year period. Five sites were located in the USA, 2 in Germany, and 1 in the UK. Due to the retrospective nature of the analyses and use of anonymized data listings, ethical committee approval was not required for this study.
Selection criteria
We retrospectively extracted and analyzed the database records from all trunk and/or limb pain patients in participating institutions who were trialed and/or permanently implanted with HF‐SCS at 10 kHz between April 2014 and January 2018.
Follow‐up
Trial and permanent implantation procedures for the therapy have been described previously.20 Aside from the standard of care clinical follow‐ups, pre‐ and post‐implantation patient management included the support of a local clinical specialist under the guidance of a pain physician. The principal role of the clinical specialist was to assess therapy effectiveness at each clinic visit via a series of structured questions and assist in carrying out therapy optimization, as necessary. If patients were not able to attend regular follow‐up visits at 3, 6, 12 month and/or last visit assessment after permanent implant they've been contacted by clinical specialist via telephone. Standard programming strategies were followed for HF‐SCS at 10 kHz based on patient‐reported pain relief and included an electrode bipole search to determine the optimal stimulation site within the vertebral column, typically near thoracic vertebral levels 9 and 10. If needed, there were several additional therapy optimization tools available to evaluate more complex electrode combinations, pulse trains, and amplitude settings. Data were entered into the global database after each follow‐up.
Variables
Patient records were extracted from the database at numerous study time points including baseline, during the trial, and at each scheduled post‐implantation follow‐up. The last visit assessment was defined as the last clinic or telephone follow‐up with the patient at any time after permanent implantation, before the data were pooled for final report.
Baseline data comprised pain intensity score measured using an 11‐point verbal numeric rating scale (VNRS; 0 = no pain to 10 = worst possible pain), pain distribution, and previous LF‐SCS experience (if any). Data from the trial included pain intensity score (VNRS) and percentage pain relief obtained from the therapy (0% = no pain relief to 100% = complete pain relief). The latter variable was also extracted from each post‐implantation follow‐up.
From the last visit, variables were extracted relating to the usage of additional therapy optimization tools (10 kHz preferred program), overall change in medication (increased, decreased, or unchanged), function (improved: yes or no), and sleep (improved: yes or no). In USA, additional variables relating to overall change in quality of life (a great deal better, moderately better, or no change), satisfaction with therapy, device recharge experience, frequency of therapy adjustments, and device usage while sleeping and driving were extracted. All variables were patient‐reported except those relating to therapy optimization.
Therapy response was evaluated from the percentage pain relief documented during the trial, at each scheduled post‐implantation follow‐up, and at the last visit. Response to therapy was defined as at least 50% pain relief from baseline.
Statistical methods
Descriptive analysis of continuous variables included median, 25th (Q1) and 75th (Q3) percentiles. Categorical variables were reported as counts and percentages with 95% confidence intervals (CI) where possible. Pain relief data were analyzed by reporting descriptive statistics. As an additional supportive analysis, last visit data were evaluated. All data were analyzed as‐observed. Outcomes from this cohort relating to overall change in quality of life, satisfaction with therapy, device recharge experience, frequency of therapy adjustments, and device usage while sleeping and driving were also compared to available commercial data from all implanted patients in USA. These anonymized data were collected in the real‐world setting and stored in the global database. In addition, selected outcomes were further analyzed in the subgroup of patients with previously unsuccessful LF‐SCS. The number of patients with available data is reported for each measure. All analyses were carried out in Microsoft Excel 2013 (Microsoft, Redmond, WA, USA).
Results
Patient cohort
During the 4‐year review period, 1660 patients were trialed and/or permanently implanted with HF‐SCS at 10 kHz at participating institutions (Fig. 1). Of these, 1603 had percentage pain relief trial data available and were analyzed for therapy response. The same data were available for 844, 600, and 326 patients, at 3, 6, and 12 months post‐implantation, respectively, and for 1131 patients at the last visit. As the data were collected in a real‐world setting, only a fraction of patients had information at 3, 6, and 12 months, whereas majority had information at last visit assessment. The mean time between implantation and the last visit was 8.9 months (SD ±6.7, median 6.9, range 0.1–33.2).
Figure 1.
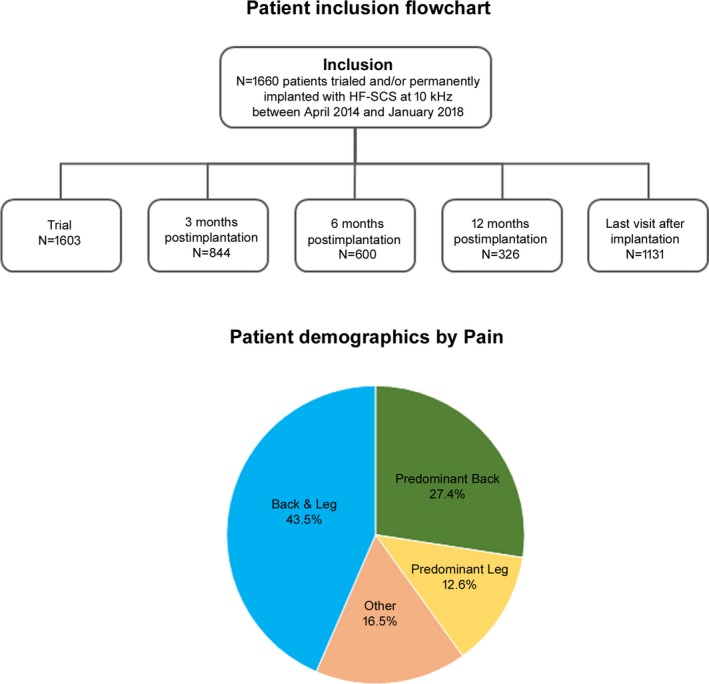
Flowchart detailing the number of patients included in the review and analyzed at each study time point for therapy response and pie chart showing patient demographics by pain type. Due to the collection of data in a real‐world setting, only a fraction of patients had information at 3, 6, and 12 months, whereas majority had information at last visit assessment.
Patient characteristics
Baseline patient characteristics are presented in Table 1. Pain distribution data were available for 1640 patients. Of these, 43.5% reported back and leg pain, 27.4% predominant back pain, and 12.6% predominant leg pain. Upper back, left arm, and right arm constituted the three main other pain distributions (16.5%). Approximately a quarter of patients (23.9%, N = 1596) had been unsuccessfully treated with LF‐SCS in the past. Median pain intensity score for the cohort (N = 1603) was 8.0 (Q1–Q3, 7.0–9.0).
Table 1.
Patient characteristics at baseline. Data is presented as % (95% confidence lower limit‐upper limit)
| Characteristic | Europe (%) | USA (%) | All (%) |
|---|---|---|---|
| Pain distribution | N = 479 | N = 1161 | N = 1640 |
| Back and leg | 39.7% (36.9%–42.5%) | 45.0% (40.5%–49.5%) | 43.5% (41.1%–45.9%) |
| Predominant back | 24.6% (22.1%–27.1%) | 28.6% (24.6%–32.6%) | 27.4% (25.2%–29.6%) |
| Predominant leg | 14.8% (12.8%–16.8%) | 11.7% (8.8%–14.6%) | 12.6% (11.0%–14.2%) |
| Other | 20.9% (18.6%–23.2%) | 14.6% (11.4%–17.8%) | 16.5% (14.7%–18.3%) |
| LF‐SCS experience | N = 443 | N = 1153 | N = 1596 |
| Prior experience | 20.5% (16.7%–24.3%) | 25.2% (22.7%–27.7%) | 23.9% (21.8%–26.0%) |
| No prior experience | 79.5% (75.7%–83.3%) | 74.8% (72.3%–77.3%) | 76.1% (74.0%–78.2%) |
| Pain intensity | N = 479 | N = 1124 | N = 1603 |
| Median pain intensity score (VNRS) | 9.0 (Q1–Q3, 8.0–9.5) | 8.0 (Q1–Q3, 7.0–9.0) | 8.0 (Q1–Q3, 7.0–9.0) |
LF‐SCS, Low‐frequency spinal cord stimulation; VNRS, 11‐point verbal numeric rating scale (0 = no pain to 10 = worst possible pain).
Pain distribution was slightly, but significantly different (P = 0.002, chi‐square test) between patients included from Europe (N = 479) and the USA (N = 1161) (Table 1). Briefly, of the patients with available pain distribution data, 39.7% in Europe and 45.0% in the USA reported back and leg pain, 24.6% and 28.6% predominant back pain, and 14.8% and 11.7% predominant leg pain, respectively, and 20.5% in Europe and 25.2% in the USA had been unsuccessfully treated with LF‐SCS in the past. Median pain intensity scores for patients included from Europe and the USA were 9.0 (Q1–Q3, 8.0–9.5) and 8.0 (Q1–Q3, 7.0–9.0), respectively.
Outcomes
Pain relief and responder rate
At the end of trial time point, 86.9% of all patients (1393/1603) responded to therapy (at least 50% pain relief from baseline). Trial responders reported a significant (P < 0.00001, Mann–Whitney U test) reduction in pain intensity scores, with median scores reduced from 8.0 (Q1–Q3, 7.0–9.0) to 3.0 (Q1–Q3, 1.0–4.0), a reduction of 62.5%. Furthermore, pain intensity scores (VNRS) were significantly lower at all time points (P < 0.00001, Mann–Whitney U test) compared to baseline in the responding patients. Median pain intensity score decreased from 8.0 (Q1–Q3, 7.0–9.0) to 3.0 (Q1–Q3, 2.0–4.0), 3.0 (Q1–Q3, 2.0–4.0), 3.0 (Q1–Q3, 2.0–4.0), and 3.0 (Q1–Q3, 2.0–4.0) at 3, 6, 12 months and the last visit, respectively.
Of the 844 patients with percentage pain relief data available at 3 months post‐implantation, 74.6% responded to therapy. This responder rate was sustained throughout 12 months post‐implantation (Fig. 2) and was consistent with the last visit value of 74.1% (N = 1131). Responder rate was further analyzed according to whether patients were included from Europe or the USA. Though the responder rates appeared to be slightly higher in patients from Europe at the 3‐month follow‐up (85.0% vs. 70.2%), the difference dissipated at later follow‐up times including the last visit (Fig. 2).
Figure 2.
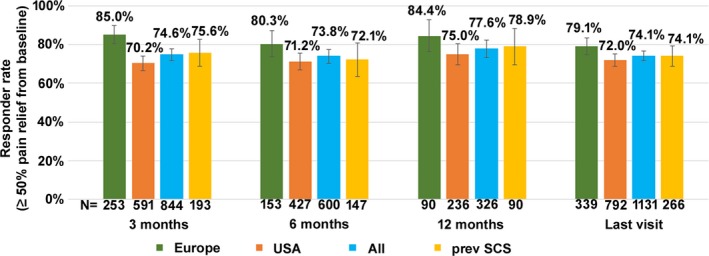
Responder rate (±95% confidence interval) at each study time point.
Safety
Among the 1290 patients with safety data available, 48 had their devices explanted (3.7%) (Table 2). Of these, 22 were removed sequela to infection (1.7%), 15 due to loss of efficacy (1.2%), and 11 for other reasons (0.8%).
Table 2.
Details of device explants in the population
| Reason for explant | n (%; 95% confidence range) |
|---|---|
| N = 1290 | |
| Infection | 22 (1.7%; 1.0%–2.4%) |
| Loss of efficacy | 15 (1.2%; 0.6%–1.8%) |
| Other reasons | 11 (0.8%; 0.3%–1.3%) |
| Total | 48 (3.7%; 2.7%–4.7%) |
Ease of use
While a high percentage of patients responded well to standard 10 kHz target optimization using a simple bipole, additional 10 kHz therapy optimization tools were utilized in 56.7% of all patients (N = 1198) (Fig. 3). These programming options were applied in a standardized fashion and customized to each patient's needs. In total, 38.3% of all patients (N = 1198) had multi‐area pain sequencing (MAPS) or bipole interlacing programmed. The former option combined different programs while the latter merged multiple bipole programs into one program. Pulse dosing was programmed in 18.4% of the population (N = 1198) and delivered stimulation in on‐off cycles.
Figure 3.
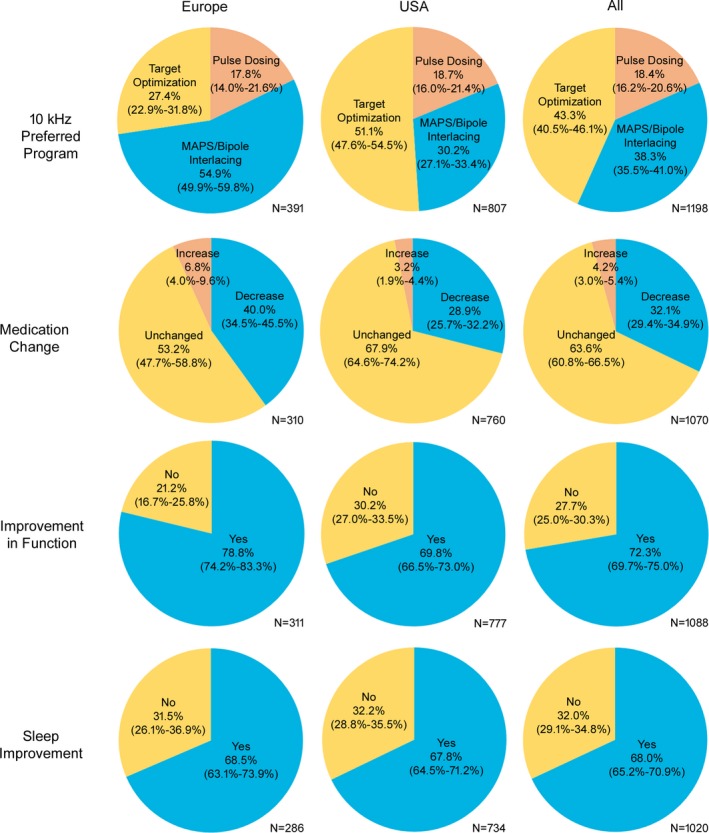
Evaluation of therapy optimization tools (10 kHz preferred program) and overall change in medication, function, and sleep, at the last visit. Therapy optimization tools: Multi‐area pain sequencing (MAPS) combines different programs; bipole interlacing merges multiple bipole programs into one program; pulse dosing delivers stimulation in on‐off cycles. Values given as % with 95% confidence interval.
Interestingly, additional 10 kHz therapy optimization tools were utilised in 72.7% of patients from Europe (N = 391) and in 48.9% of patients from the USA (N = 807) (Fig. 3). More specifically, MAPS or bipole interlacing was programmed in 54.9% and 30.2% of Europe and USA patients, respectively, while pulse dosing was programmed in 17.8% and 18.7%, respectively.
Quality of life
Functional improvement at the last visit was noted by 72.3% of all patients (N = 1088), 78.8% of Europe patients (N = 311), and 69.8% of USA patients (N = 777) (Fig. 3). Improved sleep was reported by 68.0% of all patients (N = 1020), 68.5% of Europe patients (N = 286), and 67.8% of USA patients (N = 734).
Additional responses to questions at the last visit which evaluated overall change in quality of life, satisfaction with therapy, device recharge experience, frequency of therapy adjustments, and device usage while sleeping and driving are detailed in Table 3. Data were available for between 533 and 544 patients for all questions except that which focused on patients with previous LF‐SCS experience which had 60 responses.
Table 3.
Responses to questions which evaluated overall change in quality of life, satisfaction with therapy, device recharge experience, frequency of therapy adjustments, and device usage while sleeping and driving. Based on data available at the last visit from USA patients. Data is presented as % (95% confidence lower limit‐upper limit)
| Question | Patients in this reviewa % | Subgroup of patients with previous LF‐SCS experience in this reviewb % | Comparative cohort: patients from the entire USAc % | |
|---|---|---|---|---|
| Overall change in quality of life | Since having your device, how would you describe the change in activity limitations, symptoms, emotions and overall quality of life? | N = 544 | N = 140 | N = 8283 |
|
A great deal better Moderately better No change |
56.6% (52.4%–60.8%) 33.6% (29.6%–37.6%) 9.7% (7.2%–12.2%) |
51.4% (43.1%–59.7%) 36.4% (28.4%–48.4%) 12.1% (6.7%–17.5%) |
56.3% (55.2%–57.4%) 30.4% (29.4%–31.4%) 13.3% ± 0.7% (12.6%–14.0%) |
|
| Satisfaction with therapy | How likely are you to do it all again for the result you are getting now? | N = 544 | N = 140 | N = 8276 |
|
Likely or very likely Not sure Unlikely or very unlikely |
82.4% (79.2%–85.6%) 11.8% (9.1%–14.5%) 5.9% (3.9%–7.9%) |
81.4% (75.0%–87.8%) 12.9% (7.3%–18.5%) 5.7% (1.7%–9.5%) |
79.0% (78.1%–79.9%) 10.9% (10.2%–11.6%) 10.1% (9.5%–10.7%) |
|
| How likely are you to recommend Nevrod to someone who has similar pain? | N = 541 | N = 140 | N = 8183 | |
|
Likely or very likely Not sure Unlikely or very unlikely |
89.5% (86.9%–92.1%) 7.6% (5.4%–9.8%) 3.0% (1.6%–4.4%) |
85.7% (79.9%–91.5%) 9.3% (4.5%–14.1%) 5.0% (1.4%–8.6%) |
84.7% (83.9%–85.5%) 10.9% (10.2%–11.6%) 4.5% (4.1%–4.9%) |
|
| How would you rate the Nevrod device in comparison to the previous SCS e you experienced? | N = 60 | N = 920 | ||
|
A great deal better Moderately better No change |
90.0% (82.4%–97.6%) 5.0% (0–10.5%) 5.0% (0–10.5%) |
76.8% (74.1%–79.5%) 11.0% (9.0%–13.0%) 12.2% (10.1%–14.3%) |
||
| Device recharge experience | How satisfied are you with the convenience of charging your device? | N = 544 | N = 140 | N = 8276 |
|
Satisfied or very satisfied Neutral Dissatisfied or very dissatisfied |
86.4% (83.5%–89.3%) 7.4% ± 2.2% (5.2%–9.6%) 6.3% (4.3%–8.3%) |
83.6% (77.5%–89.7%) 9.3% (4.5%–14.1%) 7.1% (2.8%–11.4%) |
74.5% (73.6%–75.4%) 15.8% (15.0%–16.6%) 9.7% (9.1%–10.3%) |
|
| How often do you charge your device? | N = 544 | N = 140 | N = 8265 | |
|
Every day Every other day Less than 2–3 times per week |
81.8% (78.6%–85.0%) 12.3% (9.5%–15.1%) 5.7% (3.8%–7.6%) |
77.1% (70.1%–84.1%) 18.6% (12.2%–25.0%) 3.6% (0.5%–6.7%) |
81.3% (80.5%–82.1%) 13.4% (12.7%–14.1%) 4.8% (4.3%–5.3%) |
|
| How long does it take you to charge your device? | N = 533 | N = 134 | N = 8100 | |
|
<30 min 30–60 min > 60 min |
23.5% (19.9%–27.1%) 65.3% (61.3%–69.3%) 11.3% (8.6%–14.0%) |
20.9% (14.0%–27.8%) 61.9% (53.7%–70.1%) 17.2% (10.8%–23.6%) |
21.8% (20.9%–22.7%) 70.9% (69.9%–71.9%) 7.3% (6.7%–7.9%) |
|
| Frequency of therapy adjustments | How often do you use your remote control to adjust your therapy settings? | N = 544 | N = 140 | N = 8272 |
|
Never Once per week or less often 2–3 times per week Daily |
50.6% (46.4%–54.8%) 34.6% (30.6%–38.6%) 12.7% (9.9%–15.5%) 2.2% (1.0%–3.4%) |
47.1% (38.8%–55.4%) 37.9% (29.9%–45.9%) 13.6% (7.9%–19.3%) 1.4% (0–3.3%) |
46.8% (45.7%–47.9%) 38.8% (37.8%–39.8%) 11.3% (10.6%–12.0%) 3.1% (2.7%–3.5%) |
|
| Device usage while sleeping and driving | Do you sleep with your device turned on? | N = 544 | N = 140 | N = 8274 |
|
Yes No |
98.7% (97.7%–99.7%) 1.3% (0.3%–2.3%) |
98.6% (96.7%–100.5%) 1.4% (0–3.3%) |
98.8% (98.6%–99.0%) 1.2% (1.0%–1.4%) |
|
| Do you drive with your device turned on? | N = 543 | N = 140 | N = 8266 | |
|
Yes No |
98.2% (97.1%–99.3%) 1.8% (0.7%–2.9%) |
97.9% (95.5%–100.3%) 2.1% (0–4.5%) |
97.8% (97.5%–98.1%) 2.2% (1.9%–2.5%) |
Mean follow‐up period = 8.9 months (SD ±6.7, range 0.1–33.2).
Mean follow‐up period = 10.7 months (SD ±7.7, range 0.1–33.2).
Total number of responses from implanted patients in USA = 8282. Mean follow‐up period = 8.1 months (SD ± 5.2, range 0.3–26.4).
Nevro refers to HF‐SCS at 10 kHz therapy.
SCS refers to LF‐SCS therapy.
When questioned about overall change in quality of life, 90.3% of patients reported improvement. High levels of satisfaction with therapy were also reported by most patients: 82.4% were likely or very likely to undergo the procedure again for the same result, 89.5% were likely or very likely to recommend the therapy, and 95.0% of patients who had previous LF‐SCS experience rated their HF‐SCS at 10 kHz as better. Device recharging was found to be convenient in 86.4% of patients with the majority charging their device daily or every other day (94.1%) for about an hour or less (88.7%). Patients rarely adjusted their therapy more often than 2–3 times per week (2.2%). Nearly all patients slept and drove with their devices switched on (98.7% and 98.2%, respectively). The responses to this set of questions were generally in line with the commercial data from all implanted patients in USA (N = 8282; Table 3).
Medication change
Overall change in medication versus baseline was also analyzed at the last visit. A decrease in medication intake was reported by 32.1% of all patients (N = 1070), 40.0% of Europe patients (N = 310), and 28.9% of USA patients (N = 760) (Fig. 3).
Patients with previous LF‐SCS
Outcomes were analyzed as they related to the subgroup of patients with previously unsuccessful LF‐SCS. The results of HF‐SCS in this patient subgroup were comparable to the results for the entire cohort. Pain distribution data (N = 382) indicated that 47.6% had back and leg pain, 26.7% predominant back pain, 10.7% predominant leg pain, and 14.9% other pain distributions. Median pain intensity score at baseline was 8.0 (Q–Q3, 7.0–9.0) (N = 337). The mean time between implantation and the last visit was 10.7 months (±7.7, range 0.1–33.2). Successful trials were reported in 88.4% of this group (298/337). Pain intensity scores in trial responders reduced significantly (P < 0.0001, Mann–Whitney U test). Median scores reduced from 8.0 (Q1–Q3, 7.0–9.0) to 3.0 (Q1–Q3, 1.8–4.0) points, a reduction of 62.5%. At 3, 6, and 12 months post‐implantation, 75.6% (N = 193), 72.1% (N = 147), and 78.9% (N = 90) of patients responded to therapy, respectively (Fig. 2). Of the 266 patients with percentage pain relief data available at the last visit, 74.1% responded to therapy. At the last visit, 32.5% of patients (N = 40) reported decreased medication intake versus baseline, 82.5% (N = 40) improved function, and 70.0% (N = 30) improved sleep. Responses to questions at the last visit which evaluated overall change in quality of life, satisfaction with therapy, device recharge experience, frequency of therapy adjustments, and device usage while sleeping and driving were very similar to the whole cohort of patients (Table 3).
Discussion
This publication constitutes the most extensive study to date evaluating the real‐world efficacy of HF‐SCS 10 kHz therapy for chronic back and/or limb pain. Data were retrospectively sourced from eight participating centers across three countries over a 4‐year period. A total of 1660 patients were included in the review. The majority of the cohort had both chronic back and leg pain or axial back pain (71%), which are historically difficult‐to‐treat pain syndromes. Our review found that >70% of our HF‐SCS treated patients experienced at least 50% pain relief throughout 12 months of post‐implantation follow‐up. This outcome was corroborated by the last visit analysis. Concomitant improvements in quality of life, function, sleep, and medication reduction as well as high levels of satisfaction with the therapy were also reported.
Therapeutic and device durability was found to be robust as evidenced by an extremely low explantation rate. The overall rate of system explant was 3.7%, far less than historical norms for traditional spinal cord stimulation (LF‐SCS).24 Explants due to infection were 1.7% of implants. This value is slightly lower than the published historical rates of LF‐SCS infection of 3‐5%.25 Explants due to loss of efficacy occurred in 1.2% of the implanted population. Behind battery depletion in non‐rechargeable IPGs, explants due to loss of efficacy are the predominant driver for historical LF‐SCS explantations; thus, the low rates of explant for this reason are highly encouraging. There were no explants due to battery depletion.
Device recharging was generally found to be convenient with most patients recharging daily, or every other day for an hour or less. Paresthesia‐independent stimulation is likely to account for the vast majority of patients (98% or more) who rarely adjusted their therapy settings once optimal pain relief was achieved, and reported sleeping and driving with their devices switched on. Our analysis also showed that therapy can be tailored to individual patients, with patients finding their most successful program across a range of different applications of 10 kHz therapy. Further subgroup analysis of patients with previously unsuccessful LF‐SCS revealed that their outcomes were very similar to the whole cohort, indicating that 10 kHz HF‐SCS therapy may be a useful treatment option for this group.
Our responder rate outcomes are consistent with results from a multicenter, prospective, randomized, controlled trial (SENZA‐RCT) comparing the therapy with LF‐SCS.19, 20 Recruited subjects had chronic, intractable, back and leg pain with average pain intensity in both locations of at least 5.0 cm on the visual analog scale (VAS). The SENZA‐RCT longitudinal responder rates for axial back pain in HF‐SCS 10 kHz subjects were 84%, 76%, and 79% at 3, 6, and 12 months, respectively. The corresponding rates for overall pain relief in our cohort were comparable (Fig. 4). Furthermore, 32% of our patients reported decreased medication intake at their last visit. This proportion is in line with the 36% of subjects receiving HF‐SCS 10 kHz in the SENZA‐RCT who reduced or stopped opioid pain medication at 12 months.20
Figure 4.
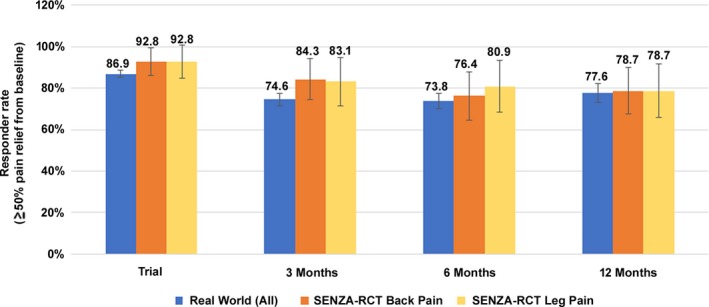
Comparison of responder rates (±95% confidence interval) between this real‐world study and the SENZA‐RCT.
Overall, the patient populations in both studies were broadly similar in their primary indication of chronic back and leg pain. The Level I evidence provided by the SENZA‐RCT has been strengthened by the contribution of our real‐world data from a large cohort of patients across multiple international centers and is likely to reflect everyday clinical practice. The concomitant reduction in medication consumption found in both studies is potentially beneficial to patients as well as health care providers since it may reduce prescription costs and visits to pharmacy.
Limitations of this review are related to the real‐world setting and include its retrospective nature, lack of control group and use of non‐standardized measures for outcomes such as sleep. Data were not entered systematically across all centers and some patients may have been included in early follow‐ups, but not later ones, and vice‐versa. Both factors resulted in an inhomogeneous data set with a declining patient number throughout follow‐up. In addition, longitudinal data were available only for percentage pain relief. All other post‐implantation variables were collected during a single last visit assessment. The real‐world setting also prevented the collection of specific pain etiologies and implantation details as well as standardized measures of medication intake, quality of life, function, and sleep. For example, the simplified measures we used did not evaluate pain medication intake by class, quality of life parameters relating to health and physical or social activities, or assessment of sleep latency and quality. As such these results should be interpreted with caution.
Other limitations relate to our data analysis. Evaluating data as‐observed may overestimate response.26 In addition, given the non‐normal distribution of the data, nonparametric statistics with mixed model approach using study as a fixed categorical factor and period as a repeated categorical fixed factor may have been a better choice for longitudinal analysis of pain relief. However, because the data was collected in a real‐world setting and completely anonymized, pain relief data in a specified line could not be attributed to a single subject. Therefore, it was not possible to apply mixed model approach and only descriptive statistics could be used to analyze the data. Data distribution should be borne in mind while interpreting these results. Furthermore, evaluation of outcomes in patients with previously unsuccessful LF‐SCS requires a larger population of patients to allow adequate statistical analysis.
Finally, there were methodological differences related to study design and patient characteristics regarding the comparison of our responder rates to those reported in the SENZA‐RCT. For example, our study evaluated overall pain relief rather than separate back and leg pain relief (derived from VAS) as measured in the SENZA‐RCT. Our measure was a pragmatic choice to enable quick assessment of therapy effectiveness during routine follow‐up. Also, in our experience, percentage pain relief is a more straightforward concept to convey and understand in the real‐world setting compared with VNRS or VAS. In cases where back and leg pain were reported equal, back pain may have been slightly predominant, but not identified by our verbal questions.
Conclusions
The present study was designed to evaluate the real‐world effectiveness of HF‐SCS at 10 kHz in a large group of patients with chronic trunk and/or limb pain. Our retrospective analysis revealed that the therapy provided sustained and effective pain relief in >70% of the patients at all follow‐up time points. This result was consistent with a previously published randomized, controlled, trial. The majority of our patients also reported improved quality of life, function, and sleep, as well as satisfaction with therapy. Our review provides complementary evidence to support the treatment of chronic back and leg pain with HF‐SCS at 10 kHz.
Author Contributions
All the authors have reviewed and approved the final version of this manuscript. D. Edgar prepared the manuscript with unrestricted access to the data. Authors thank the contribution of M. Kowalska, M. Maneshi of Nevro Corp. for their assistance in data analysis and J.‐L. Marchal, InforStat Consultants, Belgium for help with statistical analysis.
Conflict of Interest
T. Stauss, G. Surges, D. Sayed, F. El Majdoub, W. S. Rosenberg, L. Kapural, R. Bundschu, A. Lalkhen, M. Maarouf and N. Patel are consultants to Nevro Corp., Redwood City, CA, USA. B. Gliner, J. Subbaroyan, and A. Rotte are employees of Nevro Corp., Redwood City, CA, USA. Funding was provided to Dr. Deborah Edgar in her capacity as a medical writer by Nevro Corp., Redwood City, CA, USA, for the preparation of this manuscript.
Funding Information
Nevro Corp.
Funding Statement
This work was funded by Nevro Corp grant .
References
- 1. International Association for the Study of Pain: Unrelieved pain is a major global healthcare problem. URL: https://s3.amazonaws.com/rdcms-iasp/files/production/public/Content/ContentFolders/GlobalYearAgainstPain2/20042005RighttoPainRelief/factsheet.pdf. Access date: 30th April 2018.
- 2. Goldberg DS, McGee SJ. Pain as a global public health priority. BMC Public Health 2011;6:770. [DOI] [PMC free article] [PubMed] [Google Scholar]
- 3. Henschke N, Kamper SJ, Maher CG. The epidemiology and economic consequences of pain. Mayo Clin Proc 2015;90:139–147. [DOI] [PubMed] [Google Scholar]
- 4. GBD 2016 Disease and Injury Incidence and Prevalence Collaborators . Global, regional, and national incidence, prevalence, and years lived with disability for 328 diseases and injuries for 195 countries, 1990–2016: a systematic analysis for the Global Burden of Disease Study 2016. Lancet 2017;390:1211–1259. [DOI] [PMC free article] [PubMed] [Google Scholar]
- 5. Thomson S. Failed back surgery syndrome – definition, epidemiology and demographics. Br J Pain 2013;7:56–59. [DOI] [PMC free article] [PubMed] [Google Scholar]
- 6. Thomson S, Jacques L. Demographic characteristics of patients with severe neuropathic pain secondary to failed back surgery syndrome. Pain Pract 2009;9:206–215. [DOI] [PubMed] [Google Scholar]
- 7. North RB, Kidd DH, Farrokhi F, Piantadosi SA. Spinal cord stimulation versus repeated lumbosacral spine surgery for chronic pain: a randomized, controlled trial. Neurosurgery 2005;56:98–106; discussion ‐7. [DOI] [PubMed] [Google Scholar]
- 8. Kumar K, Taylor RS, Jacques L, et al. Spinal cord stimulation versus conventional medical management for neuropathic pain: a multicentre randomised controlled trial in patients with failed back surgery syndrome. Pain 2007;132:179–188. [DOI] [PubMed] [Google Scholar]
- 9. Kapural L, Peterson E, Provenzano DA, Staats P. Clinical evidence for spinal cord stimulation for failed back surgery syndrome (FBSS): systematic review. Spine 2017;15(42 Suppl 14):S61–S66. [DOI] [PubMed] [Google Scholar]
- 10. Kupers RC, Van den Oever R, Van Houdenhove B, et al. Spinal cord stimulation in Belgium: a nation‐wide survey on the incidence, indications and therapeutic efficacy by the health insurer. Pain 1994;56:211–216. [DOI] [PubMed] [Google Scholar]
- 11. Ohnmeiss DD, Rashbaum RF, Bogdanffy GM. Prospective outcome evaluation of spinal cord stimulation in patients with intractable leg pain. Spine 1996;21:1344–1350; discussion 51. [DOI] [PubMed] [Google Scholar]
- 12. Alo KM, Redko V, Charnov J. Four year follow‐up of dual electrode spinal cord stimulation for chronic pain. Neuromodulation 2002;5:79–88. [DOI] [PubMed] [Google Scholar]
- 13. Cameron T. Safety and efficacy of spinal cord stimulation for the treatment of chronic pain: a 20‐year literature review. J Neurosurg 2004;100(3 Suppl Spine):254–267. [DOI] [PubMed] [Google Scholar]
- 14. Sears NC, Machado AG, Nagel SJ, et al. Long‐term outcomes of spinal cord stimulation with paddle leads in the treatment of complex regional pain syndrome and failed back surgery syndrome. Neuromodulation 2011;14:312–318; discussion 8. [DOI] [PubMed] [Google Scholar]
- 15. Kumar K, Hunter G, Demeria D. Spinal cord stimulation in treatment of chronic benign pain: challenges in treatment planning and present status, a 22‐year experience. Neurosurgery 2006;58:481–496; discussion ‐96. [DOI] [PubMed] [Google Scholar]
- 16. Provenzano DA, Amirdelfan K, Kapural L, Sitzman BT. Evidence gaps in the use of spinal cord stimulation for treating chronic spine conditions. Spine 2017;15(42 Suppl 14):S80–S92. [DOI] [PubMed] [Google Scholar]
- 17. Kuechmann C, Valine T, Wolfe DL. 853 could automatic position adaptive stimulation be useful in spinal cord stimulation? Eur J Pain 2009;13:S243. [Google Scholar]
- 18. Levy RM. Anatomic considerations for spinal cord stimulation. Neuromodulation 2014;17(Suppl 1):2–11. [DOI] [PubMed] [Google Scholar]
- 19. Kapural L, Yu C, Doust MW, et al. Comparison of 10‐kHz high‐frequency and traditional low‐frequency spinal cord stimulation for the treatment of chronic back and leg pain: 24‐month results from a multicenter, randomized. Controlled Pivotal Trial. Neurosurgery 2016;79:667–677. [DOI] [PMC free article] [PubMed] [Google Scholar]
- 20. Kapural L, Yu C, Doust MW, et al. Novel 10‐kHz high‐frequency therapy (HF10 therapy) is superior to traditional low‐frequency spinal cord stimulation for the treatment of chronic back and leg pain: the SENZA‐RCT randomized controlled trial. Anesthesiology 2015;123:851–860. [DOI] [PubMed] [Google Scholar]
- 21. Spieth PM, Kubasch AS, Penzlin AI, et al. Randomized controlled trials ‐ a matter of design. Neuropsychiatr Dis Treat 2016;12:1341–1349. [DOI] [PMC free article] [PubMed] [Google Scholar]
- 22. Frieden TR. Evidence for health decision making ‐ beyond randomized, controlled trials. N Engl J Med 2017;377:465–475. [DOI] [PubMed] [Google Scholar]
- 23. Price D, Bateman ED, Chisholm A, et al. Complementing the randomized controlled trial evidence base. Evolution not revolution. Ann Am Thorac Soc 2014;11(Suppl 2):S92–S98. [DOI] [PubMed] [Google Scholar]
- 24. Hayek SM, Veizi E, Hanes M. Treatment‐limiting complications of percutaneous spinal cord stimulator implants: a review of 8 years of experience from an academic center database. Neuromodulation 2015;18:603–608; discussion 8–9. [DOI] [PubMed] [Google Scholar]
- 25. Provenzano DA, Deer T, Luginbuhl Phelps A, et al. An international survey to understand infection control practices for spinal cord stimulation. Neuromodulation 2016;19:71–84. [DOI] [PubMed] [Google Scholar]
- 26. Amin M, No DJ, Darji K, Wu JJ. Interpreting clinical trial data. In: P. S. Yamauchi, ed. Biologic and Systemic Agents in Dermatology. pp. 27–36, 1st edn. Cham: Springer, 2018