Abstract
We showed previously that chondrogenic progenitor cells (CPCs) from the superficial zone of articular cartilage respond vigorously to cartilage wounding by responding chemotactically to cell debris, but the physiologic functions of CPCs remain unclear. To help bridge this knowledge gap we undertook a comparative analysis of gene expression in bovine CPCs, chondrocytes, synovial fibroblasts (synoviocytes), and cells isolated from synovial fluid (SFCs). Analysis of microarrays parsed the four cell types into two distinct groups, one composed only of chondrocytes and the other of CPCs, synoviocytes and SFCs. The groups differed with respect to metalloendopeptidase, collagen, and cytokine gene expression. Quantitative PCR showed that, relative to chondrocytes, all other cells under-expressed cartilage matrix genes. CPCs significantly over-expressed genes encoding the chemokines interleukin 8 (IL8), and C-C motif ligand 2, while synoviocytes over-expressed the chemokine C-X-C motif Ligand 12. Sulfated glycosaminoglycan deposition in pellet cultures by CPCs was intermediate between chondrocytes and synoviocytes/SFCs. These results indicate that the CPC phenotype more closely resembles synoviocytes and SFCs than chondrocytes. CPCs show a tendency to over-express chemokines that promote immune cell chemotaxis, suggesting they mediate inflammation in response to cartilage wounding.
Keywords: Chondrogenic progenitor cells (CPCs), Chondrocytes, Microarray, Gene expression
INTRODUCTION
Osteoarthritis (OA), a disease that features cartilage degeneration, is the most the widespread cause of disability worldwide.1 Factors that elevate the risk for OA include age, trauma, and long-term heavy loading.2 Diarthrodial joints are enclosed by a capsule lined with a highly vascularized synovial membrane that produces synovial fluid, the main source of nourishment and lubrication for articular cartilage.3
Although synovial fibroblasts support joint health under normal conditions, they contribute to the progression of arthritis by secreting pro-inflammatory cytokines and chondrolytic enzymes into synovial fluid.4; 5; 6 Cytokine levels may be further enhanced by migrating fibroblast-like cells, which can also overproduce pro-inflammatory cytokines and are more abundant in synovial fluid from osteoarthritic joints than in fluid from normal joints.7
Articular cartilage is comprised mostly of extracellular collagen and proteoglycans. The arrangement and amounts of these major structural components varies through the depth of cartilage matrix, which can be divided into zones.8 The uppermost superficial zone is specialized to maintain low friction between joint surfaces.9 Superficial zone cells are thought to be involved in the regulation of tissue development and growth, including morphogenesis of the diarthrodial joint,10 and the expression of many growth factors.11 Several investigations have identified a sub-population of progenitor cells in the superficial zone.12; 13; 14 These cells have been designated chondrogenic progenitor cells (CPCs) based largely on their ability to synthesize cartilage matrix under chondrogenic culture conditions.15 CPCs are enriched in damaged OA cartilage.16 Our previous studies revealed they are stimulated to proliferate and migrate in response to cartilage trauma by the pro-inflammatory alarmin high-mobility group box 1 (HMGB1).17 Trauma-activated CPCs on cartilage surfaces were fibroblastic or dendritic in appearance, making them morphologically distinct from spherical chondrocytes. In cell culture CPCs were more proliferative and clonogenic than chondrocytes from the same injured cartilage. CPCs also expressed higher levels of stem cell markers (ABCG2, CD 44, Notch1, etc.) than chondrocytes and CPC populations harbored greater numbers of Hoechst-dye excluding cells, a stem-related activity associated with ABCG2 expression.17
Collectively the findings described above suggest that CPCs may be more akin phenotypically and functionally to synoviocytes, which migrate and proliferate in response to joint injury, than to chondrocytes that stay relatively quiescent.18 To test this we used microarrays to profile global gene expression in CPCs and chondrocytes harvested from injured cartilage explants, synovial fibroblasts from joint capsules (synoviocytes), and cells isolated from joint fluid (SFCs).19 Hierarchical cluster analysis based on entire arrays was used to evaluate general phenotypic relationships among the cell types. Four groups of genes functionally related to OA (inflammation, cytokine, collagen, metalloendopeptidase) were singled out for closer inspection by cluster analysis. Real-time PCR was used to verify the differences in the expression of particular genes of interest. Proteoglycan deposition in pellet cultures was measured to assess the chondrogenic potential of each of the 4 cell types.
MATERIALS AND METHODS
Cartilage Harvesting and Culture
Fresh articular cartilage was harvested from bovine tibia plateaus of healthy stifle joints (Bud’s Meat, IA). The cartilage was then cultured in culture media (1:1 mixture of DMEM and F12, supplemented with 10% fetal bovine serum, 50 μg/ml L-ascorbate, 100 U/ml penicillin, 100 μg/ml streptomycin, and 2.5 μg/ml Fungizone).
Cell Isolation and Culture
All tissue digests and cell cultures were incubated at 37°C in a 5% O2, 5% CO2 atmosphere. Synovial fluid was obtained from the same bovine knee joints, and then 1:1 mixed with culture media. The synovium tissues were minced into smaller pieces (0.5cm × 0.5cm) to attach on a culture dish (Falcon, NJ). The culture media was added onto the synovium tissue drop by drop after couple hours of dry attachment. Added small amount of culture media on the following days until the synovium tissue was no longer attached. Synoviocytes and SFCs were collected for further use when the cells reach 80–90% confluence. CPCs and chondrocytes were isolated as previously described.17 Briefly, a sterile needle was dragged on the cartilage surface of each explant to create multiple matrix tears. After 7–10 days explants were treated with 0.25% Trypsin-EDTA (GIBCO, NY) for 10 minutes to isolate CPCs, culture media was then added to end trypsinization. Cell suspensions were centrifuged at 2000rpm for 10mins, and then seeded the cells in flasks (Corning, NY). After isolation of CPCs, the whole thickness of cartilage tissue was shaved off and minced into smaller pieces and serially digested in 0.4% protease (Sigma) dissolved in serum-free media for 1.5 hrs and 0.02% collagenase (Sigma) for 16 hrs. The next day, centrifuged the digestion media (2000rpm for 10mins), resuspended with culture media and seeded the cells into flasks.
RNA Extraction
The RNA for gene expression analysis was isolated from passage two of four different kinds of cells (CPCs, Chondrocytes, synoviocytes and SFCs) using TRIzol reagent (Invitrogen, CA) and RNeasy Mini Kit (Qiagen, CA) according to the manufacturer’s instructions.
Gene Expression Analysis
RNA (50ng) harvested from three independent batches of synoviocytes, SFCs, Chondrocytes, two independent batches of CPCs was analyzed using Affymetrix Bovine Genome Arrays as previously described.17 Statistical fold change expression was applied via 1-way analysis of variance (ANOVA) model using Method of Moments.20 Fisher’s Least Significant Difference (LSD) was used as the contrast method. Hierarchical cluster analysis was generated using Partek Genomics Suite software. Quantitative PCR (qPCR) reactions were performed as previously described using custom specific primers purchased from Integrated DNA Technologies (Coralville, IA) (Table 1). All qPCR experiments were performed in triplicate. β-actin was used as a reference gene. Fold change was calculated by the 2−ΔΔCt method.
TABLE 1:
Primer information for quantitative real-time PCR
| Gene | Forward primer 5’–3’ | Reverse primer 5’–3’ |
|---|---|---|
| β-actin | TCGACACCGCAACCAGTTCGC | CATGCCGGAGCCGTTGTCGA |
| Collagen II | AAGACGCAGAGCGCTGCTGG | GGGTCTCTACCGCGCCCTCA |
| Aggrecan | CAGCCAGGCCACCCTAGAG | GGGTGTAGCGCGTGGAGAT |
| Link Protein | ACTTCTTCTGGTGCTGATT | CTGTAGGGTCTCGGTAAA |
| COMP | TTCGGAACGCACTGTGG | TGCAGGAACCAGCGGTA |
| SOX9 | ACGCCGAGCT CAGCAAGA | CACGAACGGCCGCCTCT |
| RUNX2 | CGCACCGACAGCCCCAACTT | CTTGAAGGCCACGGGCAGGG |
| IL6 | GGCTGCTCCTGGTGATGACT | CTCCTTGCTGCTTTCACACTCA |
| IL8 | CCACACCTTTCCACCCCAAA | CCTTGGGGTTTAGGCAGACC |
| CCL2 | TCGCTGCAACATGAAGGTCT | TATAGCAGCAGGCGAC T TG G |
| CXCL12 | GCTCCACGTAGAACTGCCAT | AGGGAGAGGCTG GGA AT GAT |
Sulfated Glycosaminoglycan (sGAG) Assay
Pellets (0.25×10⁶ cells per pellet, n=3 per cell type) were cultured under chondrogenic condition (Serum free media supplemented with 10ng/ml TGF-β1 and 0.1μM dexamethasone) for 5 days to assay the sGAG content which were using the dimethylmethylene blue assay essentially as described.21 sGAG content was normalized to the DNA content of each pellet (μg sGAG/μg DNA) which was measured using a Quant-iT ™ PicoGreen® dsDNA Kit (Invitrogen, CA).
Statistical Analysis
One-way analysis of variance (ANOVA) through SPSS software version 21 (SPSS, Sigma Stat) and Tukey’s post hoc test was used to evaluate the effects of cell type on gene expression. A p value less than 0.05 was considered significant.
RESULTS
Microarray analysis
Gene Expression Profiling of Chondrocytes, CPCs, SFCs and Synoviocytes
Over 24,000 genes were found and processed in the chip designed for the bovine species. These results showed that, versus CPCs, chondrocytes significantly over-expressed cartilage matrix markers such as Collagen ІІ (COL2A1), Aggrecan (ACAN), artilage Oligomeric Matrix Protein (COMP) and Hyaluronan and Proteoglycan Link Protein (HAPLN) (20.5-fold, 5.9-fold, 76.9-fold and 1.8-fold, respectively). The same gene expression pattern appeared in chondrocytes versus SFCs (15.4-fold, 29.1-fold, 180-fold and 221-fold, respectively) and chondrocytes versus synoviocytes (16.1-fold, 39.1-fold, 145-fold and 433-fold, respectively).
Genes related to inflammation, Interleukin 6 (IL6), IL 8, Chemokine (C-C motif) ligand 2 (CCL2), Chemokine (C-X-C motif) Ligand 12 (CXCL12), were all up-regulated in CPCs compared to chondrocytes (225-fold, 9.7-fold, 32.3-fold and 12.1 fold, respectively). Similar fold changes compared with chondrocytes were observed for both SFCs (84.6-fold, 17.2 fold, 50-fold and 4.8-fold, respectively) and synoviocytes (33-fold, 15-fold, 51.6-fold and 10.8-fold, respectively).
Heat Maps and Hierarchical Cluster Analysis
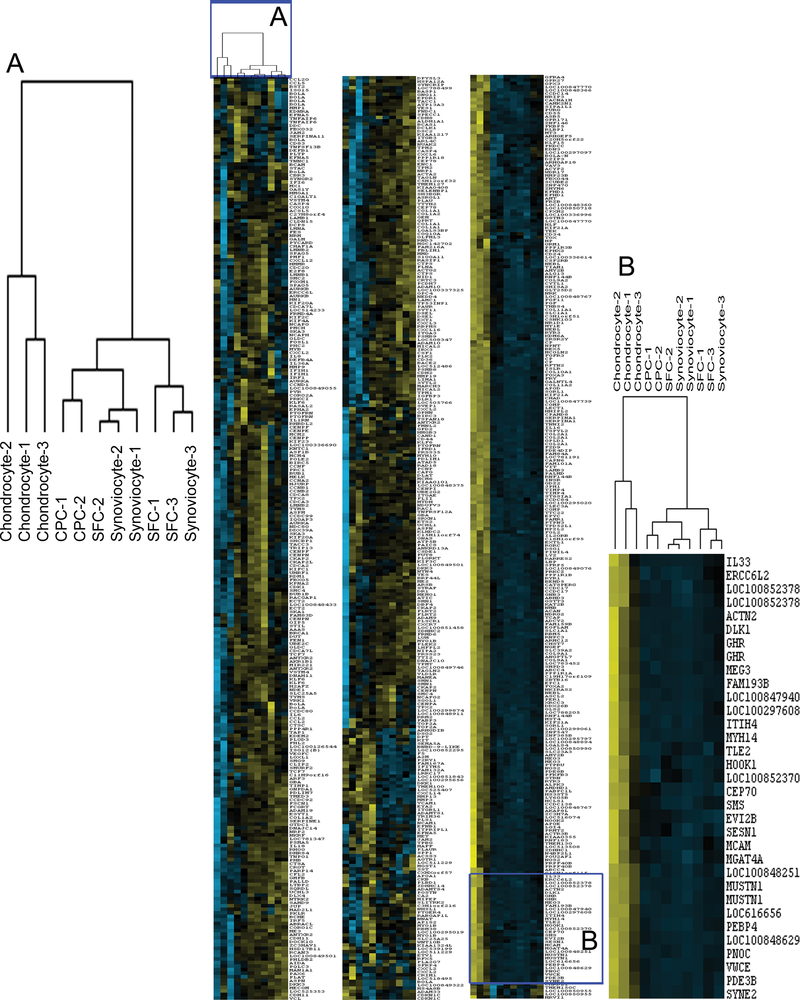
A global gene heat map representing all four cell types were generated based on genes expressed at levels that were five-fold higher or lower in CPCs than chondrocytes. Considering the overall gene expression pattern of chondrocytes, CPCs, SFCs and synoviocytes, the global 5-fold based heat map clearly showed that the CPCs are remarkably different when compared to chondrocytes and similar when compared to SFCs and synoviocytes (Fig. 1).
Figure 1.
Global heat map and hierarchical cluster analysis of chondrocytes, CPCs, synoviocytes and SFCs. The 5-fold change based global heat map revealed the enormous difference between chondrocytes and CPCs as well as to show the similarities among CPCs, synoviocytes and SFCs (specific region was enlarged in B). The hierarchical cluster analysis showed the similarities among four cell types and directly divided all cell types into two major categories (chondrocytes and the other combined cell types) (A).
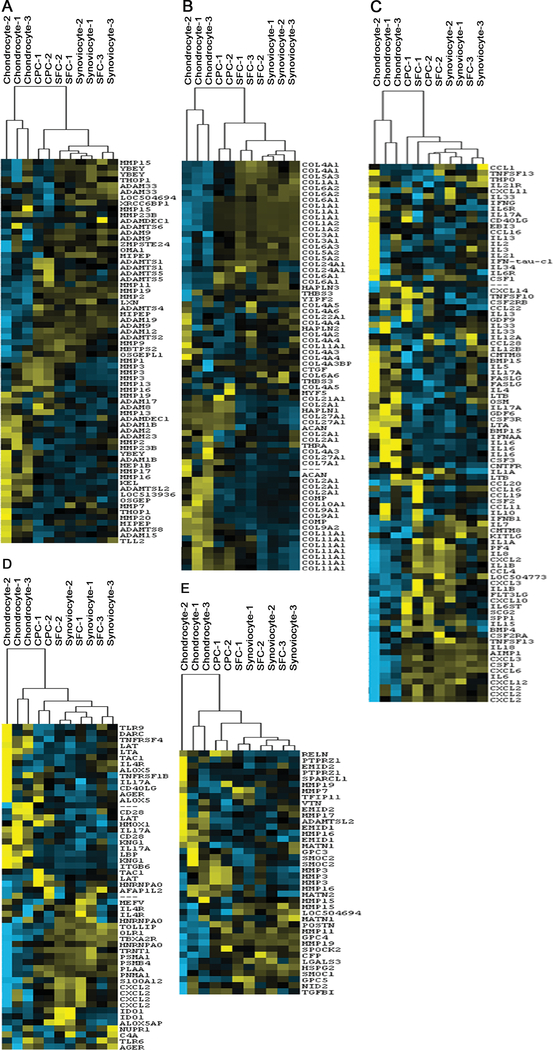
Five annotated heat maps (collagen, cytokine, extracellular, inflammatory and metalloendopeptidase) were generated based on the genes that are functionally filtered by the annotations of the gene database (Fig. 2). Despite some exceptions for specific genes, almost all the five heat maps showed that CPCs, SFCs, and synoviocytes were distinct from chondrocytes.
Figure 2.
Annotated heat maps based on various gene functions. Five gene function based annotated heat maps (A. metalloendopeptidase, B. collagen, C. cytokine, D. inflammatory, E. extracellular) exhibited the differences among four cell types.
Quantitative Real-time PCR Validation of Microarray Results
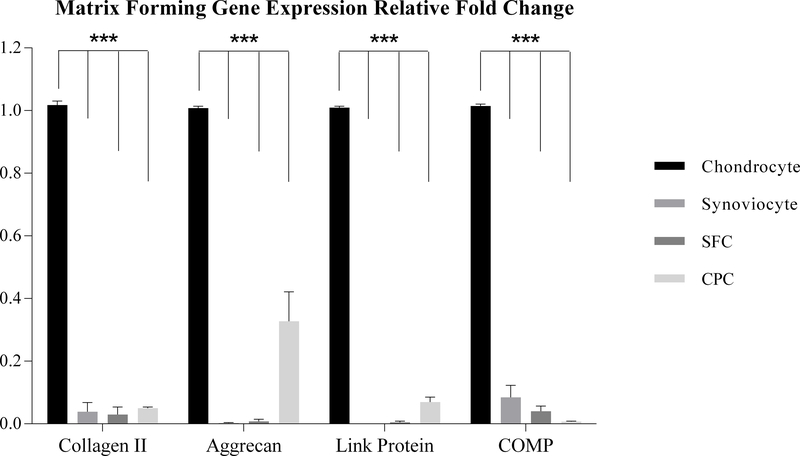
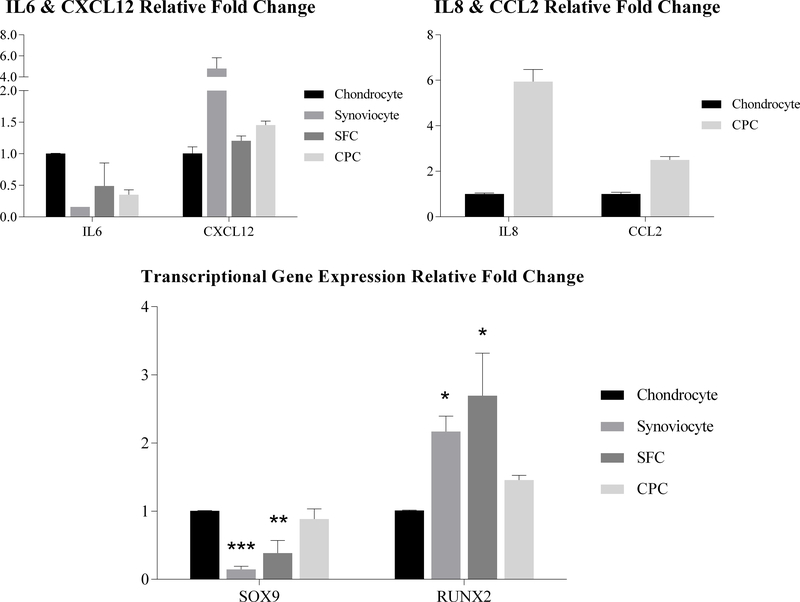
qPCR was performed and analyzed in order to validate the expression profiles determined by microarray analysis. Gene expression analysis exhibited dramatically lower expression of matrix forming marker genes in CPCs, synoviocytes, and SFCs compared to chondrocytes. Collagen ІІ expression in chondrocytes was 26-fold higher than synoviocytes, 34-fold higher than SFCs and 20-fold higher than CPCs. Aggrecan expression in chondrocytes was 368-fold higher than synoviocytes, 129-fold higher than SFCs and 3-fold higher than CPCs. Link Protein expression in chondrocytes was more than 10000-fold higher than synoviocytes, 215-fold higher than SFCs and 14-fold higher than CPCs. COMP expression in chondrocyte was 12-fold higher than synoviocytes, 25-fold higher than SFCs and 138-fold higher than CPCs (Fig. 3). For the transcriptional marker genes, SOX9 expression showed similar gene expression trend when compared to the matrix forming marker genes. Chondrocytes were 7-fold higher than synoviocytes, 2.6-fold higher than SFCs, and there was no significant difference between chondrocytes and CPCs (Fig. 4).
Figure 3.
Matrix forming gene expression analysis. qPCR showed substantially higher expression of all matrix forming genes (Collagen ΙΙ, Aggrecan, Link protein and COMP) in chondrocytes than in other three cell types. (*: p<0.05; **: p<0.01; ***: p<0.001)
Figure 4.
Inflammatory and transcriptional gene expression analysis. qPCR exhibited dramatically lower expression of most inflammatory related genes (IL8, CCL2 and CXCL12) in chondrocytes than in the other three cell types. Chondrocytes showed significantly up-regulated expression over synoviocytes and SFCs and significantly down-regulated expression of synoviocytes and SFCs in the context of SOX9 and RUNX2, respectively. (*: p<0.05; **: p<0.01; ***: p<0.001)
In addition, qPCR results showed the inflammatory gene expression in chondrocytes was down-regulated compared to CPCs, SFCs and synoviocytes. These results were fairly consistent with microarray data, except for the expression of IL6. IL6 expression in chondrocytes was 6.36-fold over synoviocytes, 2.05-fold over SFCs and 2.86-fold over CPCs. IL8 expression in chondrocytes was dramatically down-regulated, 0.0085-fold of synoviocytes, 0.0005-fold of SFCs and 0.122-fold of CPCs. CCL2 expression in chondrocytes was 0.012-fold of synoviocytes, 0.003-fold of SFCs and 0.402-fold of CPCs. CXCL12 expression in chondrocytes was 0.21-fold of synoviocytes, 0.835-fold of SFCs and 0.69-fold of CPCs. Meanwhile, IL6 expression in CPCs was 2.23-fold over synoviocytes and 0.72-fold of SFCs. IL8 expression in CPCs was 0.07-fold of synoviocytes, 0.005-fold of SFCs. CCL2 expression in CPCs was 0.03-fold of synoviocytes and 0.008-fold of SFCs. CXCL12 expression in CPCs was 0.3-fold of synoviocytes and 1.21-fold over SFCs (Fig. 4).
Sulfated Glycosaminoglycan (sGAG) Assay
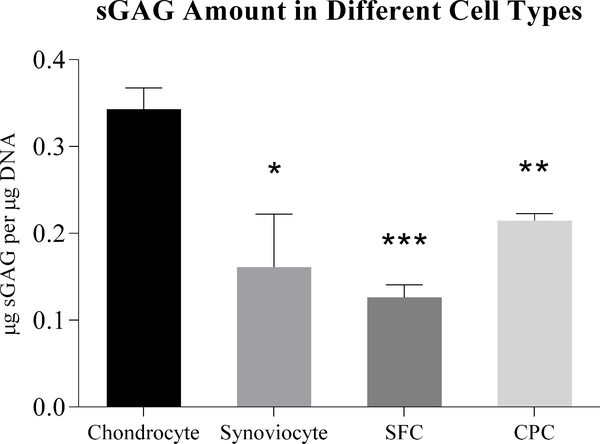
The sGAG/DNA (μg sGAG/μg DNA) level in chondrocytes is around 0.34 units, and 0.21 units in CPCs. A significant decrease (37.4%) did exist in the comparison between CPCs and chondrocytes (p<0.05). As expected, the sGAG/DNA level in both SFCs and synoviocytes, 0.13 units and 0.16 units, respectively, were dramatically lower (63.2% and 53.0%, respectively) than chondrocytes (p<0.001 in SFCs and p<0.01 in synoviocytes). There is no significant difference both in the comparison of the sGAG/DNA between CPCs and SFCs and the comparison between CPCs and synoviocytes. This reveals that chondrocytes contain the highest glycosaminoglycan contents, while CPCs stay in the same level with SFCs and synoviocytes (Fig. 5).
Figure 5.
sGAG assay of chondrocytes, CPCs, SFCs and synoviocytes. sGAG assay legibly demonstrated the glycosaminoglycan contents in each cell type, revealing that chondrocytes contain the highest amount, and significant differences exist when comparing chondrocytes to the other cell types. (*: p<0.05; **: p<0.01; ***: p<0.001)
DISCUSSION
Microarray analysis confirmed that CPCs from cartilage are a distinctive cell population that more resembles synovial fluid cells and fibroblasts than chondrocytes. Hierarchical clustering analysis straightforwardly divided all the cell types into chondrocyte and non-chondrocyte phenotypes. Annotated heat maps of selected functional classes of genes that are relevant to OA yielded essentially the same conclusion as the global heat map.
For the most part, qPCR analysis validated microarray results for ECM-related and inflammation-related genes. Chondrocytes showed significantly higher expression of cartilage-specific ECM genes and lower expression of pro-inflammatory genes than the other three cell types. The groups indicated by overall differences in gene expression and by the expression of specific ECM and inflammatory genes paralleled differences in the expression of SOX9, a key chondrogenic transcriptional factor that was expressed at high, moderate, and low levels by chondrocytes, CPCs, and synoviocyte/SFCs respectively. One notable exception to the concordance between microarrays and qPCR was that IL6 expression was substantially higher in chondrocytes than CPCs, SFCs and synoviocytes when measured by qPCR, but substantially lower when measured by microarray. This difference may reflect deficiencies in the ability of the probes used in the microarrays to detect IL6 mRNA splice variants expressed by chondrocytes.22
The sGAG assay was applied to measure differences in chondrogenic potential among the four cell types. The results were fairly consistent with the gene expression data that chondrocytes showed by far the highest expression of cartilage ECM genes and deposited the most sGAG, while dramatically lower ECM gene expression in SFCs and synoviocytes was accompanied by weak sGAG deposition and the intermediate amounts of sGAG produced by CPCs corresponded with intermediate cartilage ECM gene expression.
We previously documented that migrating CPCs make and deposit lubricin (AKA superficial zone protein) on damaged cartilage surfaces,17 an activity reminiscent of superficial zone chondrocytes. In addition, the relatively weak proteoglycan deposition in CPC pellet cultures is consistent with superficial chondrocytes, which also show low activity compared with cells isolated from the deeper zones of cartilage.23 These findings, together with similarities in the expression of some CD markers, suggest that CPCs share more in common with superficial zone chondrocytes than with deep zone chondrocytes.24 However, many of the similarities may reflect the well-documented enrichment of CPCs in the superficial zone of normal cartilage.25; 26 We speculate that CPCs, which originally reside in the superficial zone, migrate onto the cartilage surface and proliferate upon activation by injury.
In summary, our findings have important implications for how CPCs might function in vivo. The CPCs studied here were distinctly inferior to chondrocytes with respect to cartilage matrix formation, an indication that CPCs are not particularly well-suited for matrix regeneration. Instead, it appears that CPCs are more likely to function as part of an alarmin initiated pro-inflammatory cascade in acutely injured joints.27 In particular, the strong chemokine overexpression by CPCs in response to HMGB1 suggests that they are capable of strongly amplifying pro-inflammatory signals arising from damaged cartilage. To what extent this process contributes to synovitis in injured joints remains to be seen.
ACKNOWLEDGMENTS
This work was supported by the National Institutes of Health (CORT NIH P50 AR055533), by the Department of Defense (W81XWH-10–1-0702a), and by a grant from the American Arthritis Society. We sincerely thank Barbara Laughlin, John Bierman, and Abigail Smith for the acquisition of the cow stifles and osteochondral explants.
REFERENCES
- 1.Brooks PM. 2002. Impact of osteoarthritis on individuals and society: how much disability? Social consequences and health economic implications. Current opinion in rheumatology 14:573–577. [DOI] [PubMed] [Google Scholar]
- 2.Martin JA, Brown TD, Heiner AD, et al. 2004. Chondrocyte senescence, joint loading and osteoarthritis. Clinical orthopaedics and related research:S 96–103. [DOI] [PubMed] [Google Scholar]
- 3.Wolf J 1975. Blood supply and nutrition of articular cartilage. Folia morphologica 23:197–209. [PubMed] [Google Scholar]
- 4.Villiger PM, Terkeltaub R, Lotz M. 1992. Production of monocyte chemoattractant protein-1 by inflamed synovial tissue and cultured synoviocytes. Journal of immunology 149:722–727. [PubMed] [Google Scholar]
- 5.Winchester R, Su F, Ritchlin C. 1993. Alteration of synoviocytes by inflammation--the source of a persistent non-immunologic drive in synovitis: analysis of levels of mRNA expression by a simple multi-gene assay. Clinical and experimental rheumatology 11 Suppl 8:S87–90. [PubMed] [Google Scholar]
- 6.Haslauer CM, Elsaid KA, Fleming BC, et al. 2013. Loss of extracellular matrix from articular cartilage is mediated by the synovium and ligament after anterior cruciate ligament injury. Osteoarthritis and cartilage / OARS, Osteoarthritis Research Society. [DOI] [PMC free article] [PubMed] [Google Scholar]
- 7.Serre G, Vincent C, Mauduyt MA, et al. 1984. Morphologic, quantitative and cytoenzymologic studies of synoviocytic and monocytic cells in synovial fluid. Analytical and quantitative cytology 6:227–237. [PubMed] [Google Scholar]
- 8.Thonar EJ, Buckwalter JA, Kuettner KE. 1986. Maturation-related differences in the structure and composition of proteoglycans synthesized by chondrocytes from bovine articular cartilage. The Journal of biological chemistry 261:2467–2474. [PubMed] [Google Scholar]
- 9.Nugent GE, Aneloski NM, Schmidt TA, et al. 2006. Dynamic shear stimulation of bovine cartilage biosynthesis of proteoglycan 4. Arthritis and rheumatism 54:1888–1896. [DOI] [PubMed] [Google Scholar]
- 10.Ward AC, Dowthwaite GP, Pitsillides AA. 1999. Hyaluronan in joint cavitation. Biochemical Society transactions 27:128–135. [DOI] [PubMed] [Google Scholar]
- 11.Archer CW, Morrison H, Pitsillides AA. 1994. Cellular aspects of the development of diarthrodial joints and articular cartilage. Journal of anatomy 184 ( Pt 3):447–456. [PMC free article] [PubMed] [Google Scholar]
- 12.Joos H, Wildner A, Hogrefe C, et al. 2013. Interleukin-1 beta and tumor necrosis factor alpha inhibit migration activity of chondrogenic progenitor cells from non-fibrillated osteoarthritic cartilage. Arthritis research & therapy 15:R119. [DOI] [PMC free article] [PubMed] [Google Scholar]
- 13.Williams R, Khan IM, Richardson K, et al. 2010. Identification and clonal characterisation of a progenitor cell sub-population in normal human articular cartilage. PloS one 5:e13246. [DOI] [PMC free article] [PubMed] [Google Scholar]
- 14.Grogan SP, Miyaki S, Asahara H, et al. 2009. Mesenchymal progenitor cell markers in human articular cartilage: normal distribution and changes in osteoarthritis. Arthritis research & therapy 11:R85. [DOI] [PMC free article] [PubMed] [Google Scholar]
- 15.Prockop DJ. 1997. Marrow stromal cells as stem cells for nonhematopoietic tissues.Science 276:71–74. [DOI] [PubMed] [Google Scholar]
- 16.Alsalameh S, Amin R, Gemba T, et al. 2004. Identification of mesenchymal progenitor cells in normal and osteoarthritic human articular cartilage. Arthritis and rheumatism 50:1522–1532. [DOI] [PubMed] [Google Scholar]
- 17.Seol D, McCabe DJ, Choe H, et al. 2012. Chondrogenic progenitor cells respond to cartilage injury. Arthritis and rheumatism 64:3626–3637. [DOI] [PMC free article] [PubMed] [Google Scholar]
- 18.Garcia-Arnandis I, Guillen MI, Gomar F, et al. 2010. High mobility group box 1 potentiates the pro-inflammatory effects of interleukin-1beta in osteoarthritic synoviocytes. Arthritis research & therapy 12:R165. [DOI] [PMC free article] [PubMed] [Google Scholar]
- 19.Stoughton RB. 2005. Applications of DNA microarrays in biology. Annual review of biochemistry 74:53–82. [DOI] [PubMed] [Google Scholar]
- 20.Eisenhart C 1947. The assumptions underlying the analysis of variance. Biometrics 3:1–21. [PubMed] [Google Scholar]
- 21.Seol D, Choe H, Ramakrishnan PS, et al. 2013. Organ culture stability of the intervertebral disc: rat versus rabbit. Journal of orthopaedic research : official publication of the Orthopaedic Research Society 31:838–846. [DOI] [PubMed] [Google Scholar]
- 22.Denessiouk KA, Denesyuk AI, Johnson MS. 2008. Negative modulation of signal transduction via interleukin splice variation. Proteins 71:751–770. [DOI] [PubMed] [Google Scholar]
- 23.Schuurman W, Gawlitta D, Klein TJ, et al. 2009. Zonal chondrocyte subpopulations reacquire zone-specific characteristics during in vitro redifferentiation. The American journal of sports medicine 37 Suppl 1:97S–104S. [DOI] [PubMed] [Google Scholar]
- 24.Grogan SP, Duffy SF, Pauli C, et al. 2013. Zone-specific gene expression patterns in articular cartilage. Arthritis and rheumatism 65:418–428. [DOI] [PMC free article] [PubMed] [Google Scholar]
- 25.Hattori S, Oxford C, Reddi AH. 2007. Identification of superficial zone articular chondrocyte stem/progenitor cells. Biochemical and biophysical research communications 358:99–103. [DOI] [PMC free article] [PubMed] [Google Scholar]
- 26.Dowthwaite GP, Bishop JC, Redman SN, et al. 2004. The surface of articular cartilage contains a progenitor cell population. Journal of cell science 117:889–897. [DOI] [PubMed] [Google Scholar]
- 27.Sokolove J, Lepus CM. 2013. Role of inflammation in the pathogenesis of osteoarthritis: latest findings and interpretations. Therapeutic advances in musculoskeletal disease 5:77–94. [DOI] [PMC free article] [PubMed] [Google Scholar]


