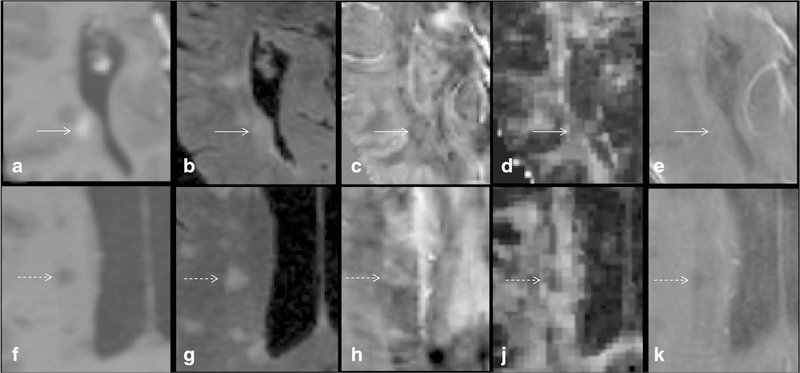
Fig. 4.
Contrast-enhanced T1W (a), T2-FLAIR (b), QSM (c), FA (d), and R2* (e) images of an acute-enhancing MS lesion (solid arrow) are shown. For comparison, a more chronic non-enhancing lesion shows (dashed arrow; f, g, h, i, j, k) increased susceptibility (0.0492 ppm versus − 0.0153 ppm) predominantly within the periphery of the lesion with decreased FA (0.272 versus 0.325) and R2* (8.74 Hz versus 19.8 Hz)

