Abstract
Congenital obstructive nephropathy is a major cause of chronic kidney disease in children. The contribution of changes in the identity of renal cells to the pathology of obstructive nephropathy is poorly understood. Using a partial unilateral ureteral obstruction model in genetically modified neonatal mice, we traced the fate of cells derived from the renal stroma, cap mesenchyme, ureteric bud epithelium and podocytes using Foxd1Cre, Six2Cre, HoxB7Cre and Podocyte.Cre mice respectively, crossed with double fluorescent reporter (mT/mG) mice. Persistent obstruction leads to a significant loss of tubular epithelium, rarefaction of the renal vasculature and decreased renal blood flow. In addition, Foxd1-derived pericytes significantly expanded in the interstitial space, acquiring a myofibroblast phenotype. Degeneration of Six2 and HoxB7-derived cells resulted in significant loss of glomeruli, nephron tubules and collecting ducts. Surgical release of obstruction resulted in striking regeneration of tubules, arterioles, interstitium accompanied by an increase in blood flow to the level of sham animals. Contra-lateral kidneys with remarkable compensatory response to kidney injury showed an increase in density of arteriolar branches. Deciphering the mechanisms involved in kidney repair and regeneration post relief of obstruction has potential therapeutic implications for infants and children and the growing number of adults suffering from chronic kidney disease.
Keywords: Obstructive nephropathy, lineage tracing, renal progenitors, nephrovascular development and kidney regeneration
Introduction
Obstructive nephropathy, the leading cause of chronic kidney disease (CKD) in children, begins during embryonic and fetal development of the urinary tract [1–3]. Prolonged obstruction along the urinary tract results in marked morphological and pathological changes in the developing kidney, affecting its normal development and function. Pediatric patients with congenital obstructive nephropathy generally require surgical intervention and careful post-surgical management to minimize renal injury. Indications and timing for surgical intervention are highly controversial, and the procedure may still fail to prevent progressive loss of renal function even when surgical release is performed in utero. There is therefore an urgent need to understand the cellular and molecular mechanisms involved in kidney repair and develop new treatments to avoid end stage renal diseases in these infants and children.
To simulate human congenital urinary tract obstruction in utero, animal models of reversible variable partial unilateral ureteral obstruction (pUUO) have been developed [4–9]. In humans, nephrogenesis is completed prior to full term birth, [10] but in rats and mice most nephrons are formed during the first week of post-natal life [11–13]. Mid gestation obstructive nephropathy in the human fetus is modeled by pUUO in the newborn mouse, in which relief of obstruction at 7 days results in improvement of renal architecture and function [14]. This model was therefore chosen to explore the mechanisms promoting kidney repair and regeneration. Significant remodeling of kidney architecture following the release of obstruction is likely to involve changes in cell fate. Therefore, using genetic labeling we investigated the morphological and cell fate changes that occur in the vascular, tubular and interstitial compartments during neonatal pUUO and after its release in mice.
Experimental Methods
Mice and Animal surgery
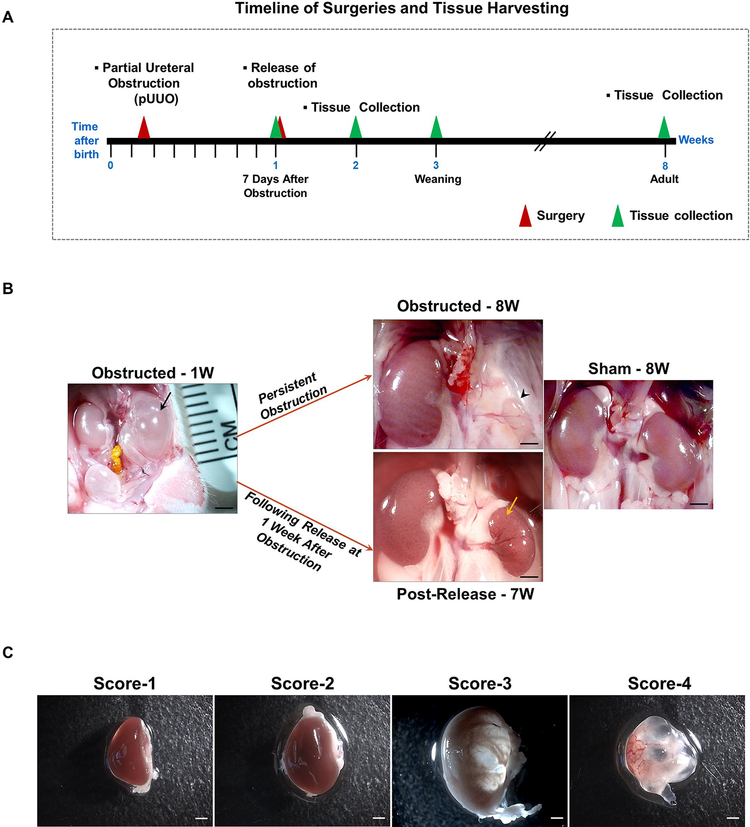
To trace the lineage of stromal, cap-mesenchyme, podocyte and ureteric bud (UB) derived cells, we crossed Foxd1-GFP-Cre (Foxd1Cre [15]); Six2-TGCtg (Six2Cre [16]); PodocyteCre (generated in our lab, full details of its generation and characterization will be documented elsewhere [RAG and MLSSL unpublished data]) and Hoxb7Cre [17] respectively with double fluorescent mT/mG Cre reporter mice [18]. Pups derived from these crosses were subjected to pUUO (n=170) or sham operation (n=76) at 24–48h following birth (Figure 1A). Partial obstruction was created by means of a ligature tied around the ureter apposed to a 3–4mm length of 0.2mm thickness stainless steel wire and the wire was removed after the ligation. A second surgery was performed at 1 week after obstruction (WO) only for some animals to release the obstruction [5]. Tissues were collected at 1, 3 and 8 WO or at 1, 2 and 7 weeks after release (WR). A second surgery was performed at 1 WO only for some animals (n=75) to release the knot created around the ureter and the obstruction was maintained for the rest of them. India ink was injected into the kidneys to check for ureteral patency. We scored the kidneys at the time of harvest according to the degree of hydronephrosis to evaluate the extent of damage due to obstruction and the reduction in hydronephrosis post-release. The scoring was in the scale of hydronephrosis index 1–4 (Figure 1C): 1- Kidneys normal in appearance; 2- Kidneys appear hydronephrotic (i.e. distended), but without obvious translucent areas; 3- Kidneys are distended with obvious translucent areas, but retain significant remaining parenchyma; 4- Very severe hydronephrosis with little if any remaining parenchyma [5]. Morphometric analyses were done by measuring the body weight of the sham and surgery animals at 0, 1, 2, 3 and 8 weeks and kidney weight at the time of tissue collection at 1, 3 and 8 WO; 1, 2 and 7 weeks after release (WR).
Figure 1. Release of obstruction significantly resolves the renal damage due to obstruction:
(A) Partial ureteral obstruction was created in left kidneys of newborn mice within the first 48h after birth. The obstruction was released at 1 week for some of them. Tissues were collected at 1, 3 and 8 WO and 1, 2 and 7 WR. (B) In some of the animals partial ureteral obstruction even for 1 week (W) resulted in severe hydronephrotic, fluid filled kidneys (black arrow). With persistent ipsilateral ureteral obstruction, the kidneys deteriorated and degenerated further leading to arrested growth and atrophy (arrow head). By contrast, relief of obstruction at seven days resulted in decreased hydronephrosis and remarkable kidney remodeling (yellow arrow). Scale bars, 2mm. (C) To assess the extent of obstruction injury, kidneys were scored for the severity of hydronephrosis at the time of release and tissue harvest in a scale of 1–4. Score1-Kidneys normal in appearance; 2-Kidneys appear hydronephrotic (i.e. distended), but without obvious translucent areas; 3-Kidneys are distended with obvious translucent areas, but retain significant remaining parenchyma; 4-Very severe hydronephrosis with little if any remaining parenchyma [5]. Scale bars, 1mm.
All procedures were performed in accordance to the Guidelines for the Care and Use of Laboratory Animals published by the United States National Institutes of Health (https://grants.nih.gov/grants/olaw/guide-for-the-care-and-use-of-laboratory-animals.pdf) and were approved by the University of Virginia Animal Care and Use Committee.
Histology and Immunostaining
Animals were anesthetized with tribromoethanol at 1, 3 and 8 WO and 1, 2 and 7 WR. Kidneys were removed, weighed, and either fixed in 2% paraformaldehyde (PFA) for one hour at 4° C for frozen sections or in Bouin’s fixative overnight for paraffin sections. 5–10 μm sections from paraffin embedded or cryo fixed tissues were used for histological analysis. Bouin’s fixed paraffin kidney sections from 1 week old animals were stained with Hematoxylin & Eosin to analyze the vascular structures. Fibrotic damage was checked using Masson’s trichrome staining [19]. Oil red staining was used to assess lipid accumulation [20]. Immunostaining was performed as previously described [21] using the following antibodies with a minimum of three replicates in each of the treatment groups (Sham, pUUO and pUUO+Release): anti- α-SMA (1:10,000, mouse monoclonal isotype Ig2a; catalog number: A2547, Sigma, St. Louis, MO), to detect cells expressing α-smooth muscle actin including myofibroblasts, anti-PDGFRβ (Platelet-derived growth factor receptor beta-1:100, Rabbit monoclonal, catalog number: 3169, Cell signaling) to identify the interstitial pericytes. Kidney sections were stained with biotinylated Lotus tetragonolobus lectin (1:50, catalog number: B1325, Vector Laboratories, Burlingame, CA, USA) for identification of proximal tubules and Lc3BII to detect autophagy in the tubular epithelium (1:200, Rabbit polyclonal, catalog number: 2775, Cell signaling). Anti-PECAM (1:1000, Rabbit Polyclonal, catalog number: sc-1506-R, Santa Cruz) was used to label endothelial cells, anti-Laminin (1:500, Rabbit polyclonal, catalog number: L9393, Sigma) and anti-acetylated alpha tubulin (1:10000, mouse monoclonal, catalog number: T6793, Sigma) to analyze the primary cilia status in the tubular epithelium, anti-HO1 (1:400, Rabbit, Polyclonal, catalog number: SPA-896, EnzoLife Sciences), anti-4 Hydroxynonenal (1:300, Rabbit Polyclonal, catalog number: ab46545, abcam), anti-Hif1α (1:600, Rabbit polyclonal, catalog number: GTX127309, GeneTex) and anti-Hif2α (1:800, Mouse monoclonal, catalog number: GTX30123, GeneTex) to assess renal oxidative stress and hypoxia, anti phosphohistone H3 (1:200, Rabbit polyclonal, catalog number: 9701, cell signaling) to identify mitotic cells, anti-Nanog (1:100, Rabbit polyclonal, catalog number: ab84447, abcam) and anti-Oct-4 (1:250, Rabbit polyclonal, catalog number: ab19857, abcam) (embryonic stem cell markers) to detect the potential of de-differentiation in the process of tissue repair post-obstruction. For immunofluorescence, secondary antibodies Alexa Fluor 350 Goat anti-mouse IgG (H+L) (α-SMA), Alexa Fluor 568 Donkey anti-mouse IgG (H+L) (Acetylated α-tubulin), Alexa Fluor 488 Donkey anti-rabbit (Laminin), Alexa Fluor 350 Goat anti-rabbit (1:500), streptavidin conjugated Alexa Fluor 350 (lotus lectin −1:500 dilution; Life Technologies, Carlsbad, CA) were used. Immunostaining using DAB was performed with the appropriate Vectastain ABC kits (Vector Laboratories, Burlingame, CA).
Quantification of renal progenitor cells and their progeny in kidney damage and repair
Imaging of GFP+ cells on kidneys from various tissue specific Cre lines was done using a Leica DFC310 FX digital camera connected to a Leica DFC 480 microscope and quantification of GFP positive interstitial and collecting duct areas using Image J software (National Institutes of Health).
Measurement of the GFP+ positive interstitial and collecting duct areas
Kidney sections from Foxd1Cre; mTmG mice were imaged for quantifying changes in the GFP+ interstitial cells. To measure only the expanded GFP+ interstitial cells, the additional GFP+ structures in the image such as glomeruli and major arteries were removed for quantification. The GFP+ interstitial area was normalized for the total kidney area of each image and expressed as percent area fraction:
Kidney sections from HoxB7Cre;mTmG mice were imaged as described above to measure the GFP+ collecting duct area. The measured collecting duct area was normalized for the total kidney area of the micrographs and expressed as percentage:
Atubular Glomeruli Counts
Counting of atubular glomeruli was performed as previously described [22, 23]. Severe kidney injury during pUUO in neonatal mice results in the formation of atubular glomeruli due to the loss of tubular cells in the glomerulo-tubular junction. Extensive work done through serial sectioning analyses has proved that release of obstruction prevents the tubular degeneration and thus ameliorates the formation of atubular glomeruli [22, 23]. In the current study we adopted an indirect method of quantifying the atubular glomeruli in lotus lectin stained images of kidney sections derived from Six2Cre;mTmG mice. Glomeruli showing absence of lectin positive cells at the neck of the glomeruli connecting to proximal tubules were designated as atubular. Atubular glomeruli counts were further normalized for the kidney area measured for each image.
Quantification of fibrotic area and PDGFRβ positive area
Quantifications of collagen positive area with Masson’s trichrome staining and PDGFRβ staining were done using Image J software. The quantified area was normalized for the total kidney area of the micrographs and expressed as percentage.
RNA extraction and PCR analysis
Kidneys were dissected and preserved in RNA later (Life Technologies, Grand Island, NY). Tissues were homogenized with TRIzol reagent (Life Technologies). RNA was isolated from the tissue homogenate by phase separation using BCP (Molecular Research Centre, Cincinnati, OH). The isolated RNA was further purified using RNeasy mini-spin column (Qiagen, Valencia, CA). cDNA was prepared using Moloneymurine leukemia virus reverse transcriptase and an oligo(dT)15 primer (Promega) following the manufacturer’s protocol. Quantitative PCR was performed in a CFXConnect system (Biorad, Hercules, CA) using SYBR Green I (Invitrogen Molecular Probes) and Taq DNA polymerase (Promega), following the manufacturer’s instructions. mRNA values were normalized to Rps14 (Ribosomal Protein S14) expression. The changes in expression were determined by the ΔΔCt method [24]. The primers used for qRT-PCRs are listed in Table 1.
Table 1:
Primers used for qRT-PCR
| Target gene | Forward primer (5’−3’) | Reverse primer(5’−3’) |
|---|---|---|
| Foxd1 | GGAGAGCGAAGGTAGGACT | AGAATCCGAAGCGGCGAA |
| Hoxb7 | CGAACAAACTTCTTGCGCCT | GTGCATGTTGAAGGAACTCGG |
| Six2 | TCACCACCACGCAAGTCA | CTGGAATTGGAGTTCTCGCTG |
| Mafb | GTGGTGTTCAAGTCCCTTCC | ACCGAATCCTCTTACTGACCC |
| α-SMA | CCCTGAAGAGCATCCGACA | AGAGTCCAGCACAATACCAGTT |
| TGF-β | CAATTCCTGGCGTTACCTTGG | GCCCTGTATTCCGTCTCCTT |
| Cpt1a | GGCCATCTGTGGGAGTATGT | ACTGTAGCCTGGTGGGTTTG |
| Cpt2 | TATCTGCAGCACAGCATCGT | GTCTTCCTGAACTGGCTGTCAT |
| Acox1 | TTGTGGAACCTGTTGGCCTC | CCTCGAAGATGAGTTCCGTGG |
| Acox2 | TGCTGACAGAGTCCTTGCTG | GCAGGTATGTCCCATGTCCC |
| PPARα1 | TATGGCCGAGAAGACGCTTG | GCAAAGCCTGGGATAGCCTT |
| Pgc1a | AGTCCCATACACAACCGCAG | CCCTTGGGGTCATTTGGTGA |
| Nrf1 | CCACGTTGGATGAGTACACGA | ACTTTCGCACCACATTCTCCA |
| Nrf2 | TCCCAGCAGGACATGGATTTG | CCTGTTCCTTCTGGAGTTGCT |
| Tfam | GGGAATGTGGAGCGTGCTAA | GGATAGCTACCCATGCTGGAA |
| Prkn | GCAGCCAGAGGTCCAGTTAAA | ACTCACCACTCATCCGGTTTG |
| Cox4 | AGTTCAGTTGTACCGCATCCA | CAAATCAGAACGAGCGCAGTG |
| Rps14 | TCTTTCCGGTGGAGGAGTCT | GTTTCCTTGCCAGAAAGATCGG |
Arterial Micro-Dissection
In order to evaluate the changes in 4th and 5th order arterial branching during injury and repair we performed arterial micro-dissections as it provides details on higher order branches of the arterial tree. This procedure of microdissection (using HCl-macerated kidneys) preserves spatial geometry of the whole renal arterial tree without a loss in arterioles. Arterial micro-dissections were done on kidneys harvested from 1 and 8 weeks old animals. Briefly the kidneys attached to the aorta were incubated in 6M hydrochloric acid for an hour, washed several times with acidified water (pH 2.5). The entire arterial trees were carefully dissected under direct stereoscopic visualization and imaged for counting the arterial branches [25] in kidneys from sham, obstructed and released groups of animals.
Renal Blood Flow Measurement
Renal blood flow (RBF) was assessed in the obstructed and post-released kidneys and compared with sham-operated kidneys using Contrast-Enhanced ultrasonography and steady-pulsed arterial spin labeling (spASL) magnetic resonance imaging (MRI) techniques at the University of Virginia molecular imaging core facilities.
In 3W old obstructed and released animals RBF measurements were performed using the contrast-enhanced ultrasonography technique as previously described [26]. Mice were anesthetized with 2% Isoflurane in air. The fur was removed by shaving and a depilatory cream. Mice were then positioned on a three-coordinate stage with the heating pad maintained at 37°C. Pre-warmed ultrasound gel was placed on the depilated skin for imaging using a Siemens Acuson c512 imaging system, equipped with a 15L8w transducer. The kidney was localized in real-time using conventional B-mode imaging with a frequency of C10 MHz. Once the kidney was identified, the contrast function was initiated in Cadence CPS mode with a frequency of P10MHz; BMI-1.9 and IMI-0.21. A 20 μL intravenous bolus injection of the microbubble contrast agent (~1 billion microbubbles per ml; mean bubble size ~2 μm) was then administered via retro-orbital plexus. Once a steady-state was obtained and no evidence of acoustic shadowing was present, 15-second videos of microbubble destruction and replenishment were recorded. Microbubbles were destroyed using the BURST function and were of 3 seconds in duration. After a minimum of three videos were recorded for each animal, the length and width of the kidneys were measured using the CALIBER application. For data acquisition, the resultant images were analyzed using the Sequoia analysis software (SYNGO) following the protocol as described previously [26].
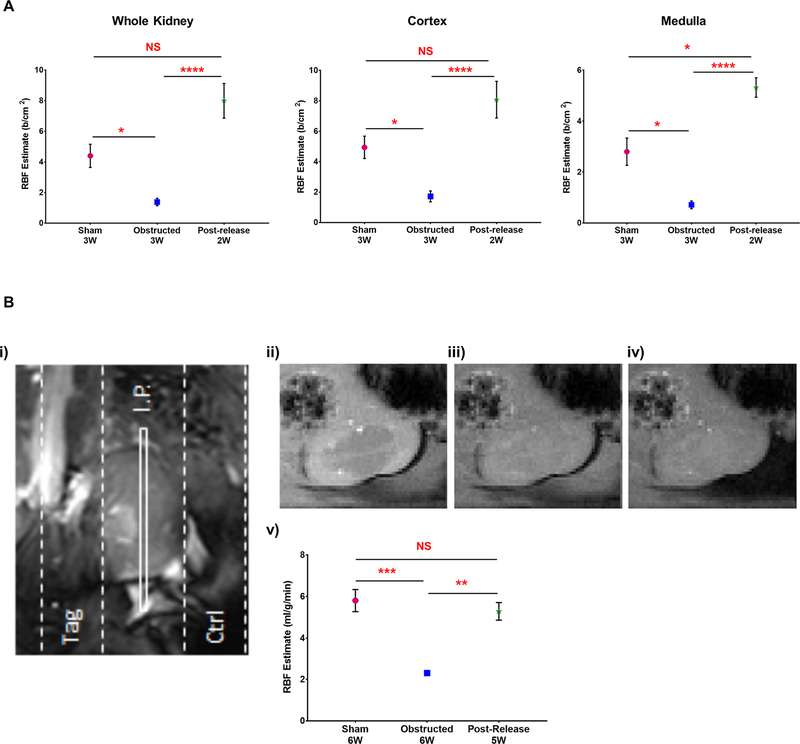
Perfusion measurements in 6W old animals were done using a spASL- MRI technique as described previously [27]. Briefly, MRI scans were performed using a 7T Clinscan system (Bruker, Ettlingen, Germany) with a 30-mm diameter birdcage radio frequency coil. The electrocardiogram (ECG), body temperature, and respiration were monitored during imaging (SA Instruments, Stony Brook, NY). During MRI, mice were anesthetized with 1.25% isoflurane and maintained at 36 ± 0.5°C using circulating warm water. After localizer imaging, spASL-MRI [27] was performed on a mid-renal long-axis slice. As shown in Figure 5B, spASL uses an arterial blood tagging scheme consisting of a regional inversion pulse over the incoming renal artery. The corresponding control scheme uses an inversion pulse applied symmetrically from the imaging plane. Parameters for spASL included: FOV = 38 × 38 mm2, matrix size = 128 × 128, TR = 10 ms, TE = 2.5 ms, flip angle = 7°, slice thickness = 1 mm, saturation band thickness = 10 mm, number of averages = 9, and scan time ~ 6 minutes. RBF was quantified using previously described methods [27].
Figure 5. RBF improves significantly following the release of obstruction:
(A) RBF estimation using contrast-enhanced ultrasonography showed a significant reduction in 3W obstructed kidneys (n=3) compared to 3W sham-operated kidneys (n=3). Release of obstruction resulted in significant recovery in the RBF at 2-weeks post-release (n=5) in the whole kidney, cortex and medulla (B) RBF estimate by spASL-MRI performed in 6W old animals (i) MRI schematic of the spASL pulse sequence on left kidney showing the slab positions of the imaging plane (I.P.) and two saturation bands: tag and control (ctrl). The tag saturation band labels incoming renal blood by placing an inversion pulse over the renal artery, and the control uses an inversion pulse symmetric to the imaging plane (ii-iv) Representative magnitude images of left kidney without saturation pulses, after the control saturation pulse and after the tag saturation pulse (v) RBF estimation by spASL-MRI revealed a significant reduction in cortical RBF rate in 6W obstructed kidneys (n=3) in comparison to similar age group of sham-operated kidneys (n=5). Release of obstruction (n=7) resulted in a significant recovery in RBF (*P<0.05; **P<0.01; ***P<0.001; ****P<0.0001; NS-non significant)
Confocal and Scanning Transmission Electron Microscopy imaging (STEM)
Primary cilia status in the tubular epithelium was assessed using a confocal microscope (Olympus Fluo View 1000). For STEM analyses, 1 and 3 week old animals of sham and surgery groups were fixed by cardiac perfusion through left ventricle with 4% PFA and 2% glutaraldehyde in cacodylate buffer. Tissues were harvested and analyzed using the Advanced Microscopy Facility at the University of Virginia. Semi thin sections of 0.5μm thickness were cut and stained with toluidine blue and imaged using light microscopy.
Statistical Analyses
Data were analyzed using GraphPad Prism 7.04. Results are expressed as mean ± SEM (standard error of the mean). Comparisons between more than two groups were made by one-way analysis of variance for normally distributed data and by Kruskal–Wallis one-way analysis of variance for data not normally distributed. For comparisons between two groups, a two tailed Student’s t test was applied for normally distributed data and Mann Whitney U-test for data not normally distributed. A P value ≤ 0.05 was considered as significant.
Results
1. Release of obstruction reduces hydronephrosis resulting from persistent obstruction
The general experimental design for surgeries and tissue collection is shown in Figure 1A. Severe hydronephrosis after 1 WO resulted in loss of renal medulla and formation of fluid filled kidneys (Figure 1B). Following 8 weeks of pUUO, ipsilateral kidneys underwent atrophy, whereas contralateral kidneys underwent compensatory growth (Figure 1B). Release of obstruction at seven days, resulted in marked reduction in hydronephrosis and improvement of kidney’s gross morphology (Figure 1B). Given that the degree of hydronephrosis varies between animals, to make comparisons during and after obstruction, we generated a hydronephrosis index (severity score 1–4, [5]) (Figure 1C). Notably in three-week-old animals, 36 % of kidneys with severe damage (index 3–4) recovered to index 1 whereas 96% of kidneys with hydronephrosis index 2 recovered to index 1. After 1 WO, body weight was decreased in all animals (males and females), but with increasing age, body weight was no longer different between groups indicating that the surgical procedure did not affect the somatic growth of the animals in either sex (Figure S1-A). The weight of the contralateral (right) kidneys of obstructed animals increased significantly compared to contra-lateral kidneys of shams, consistent with compensatory growth of the right kidneys (Figure S1-B). However, relief of obstruction prevents a further increase in the growth of the contralateral kidneys, as the kidney to body weight ratio of contra-lateral kidneys following the relief of obstruction was not significantly different compared to contra-lateral kidneys of shams (Figure S1-B). The severity of hydronephrosis and recovery capacity following the release of obstruction did not differ between males and females (Figure S1 C–D).
2. Release of obstruction promotes regeneration of the renal vasculature
As the vasculature plays a pivotal role in development and maintenance of the kidney architecture, we examined the changes in the renal vasculature during kidney injury and repair.
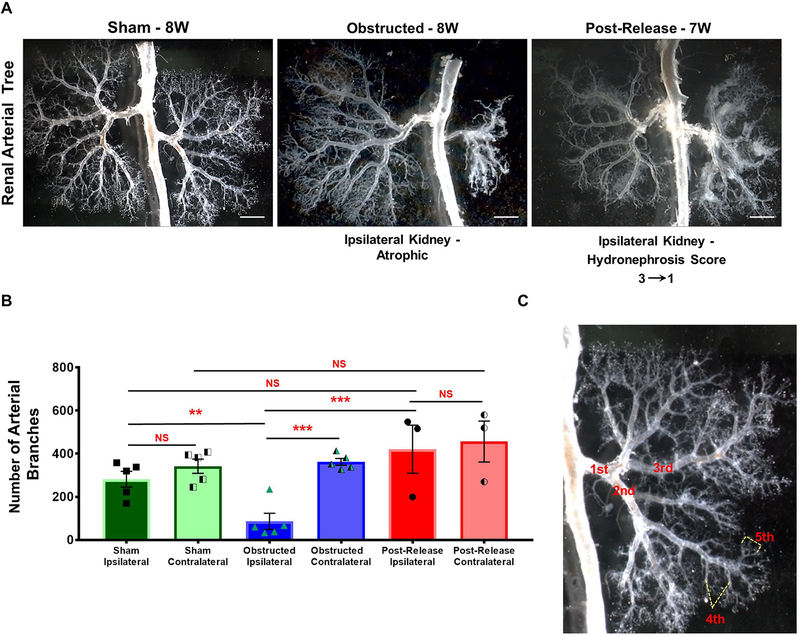
Micro-dissection of the renal arterial trees at 1 WO showed a decrease in arteriolar branching in the obstructed kidneys (Figure S2). With the persistence of the obstruction, the renal arterial trees at 8 weeks revealed extensive damage and stunting of the vasculature characterized by impaired arterial branching and significant arteriolar loss (Figure 2A–B). In fact, quantification of blood vessel branches confirmed a significant decrease in the number of arteries, with a reduction in branching from the 3rd order onwards (Total number of arterial branches: Sham n=5: 282±41; Obstructed n=5: 87±41; P<0.01). Release of obstruction at 1 week, however preserved vascular morphology (Figure 2B) and the final number of arteries was similar to sham kidneys (Released n=3:421±136; vs. obstructed P<0.001; vs. sham NS–non significant). In addition, contralateral kidneys of obstructed and released groups displayed compensatory growth with increased density of the arterial tree when compared to sham kidneys (Contralateral kidneys: Sham n=5: 342±37; Obstructed n=5: 362±18; Released n=3: 457±116). These results indicate that significant repair and regeneration of the renal vasculature occurs subsequent to the surgical relief of the ureteral blockage.
Figure 2. Release of obstruction promotes regeneration of the renal vasculature:
(A) Micro-dissection of the renal arterial trees revealed significant loss of vascular structures and collapse of the arterial tree after 8W of obstruction. Obstructed kidneys showed a marked decrease in arterial branching from 3rd order arteries onwards (ref: panel C). Release of obstruction, resulted in the growth and branching of the renal arterial tree achieving a pattern similar to sham kidneys. Note the increased density of the arterial tree in the right contralateral kidney opposite to the left obstructed kidney (Scale bars, 2mm). (B) Bar graph showing significant decrease in the number of arterial branches in obstructed kidneys (n=5) compared to sham operated kidneys (n=5). Kidneys with obstruction released after 1 week (n=3) displayed similar number of arterial branches when compared to shams (**P<0.01; ***P<0.001; NS-non significant). (C) Micrograph of a renal arterial tree showing examples of 1st to 5th order arterial branches.
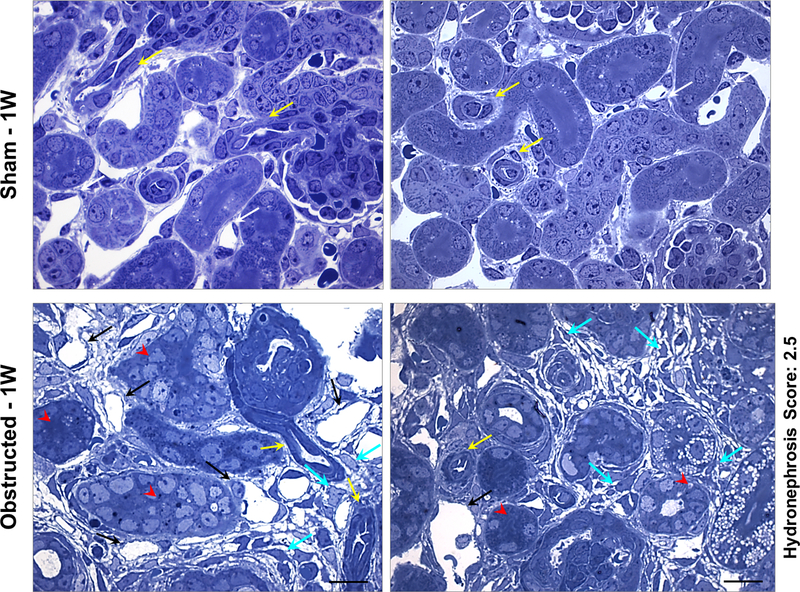
Using toluidine blue stained semi-thin sections, we performed histological analysis on vascular structures in kidneys obstructed for 1 week and age/group matched sham kidneys (Figure 3). Interstitial micro-vascular damage was extensive at 1-week post-obstruction compared to the tubular damage (Figure 3). Capillary lumen dilatation accompanied by absence of pericyte coverage was noticed in the damaged areas of the obstructed kidneys, whereas, sham kidney displayed intact pericyte coverage of the capillaries (Figure 3).
Figure 3. Renal micro vasculature damage at 1 week after obstruction:
Toluidine blue staining on semi-thin sections from kidneys obstructed for 1 week displayed arterioles with flattened smooth muscle cells (yellow arrows) and extensive micro-vascular damage in comparison to sham kidneys. Peritubular capillaries displayed dilation accompanied with absence of pericyte lining and endothelial degeneration (black arrows). Interstitial matrix deposition and pericyte-like cells in the interstitial space were prominent (cyan arrows). Tubular epithelium is indicated by red arrow heads. Scale bars, 10 μm.
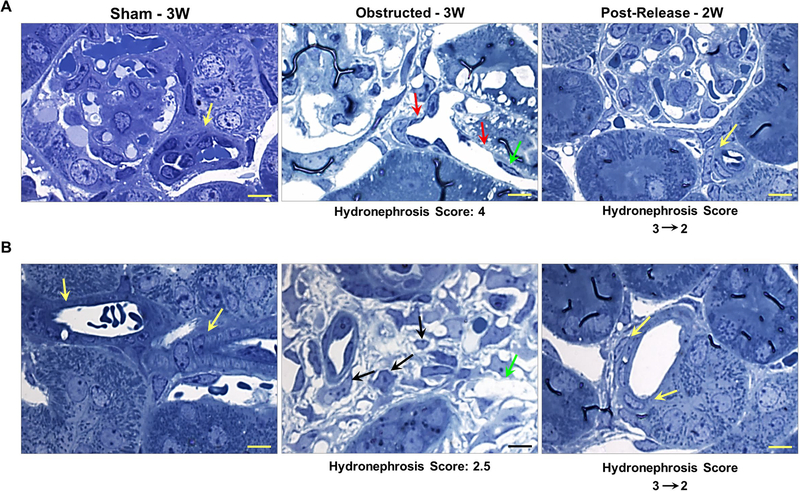
Observations of vascular structures on semi-thin sections in 3 WO kidneys revealed further degeneration of the renal vasculature and vascular rarefaction. The arterioles were dilated and accompanied with thinning of arteriolar smooth muscle lining. Detached pericyte like cells were observed in the interstitial space. In addition, the endothelial cells were sparse and rounded up in several areas (Figure 4A–B). However, release of obstruction resulted in regeneration and restoration of normal distribution of endothelial cells as well as smooth muscle lining around the arteriolar walls. In the released kidneys, the morphology of the vasculature was similar to the one of the sham kidneys due to massive repair and remodeling (Figure 4A–B).
Figure 4. Relief of obstruction ameliorates obstructive vascular damage:
Analyses of (A) afferent arterioles and (B) other renal arterioles in toluidine blue stained semi-thin sections showed intact vascular smooth muscle cell (SMC) lining of the arterioles in sham-operated kidneys (yellow arrows). On the other hand, kidneys obstructed for 3 weeks showed an extensive degeneration of the vessels including thinning of SMCs in the arteriolar walls (red arrows) as well as loss of endothelial cells (green arrows). In addition, pericytes detached from the capillary wall and several pericyte-like cells were seen loose in the interstitial space (black arrows) with excessive deposition of interstitial matrix. Release of obstruction at 7 days resulted in the restoration of arteriolar SMC architecture (yellow arrows) and regeneration of the vasculature. Scale bars, 10μm.
Similarly Scanning Transmission EM (STEM) image analyses revealed a marked damage and disintegration of endothelial cell lining of the vasculature in obstructed kidneys, with a remarkable improvement following the release of obstruction (Figure S3A). We confirmed these observations using immunostaining for PECAM, a critical regulator of endothelial cell junctional integrity [28]. Our results showed a prominent staining for PECAM in endothelial cells of arteries, arterioles and interstitial and glomerular capillaries of sham kidneys indicating an intact endothelial lining of the vasculature. Obstructed kidneys showed a marked decrease in PECAM staining indicating loss of renal vessels and vascular rarefaction. In addition, abnormal dilated vascular structures suggest that endothelial cell integrity is severely compromised due to the obstruction damage (Figure S3B). However, release of obstruction abrogates the progression of vascular anomalies post-obstruction and brings forth a significant regeneration and restoration of the renal vasculature similar to sham-operated kidneys (FigureS3B).
Collectively our results suggest that onset of vascular damage may precede the tubular and interstitial damage during the obstruction injury. Moreover, release of obstruction results in regeneration and repair of the renal vasculature.
3. Release of Obstruction promotes renal blood flow
The excessive renal vascular damage during persistent obstruction and the remarkable repair post-release suggests an increase in RBF. Therefore, we used a contrast-enhanced ultrasound (US) method and arterial spin-labelling magnetic resonance imaging (MRI) to compare the relative RBF estimate as a readout of vascular function in the mice that underwent surgeries.
Contrast enhanced US is a validated method to measure RBF [26]. Using this technique we observed a significant decrease (64–73%) in RBF in 3 WO kidneys in comparison to the similar age group of sham-operated kidneys (Figure 5A). The RBF measurements were significantly higher in the left kidneys of sham group (n=3) compared to the obstructed group (n=3) in the whole kidney (Sham: 4.48±1.58 b/cm2 Obstructed: 1.47±0.54 b/cm2; P<0.05), cortex (Sham: 5.04±1.51 b/cm2 Obstructed: 1.83±0.84 b/cm2; P<0.05) and medulla (Sham: 2.84±1.13 b/cm2 Obstructed: 0.76±0.28 b/cm2; P<0.05).
However, animals at 2 WR (n=5) displayed a significantly improved RBF in comparison to obstructed animals, both in the whole kidney and in regional measurements. (Whole kidneys: 7.84 ±1.79 b/cm2, p <0.0001 Cortex: 7.88 ±1.98 b/cm2, P< 0.0001 Medulla 4.46±0.43 b/cm2, P< 0.0001). Though the mean RBF estimated following the release of obstruction was increased compared to sham-operated kidneys, statistical significance was observed (P<0.05) only in the medulla (Figure 5A). These results indicate that significant repair and regeneration of the vasculature post-release leads to restoration of normal levels of RBF.
We confirmed these results on RBF determinations from ultrasound imaging by steady state arterial spin-labelling MRI [27] at 5W after the release of obstruction (Figure 5B). Cortical RBF determinations in kidneys obstructed for 6W (n=3) showed a significant decrease in the blood flow compared to the similar age group of sham-operated kidneys (n=3) (Sham: 5.81±0.59 ml/g/min; Obstructed: 2.30±0.07 ml/g/min; P<0.001). Release of obstruction at 1 week (n=7) resulted in a remarkable increase in the RBF determinations at 5W post release (Figure 6) when compared to obstructed kidneys and with similar levels to sham-operated kidneys (Released kidneys: 4.86±0.74 ml/g/min; vs. obstructed P<0.01; vs. sham NS-non significant).
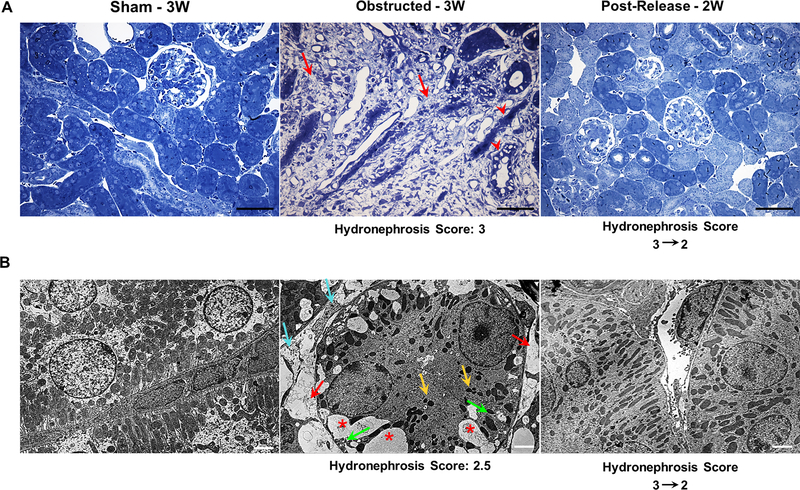
Figure 6. Relief of obstruction ameliorates obstructive tubular and interstitial damage:
(A) Toluidine blue stained semi-thin kidney sections from 3 weeks obstructed kidneys showed massive tissue damage with a significant increase in interstitial matrix deposition (red arrows) and damaged tubular epithelium (red arrow heads). In contrast, in released kidneys the interstitial matrix deposition was largely resolved, tubular damage was mitigated and the tissue architecture was restored similar to that of the sham-operated group. Scale bars, 100μm. (B) STEM (Scanning Transmission Electron Microscopy) analyses showed an extensive loss of tubular mitochondria (yellow arrows), increase in the number vacuoles (*), increase in interstitial collagen deposition (cyan arrows), loss of inter-digitating tubular basal lamina (green arrows) and vascular rarefaction (red arrows) in kidneys following three weeks of ureteral obstruction. Release of obstruction led to the disappearance of vacuoles, reduction of interstitial matrix, restoration of mitochondria, basal lamina and vascular structures (Scale bars, 2μm).
Thus our experimental results showing increases in RBF in 3W and 6W old animals tested by two independent methods clearly indicate that release of obstruction significantly improves vascular repair and regeneration and achieves a concomitant improvement in renal vascular function.
4. Release of obstruction results in the remodeling of renal tubular epithelium and interstitium
Histological analyses on toluidine blue stained semi-thin kidney sections revealed an increase in interstitial matrix deposition already at 1 WO (Figure 3). By 3 WO the kidneys displayed excessive matrix deposition and tubular degeneration (Figure 6A). Removal of obstruction remarkably ameliorated and reverted the tissue damage. The kidney morphology at 2 WR was similar to sham-operated mice (Figure 6A). Scanning TEM analyses of kidney sections at 3 weeks of post-natal life showed extensive sub-cellular changes such as loss of tubular cell mitochondria, endoplasmic reticulum, interdigitating lateral processes of the basal lamina and brush border, with accumulation of vacuoles and increased interstitial matrix deposition in the obstructed group. These changes were reversed when the obstruction was removed and the interstitium and tubular epithelium displayed a remarkable remodeling (Figure 6B).
Next we investigated whether obstructed kidneys show evidence of degeneration in fatty acid metabolism, as we observed excessive accumulation of lipid droplet like structures in the toluidine blue stained semi-thin kidney sections, in severe hydronephrotic regions of the obstructed kidneys (data not shown). We performed oil red staining to assess lipid accumulation during tubular degeneration in obstructed kidneys. Kidneys at 3 WO, showed a marked increase in cells positive for oil red staining whereas sham kidneys showed no staining (Figure S4A). This indicates an increased lipid accumulation and suggests a defective fatty acid oxidation in the damaged tubular epithelium. Release of obstruction prevented the progression of the tubular injury, as indicated by absence of oil red staining in released kidneys (Figure S4A).
We also checked if the vacuoles seen in the tubular epithelium of obstructed kidneys (Figure 6B) were autophagic using the marker LC3B-II [29]. Our results revealed increased autophagic activity in the tubular and interstitial cells during obstruction. Release of obstruction prevented this abnormal increase in autophagy (Figure S4B). Next, we assessed the status of primary cilia during kidney injury and repair, as the primary cilium defines the epithelial phenotype of the renal tubules [30, 31]. Sham-operated kidneys showed the presence of intact cilia, whereas degenerating tubules in 3 WO kidneys revealed loss of cilia (Figure S4C). In addition, some of the intact tubular cells of the obstructed kidneys displayed an increase in the primary cilium length, indicating dysregulated ciliogenesis and loss of epithelial cell identity. Presence of primary cilia in the tubular cells post-relief similar to sham-operated kidneys indicate that relief of obstruction prevents the progression in the tubular injury and promotes tubular repair (Figure S4C).
As expected, Masson’s Trichrome staining showed the presence of interstitial collagen deposition after 1 WO, which further increased at 3 WO indicating the onset and progression of fibrosis due to obstructive injury (Figure S5). By contrast, release of obstruction resulted in the resolution of interstitial fibrosis, from a partial recovery at 1 WR to a complete recovery at 2 WR (Figure S5). Quantification on the collagen positive fibrotic area confirmed these observations (Sham-3W n=3: 2.53±0.94% Obstructed-3W n=3: 33.16±5.42%, P<0.001; Released n=3: 9.95±2.30% vs. Obstructed P<0.01 vs. Sham NS-non significant). Contralateral kidneys were similar to sham-operated kidneys (data not shown). These results confirm our observations on interstitial matrix in semi-thin sections and indicate that release of obstruction facilitates recovery and protection from the progressive interstitial fibrosis due to obstruction.
Collectively our results indicate that during obstruction the kidneys undergo extensive tubular and interstitial damage and release of obstruction brings forth a remarkable repair and remodeling of these compartments.
5. Release of obstruction promotes recovery from renal oxidative stress
It has been shown that during kidney injury due to ureteral obstruction there is an increase in oxidative stress [32–34]. We hypothesized that following the release of obstruction the improved vascular function and recovery in tubular damage will be accompanied by a decrease in oxidative stress. Various bio markers of oxidative stress are increased during ureteral obstruction. We tested two candidate markers Heme oxygenase-1 (HO-1) [32, 35] and 4-hydroxynonenal (4-HNE) proteins [36, 37] by immunohistochemistry.
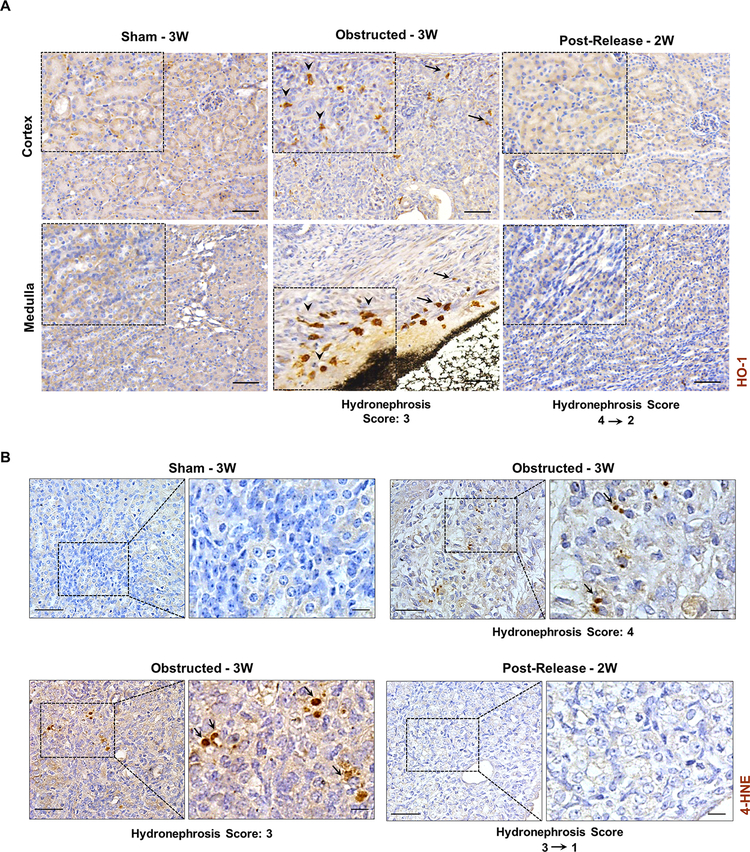
Increase in HO-1 signals was observed in kidneys at 3 WO. Interstitial cells surrounding the tubular epithelium and in the areas of fibrotic damage showed increased HO-1 signals in comparison to sham and 2 WR kidneys (Figure 7A). Similarly, immunostaining for 4-HNE showed expression in several tubular cells in the obstructed kidneys, whereas it was absent in the sham and released kidneys (Figure 7B). These results indicate that renal tissues are subjected to oxidative stress during obstruction injury, which is relieved with the release of obstruction.
Figure 7. Reduction of renal oxidative stress following the release of obstruction.
(A) Immunostaining for Heme oxygenase-1(HO-1) on kidney sections from sham, 3W obstructed and 2W post-release showing increased expression of HO-1 in interstitial cells of both cortical and medullary regions from 3W obstructed kidneys (black arrows, arrow heads in enlarged insets). Scale bars, 50μm. (B) Immunostaining for 4-hydroxynonenal (4-HNE) showing positive cells in 3W obstructed kidneys (arrows) whereas sham and released kidneys of similar age groups were negative for 4-HNE. (Scale bars, 50 μm, 10 μm)
We also explored the changes in the status of other factors such as hypoxia, fatty acid oxidation (FAO) defects and mitochondrial dysfunction which are potential contributors to oxidative stress [38–42]. Immunostaining for Hif1α and Hif2α in 3 WO kidneys revealed increased signals for these proteins only in tubular and interstitial cells that are severely damaged during obstruction injury. However, these hypoxia-regulated proteins were absent in the sham and post-release kidneys (Figure S6). These results indicate that tissues with increased damage during obstruction undergo hypoxia and relief of obstruction ameliorates this phenomenon.
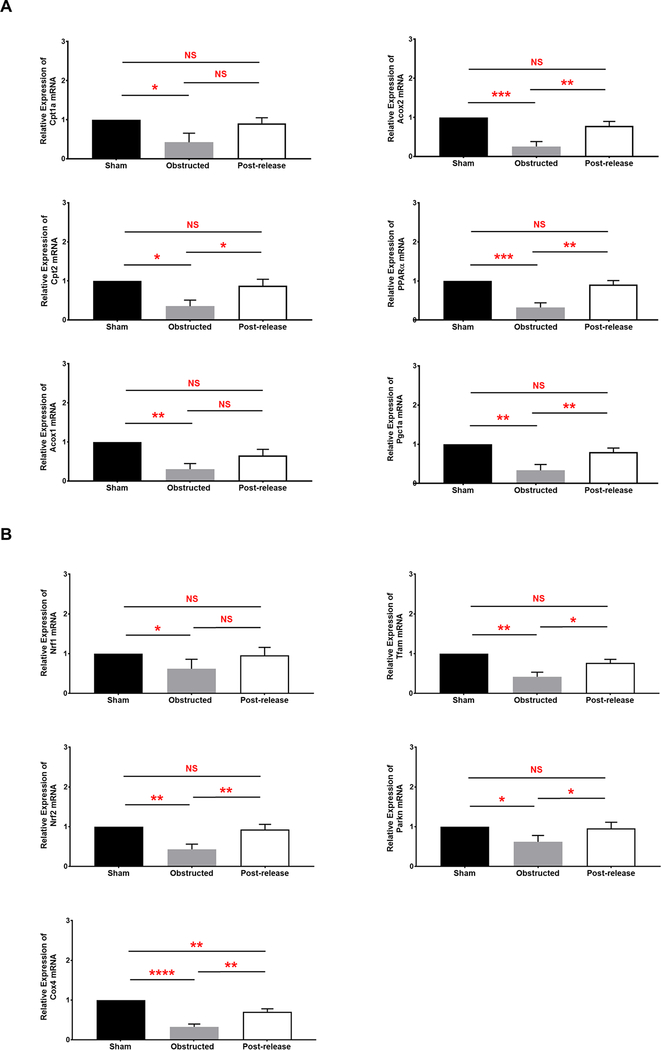
Next, we performed q-RT-PCR on key regulators of FAO that are differentially regulated during CKD [43]. Our results show that mRNA levels of Cpt1a and Cpt2 critical for the carnitine shuttle of fatty acids to the mitochondria are significantly reduced during persistent obstruction damage (Figure 8A). Furthermore, mRNA levels of Acox1 and Acox2 genes were also significantly reduced in obstructed kidneys (Figure 8A). Proteins encoded by these genes are critical regulators of peroxisomal fatty acid beta-oxidation pathway [44]. In addition to the genes involved in fatty acid metabolism, mRNA levels of their key transcriptional regulator complex PPARA–PPARGC1A are significantly reduced during obstruction injury (Figure 8A). PPARA–PPARGC1A complex is also important in the regulation of mitochondrial biogenesis. However, remarkable improvement in the gene expression was observed for all the genes tested following the release of obstruction. The levels in the post-released kidneys were similar to sham-operated kidneys (Figure 8A). Dysregulation of FAO genes affects fatty acid metabolism leading to intracellular lipid accumulation and cellular lipotoxicity. Our q-RTPCR results are consistent with the increased lipid accumulation observed in the renal tubular epithelium during obstruction injury and the recovery after release of obstruction (Figure S4A).
Figure 8. Differential regulation fatty acid metabolism and mitochondrial dysfunction during obstruction damage and recovery by qRT-PCR:
(A) Relative mRNA transcript levels of genes and transcriptional regulators of fatty acid metabolism in 3W sham (n=4), obstructed (n=5) and released kidneys (n=6) at 2W post-release (B) Relative mRNA transcript levels of mitochondrial specific genes in 3W sham (n=4), obstructed (n=5) and released kidneys (n=6) at 2W post-release (*P<0.05; **P<0.01; ***P<0.001; ****P<0.0001; NS-non significant).
q-RT-PCR for the mitochondrial related transcripts Nrf1, Nrf2, Tfam, Cox4 and Parkin2 involved in mitochondrial biogenesis and function [45, 46] showed a significant decrease in obstructed kidneys indicating a severe mitochondrial dysfunction in the damaged cells. Release of obstruction resulted in a significant increase in the mRNA for all these genes compared to obstructed tissues (Figure 8B). These results indicate that normal mitochondrial function is perturbed in obstructed kidneys and defective mitochondrial function activates the onset of oxidative stress [47]. Removal of obstruction facilitates recovery of the mitochondrial damage by improving the expression of genes critical for normal mitochondrial function, and thus resulting in the reduced oxidative stress in the damaged cells. These results are in agreement with the severe mitochondrial damage observed in the STEM images from obstructed kidneys and the remarkable regeneration of mitochondria observed post-release (Figure 6B).
Collectively these results indicate there is an increase in oxidative stress during kidney injury in neonatal pUUO. Accumulation of lipids along with mitochondrial dysfunction in the obstructed kidneys could contribute to this pathology. Release of obstruction alleviates the mitochondrial damage leading to a reduction in oxidative stress with tissue regeneration.
6. Foxd1- positive, stromal- derived cells expand and change their fate to putative myofibroblasts during pUUO damage.
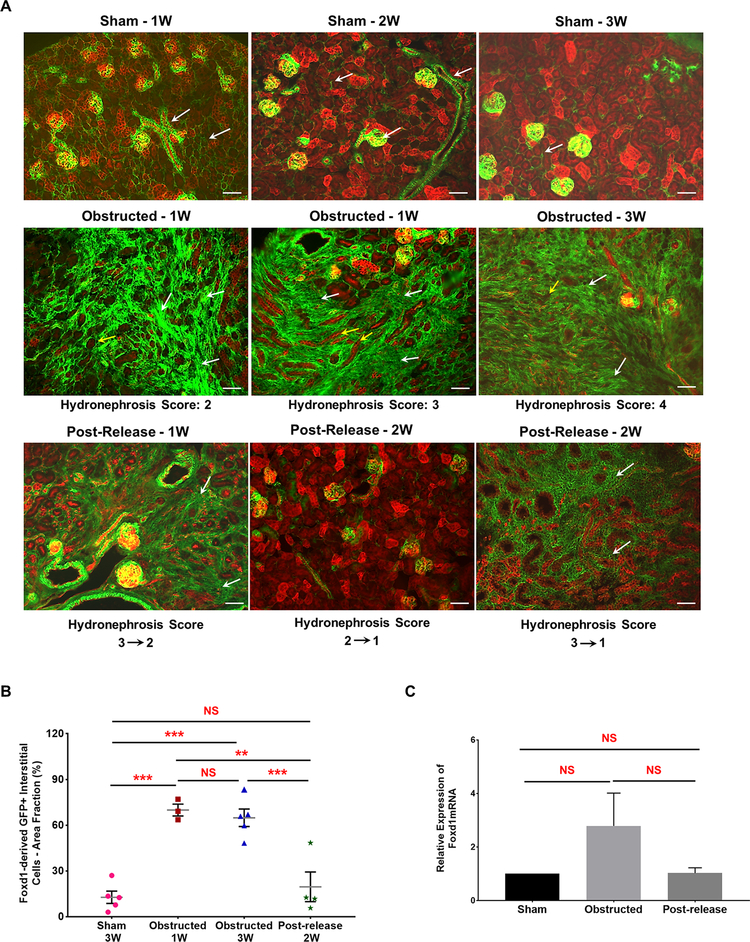
Foxd1 marks the stromal cell precursors that give rise to all renal vascular smooth muscle cells, renin cells, mesangial cells and interstitial pericytes [48]. Using Foxd1Cre;mTmG mice, we followed the distribution of cells from the Foxd1 lineage at various time points after obstruction and release of obstruction (Figure 1A).
As shown in Figure 9, at 1 and 3 WO there was a significant expansion of GFP+ interstitial cells in kidneys with moderate (index 2) and severe (index 3 and above) hydronephrosis. Surgical release of the obstruction resulted in tissue repair and regeneration as indicated by a marked decrease in the GFP+ interstitial cell area (Figure 9A and 9B). The extent of recovery increased with increase in time after the release of obstruction and was inversely correlated to the severity of damage at the time of release (Figure 9A). Quantification on cumulative GFP+ interstitial cell area confirmed these observations (Figure 9B). 1 and 3 WO caused a significant increase in GFP+ interstitial area compared to sham kidneys (Sham-3W: 13.98 ± 2.70% (n=5) vs. obstructed-1W: 69.30 ± 3.34% (n=3), P<0.001; vs obstructed-3W: 65.40 ± 2.85% (n=5), P<0.001). However, in 2 WR kidneys the GFP+ area was similar to sham surgery (Post-release-2W: 20.64 ± 4.68 (n=4) vs. obstructed-1W, P<0.01; vs.obstructed-3W, P<0.0001; vs. Sham, NS-non significant). The GFP+ interstitial cell distribution in contralateral kidneys with or without the release was not different from the sham group (data not shown). In addition, qRT-PCR showed no significant changes in Foxd1 gene expression (Figure 9C). Our results indicate that changes observed in GFP+ Foxd1 lineage cells are not due to the activation of Foxd1 gene expression during kidney damage and repair.
Figure 9. Foxd1-derived GFP+ interstitial pericytes expand during pUUO damage:
(A) Kidneys from Foxd1Cre;mTmG mice at different time intervals after obstruction and release of obstruction. Foxd1 lineage (GFP+) cells are observed in smooth muscle cells lining the renal arteries and arterioles, pericytes in the interstitium and in the glomerular mesangium (white arrows in Sham-1, 2 and 3W). The GFP+ Foxd1 lineage cells expanded in the renal interstitium of the obstructed kidneys at 1 week post obstruction (white arrows). In addition, RFP+ tubules in the damaged interstitium exhibited tubular dilation, collapse and loss (yellow arrows). In contrast, the hydronephrosis and interstitial damage decreased post-release. The recovery in GFP+ interstitial cell expansion in released kidneys was in proportion to the hydronephrosis index at the time of release, as kidneys with score 2 recovered completely compared to kidneys with score 3 (white arrows). Scale bars, 50μm. (B) Scatter plot shows mean ± SE of percent GFP+ interstitial cell area fraction of left kidneys subjected to various surgical procedures. Significant increases seen in 1W (n=3) and 3W obstructed (n=5) kidneys but not in released kidneys (n=4) at 2W post-release. (C) qRT-PCR showed no significant differences in the Foxd1 gene expression between 3 week old sham (n=4), obstructed (n=6) and released (n=5) kidneys (**P<0.01; ***P<0.001; NS-non significant)
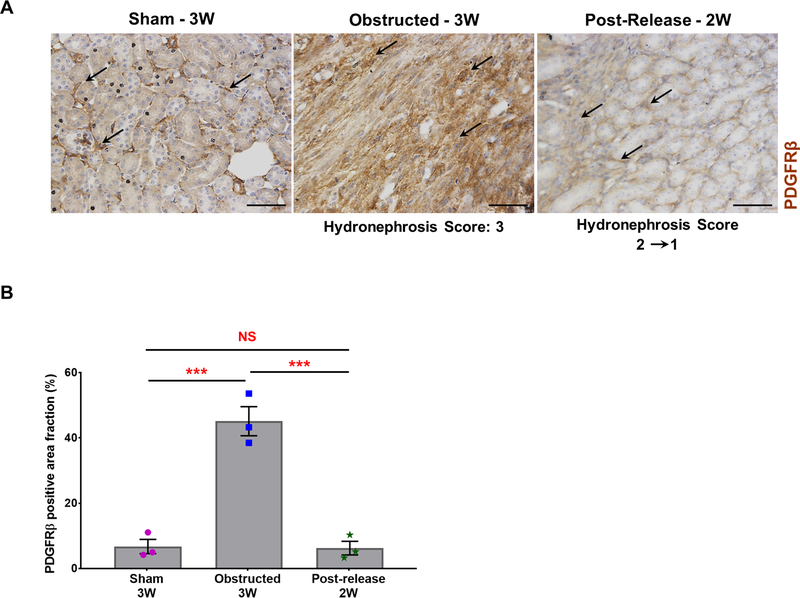
Immunostaining for PDGFRβ revealed an increase in interstitial pericytes at 3 WO, which was resolved at 2 WR (Figure 10). Quantification of PDGFRβ positive areas showed an 85% increase in the obstructed kidneys (n=3) compared to sham kidneys (n=3) (Sham: 6.75±2.65%; Obstructed: 45.13±5.46%; P<0.001). However, PDGFRβ signals significantly decreased in 2 WR kidneys (n=3) and were similar to sham levels (Released: 7.28±2.58%; vs obstructed, P< 0.001; vs sham, NS- non significant). In addition, the staining pattern of PDGFRβ positive interstitial pericytes during obstruction and release was similar to the distribution of Foxd1 derived GFP+ interstitial cells suggesting that the latter are of pericyte origin.
Figure 10. Expansion of PDGFRβ positive cells during obstruction injury:
(A) Immunostaining for PDGFRβ showed an increase in pericyte expansion (black arrows) in obstructed kidneys compared to sham-operated kidneys (black arrows). PDGFRβ status at 2 weeks post-release was similar to sham kidneys (black arrows). Scale bars, 50μm. (B) Quantification of PDGFRβ positive area in tissue sections confirmed a significant increase in obstructed kidneys (n=3) in comparison with sham-operated kidneys (n=3). Release of obstruction (n=3) showed a similar pattern of PDGFRβ stained area as observed in the sham kidneys (***P<0.001; NS-non significant).
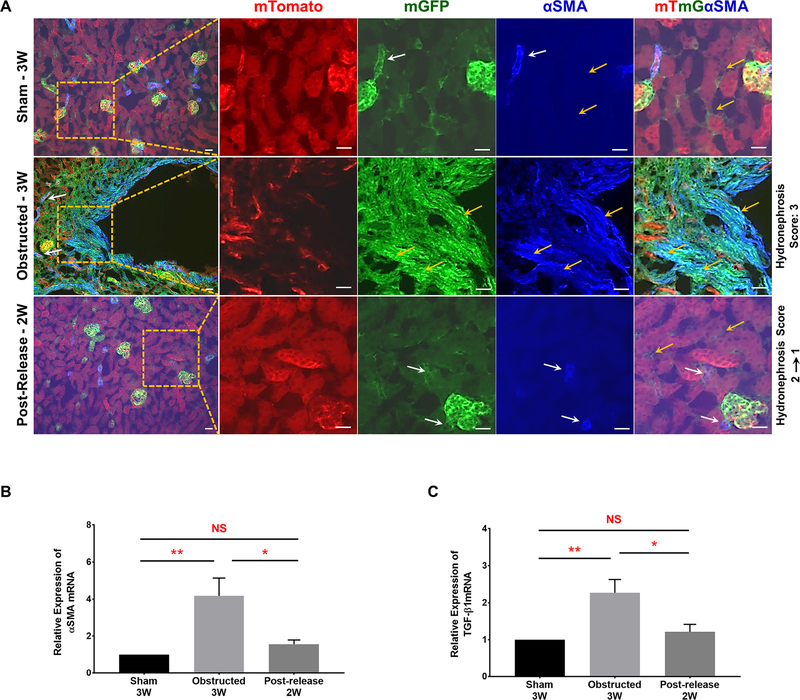
Alpha-smooth muscle actin (α-SMA), a marker for activated myofibroblasts, was significantly increased in the renal interstitium of 3 WO kidneys (Figure 11A). In addition, the interstitial α-SMA co-localized with most of the expanded GFP+ interstitial cells in Foxd1Cre;mTmG kidneys. However, following the release of obstruction, interstitial α-SMA decreased with expression restricted to vascular mural cells as in sham kidneys (Figure 11A). Moreover, qRT-PCR analysis in 3 WO kidneys showed a significant increase in α-SMA expression compared to sham kidneys. In contrast, released kidneys displayed levels similar to shams (Figure 11B). Similarly, TGF-β1 mRNA levels significantly increased in obstructed kidneys, but decreased to the levels of sham kidneys following the release of obstruction (Figure 11C). These results suggest that Foxd1-derived interstitial pericytes undergo cell fate changes and differentiate into putative myofibroblasts during obstruction by acquiring α-SMA due to increases in TGF-β1. Release of obstruction abrogates these fate changes by preventing the up-regulation of TGF- β1 and α-SMA expression.
Figure 11. Release of obstruction reverses pericyte cell fate changes to α-SMA positive myofibroblasts:
(A) Presence of α-SMA was observed in renal arteries and arterioles. It co-localized with all the GFP+ Foxd1 lineage cells (white arrows) except the interstitial pericytes (yellow arrows) of sham-operated Foxd1Cre;mTmG kidneys. In 3W obstructed kidneys, in addition to its presence in arteries and arterioles (white arrows), a remarkable expansion of α-SMA was seen in the interstitium. Interstitial α-SMA co-localized with the expanded GFP+ interstitial pericytes in the obstructed kidneys (yellow arrows) indicating their putative fate change to myofibroblasts. In released kidneys, α-SMA was absent in the GFP+ interstitial pericytes (yellow arrows) and was restricted only to arteries and arterioles similar to shams (white arrows). Scale bars, 20μm. (B and C) qRT-PCR analyses showed a significant increase in α-SMA and TGF-β1 mRNA levels in 3W obstructed kidneys (n=6) compared to similar age group shams (n=4). In released kidneys (n=5) the expression levels of α-SMA and TGF-β1 was not significantly different from shams (*P<0.05; **P<0.01; NS-Non significant).
7. Release of obstruction promotes recovery of Six2- derived nephron epithelium.
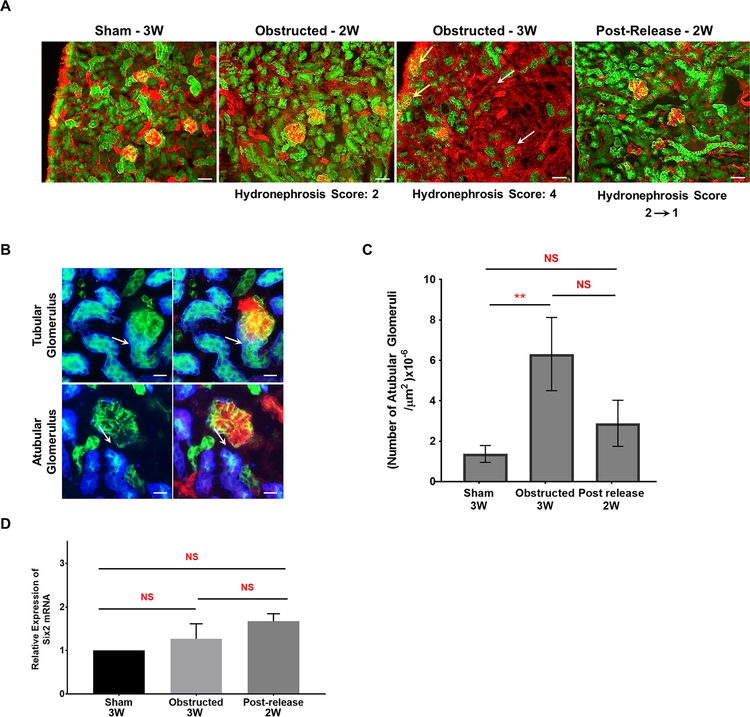
Six2 is a marker for nephron progenitor cells in the cap mesenchyme and Six2 lineage cells are present along the entire nephron in sham-operated kidneys (Figure 12A). Ureteral obstruction in Six2Cre;mTmG mice induced a loss of GFP+ tubular epithelium proportional to the hydronephrosis index (Figure 12A). By contrast, with the release of obstruction, the injury and progressive disappearance of Six2-derived tubules was averted (Figure 12A). The nephron integrity of the contralateral kidneys was maintained (data not shown).
Figure 12. Release of obstruction prevents Six2- derived nephron epithelial damage:
(A) Kidney sections of Six2Cre;mTmG mice showed the presence of GFP+ Six2 lineage cells all along the nephron epithelium. Obstructed kidneys with hydronephrosis score 2 displayed no obvious changes in the distribution of GFP+ tubules in contrast to an extensive loss in kidneys with severe hydronephrosis index 4 (white arrows). Release of obstruction decreased the hydronephrosis, prevented excessive tubular loss and the GFP+ nephron tubule status was similar to shams. Scale bars, 50μm (B) Atubular glomeruli were identified by the absence of Lotus tetragonolobus lectin and GFP in nephron tubules at the tubular pole (white arrows; also indicated by yellow arrows in panel A; Scale bars, 20μm) (C) Bar graph shows a significant increase in the number of atubular glomeruli in obstructed kidneys compared to sham-operated kidneys with a decrease following the release of obstruction. (D) qRT-PCR analysis for Six2 mRNA expression in 3 week age group animals revealed no significant differences (mean ± SE) between the sham (n=4) and animals that underwent obstruction (n=6) and release (n=5) surgeries (**P<0.01; NS-Non significant).
Damage to cap mesenchyme-derived proximal tubules resulted in the formation of atubular glomeruli (Figure 12A). Atubular glomeruli in Six2Cre;mTmG kidneys were identified by the absence of Lotus tetragonolobus lectin, which stains the proximal tubular epithelial cells at the glomerulo-tubular junction (Figure 12B). The fraction of atubular glomeruli (Figure 12C) increased in severely obstructed kidneys. Following the relief of obstruction, the number of atubular glomeruli decreased to levels close to the ones of sham kidneys. (Sham n=3:1.37±0.42×10⁻⁶/μm2 Obstructed n=3: 6.32±1.8×10⁻⁶/μm2; P<0.01; Released n=3: 2.89±1.14×10⁻⁶/μm2). These results indicate that release of obstruction preserves the glomeruli from undergoing severe damage at the glomerulo-tubular junction. GFP+ Six2 lineage cells were restricted to the nephron epithelium, indicating that cap-mesenchyme derived nephron epithelium does not transdifferentiate to other cell types during kidney repair. qRT-PCR analysis showed no significant changes in Six2 gene expression during obstruction and after release (Figure 12D).
8. Release of obstruction reverses HoxB7-derived collecting duct loss.
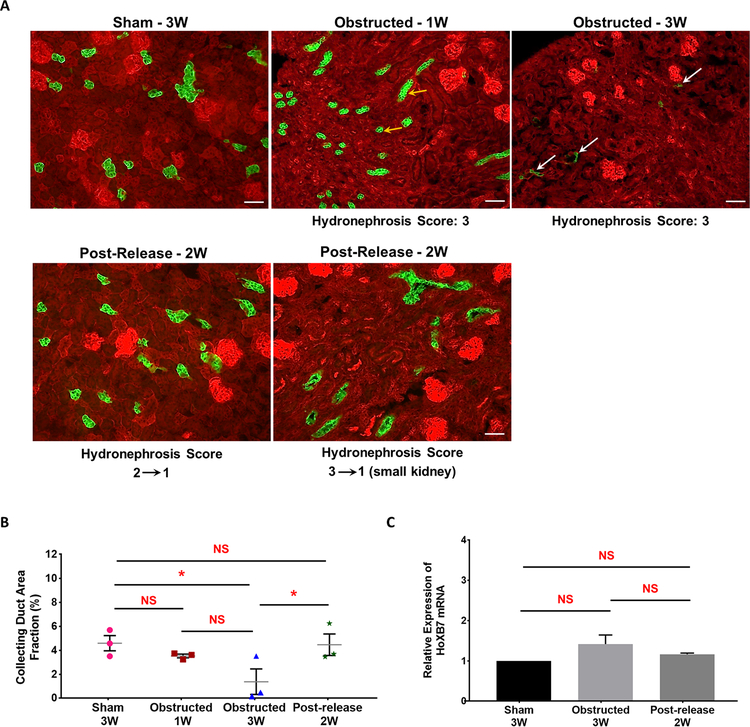
The fate of UB derived cells was determined in HoxB7Cre;mTmG mice, wherein collecting ducts are labeled with GFP, following the strategy shown in Figure 1A. At 1 WO GFP+ tubular cells in the kidney cortex were smaller in size and the collecting duct area fraction presented a decreasing trend in comparison to sham kidneys suggesting the onset of tubular degeneration (Figure 13A and 13B). With persistent obstruction (3 WO) the tubular damage increased further resulting in severe hydronephrotic kidneys with compression of the renal medulla and virtually a complete loss of collecting ducts during severe injury (Sham n=3: 4.66±0.29% 1W Obstructed n=3: 3.55±0.20% 3W Obstructed n=3: 1.07±0.31% vs. Sham P<0.05). Release of obstruction prevented the extensive loss of collecting ducts triggered by the obstruction (Released n=3: 4.84±0.49% vs. 3W Obstructed P<0.05). Significant increase in the GFP positive collecting duct area post-release compared to post-obstruction indicates a remarkable recovery in the tubular damage and a significant protection from tubular loss. The distribution of GFP+ collecting ducts in the contralateral kidneys of obstructed and released groups was similar to sham kidneys (data not shown).
Figure 13. Release of obstruction prevents HoxB7-derived collecting duct loss:
(A) Kidneys from HoxB7Cre;mTmG mice showed GFP expression in all the collecting ducts. Obstructed kidneys at 1 week displayed flattening of collecting duct cells in the more preserved kidney areas (yellow arrows). Continued obstruction leads to a significant loss in tubular epithelium at 3 weeks (white arrows), which was restored to normal state at 2W post-release. Scale bars, 50μm. (B) Scatter plot shows cumulative mean ± SE of percent GFP+ collecting duct area fraction of left kidneys subjected to various surgical procedures. A significant loss in collecting duct area is seen in 3 weeks obstructed kidneys (n=3) in comparison to sham-operated mice (n=3), with a progression in the damage between one week (n=3) to 3 weeks. Two of the animals in 3W age group with higher hydronephrosis index (3) displayed a complete loss of tubular epithelium in comparison to the obstructed kidneys with moderate hydronephrosis index (2). The collecting duct area in released kidneys at 2 weeks post-release (n=3) was not significantly different from sham-operated kidneys but significantly different compared to the 3W obstructed group (*P<0.05; NS-Non significant). (C) qRT-PCR analysis for Hoxb7 gene expression in 3 week age group of sham-operated (n=4), obstructed (n=6) and released (n=5) animals revealed no significant changes in kidneys due to surgical treatments (NS-Non significant).
The presence of GFP+ UB derived cells was observed only in the collecting ducts and not in any other tissue domain during obstruction and following the release of obstruction in Hoxb7Cre;mTmG mice. These results indicate that UB derived collecting duct epithelial cells do not contribute physically to the interstitial fibrosis due to ureteral obstruction. In addition, qRT-PCR analyses showed no significant changes in HoxB7 gene expression indicating that changes in the number of GFP+ tubular epithelial cells is not due to changes in the Cre expression during kidney damage and repair (Figure 13C).
9. The fate of podocyte derived cells during UUO damage and recovery
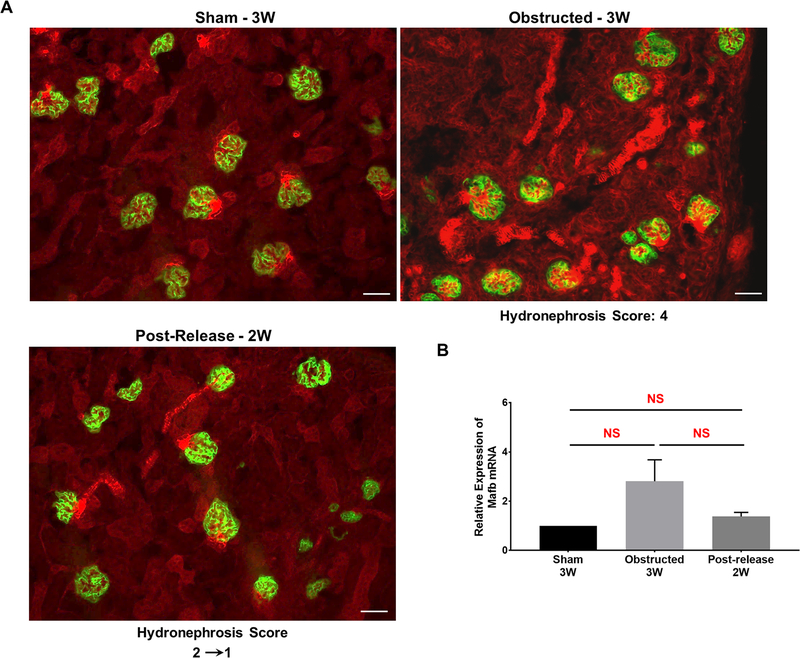
Contribution of podocyte-derived cells to renal tissue damage and repair was analyzed by crossing podocyte-specific Cre mice with the Cre reporter mTmG mice. All the surgical procedures were performed as described in Figure-1A. Lineage tracing in 3 weeks old animals showed that podocyte lineage (GFP+) cells were restricted to glomerular podocytes regardless of the presence or release of obstruction (Figure 14A). qRT-PCR expression analyses for Mafb, a podocyte progenitor cell marker [49] showed no significant changes due to obstruction and release of obstruction (Figure 14B).
Figure 14. The fate of podocyte derived cells during kidney damage and recovery:
(A) Kidney sections of sham operated Podocyte.Cre;mTmG mice showed the expression pattern of GFP restricted to podocytes. This expression pattern was not changed in obstructed and released kidneys. Scale bars, 50μm. (B) qRT-PCR analysis for podocyte progenitor cell specific Mafb expression in 3 week sham-operated (n=4), obstructed (n=6) and released (n=5) animals revealed no significant (NS) changes in kidneys due to surgical treatments.
10. Neogenesis and de-differentiation during repair and regeneration post-obstruction.
Cell proliferation was analyzed by quantifying phosphohistone-positive mitotic cells. There was a significant increase in actively dividing cells in 3 WO kidneys (n=3) compared to 3W sham kidneys (Sham n=3: 0.31±0.08×10⁻⁵/μm2 3W Obstructed n=4: 1.11±0.15×10⁻⁵/μm2; P<0.01). Proliferating mitotic cells were observed both in the tubular and interstitial compartments of the obstructed kidneys. Cell proliferation in post-released kidneys at 2 WR was similar to the sham-operated group (Released n=3: 0.39±0.18×10⁻⁵/μm2). This may indicate proliferation of differentiated cells, de-differentiation followed by proliferation and/or neogenesis [50]. Kidneys from obstructed and released groups of animals from Foxd1Cre;mTmG cross showed a discrete population of cells positive for the embryonic stem cell markers Oct 4 or Nanog and these cells were also double positive for GFP and RFP, consistent with neogenesis. Though the double positive cells were present in all groups, signals for embryonic stem cell markers were evident only in the obstructed and released kidneys (Figures S8 and S9).
Sox9 positive cells exhibit progenitor-like properties regulating regeneration of renal tubular epithelium in adult mice [51]. Tubular Sox9-positive cells increased in the obstructed kidney, and decreased following the release of obstruction (Figure S10).
These findings suggest the possible contribution of neogenesis accompanied with de-differentiation of more mature renal cells to pluripotent cells (or pluripotent-like cells) during kidney repair and regeneration.
Discussion
In this study we show that: i) During ureteral obstruction the neonatal kidneys undergo extensive vascular damage and release of obstruction results in regeneration of renal arterioles ii) The remarkable regeneration of the renal vasculature following the obstruction relief promotes renal blood flow iii) The release of obstruction resolves the damage to renal epithelial and interstitial cells, likely by decreasing hypoxia, renal oxidative stress, mitochondrial and FAO dysfunction iv) Foxd1-positive stromal-derived microvascular pericytes change their fate to putative myofibroblasts, thereby contribute to interstitial fibrosis in obstructed kidneys, and release of obstruction reverses these cell fate changes v) HoxB7 and Six2-derived tubular epithelial cells and podocyte-derived cells do not transdifferentiate to collagen producing myofibroblasts, but are lost during pUUO and can regenerate after release of obstruction.
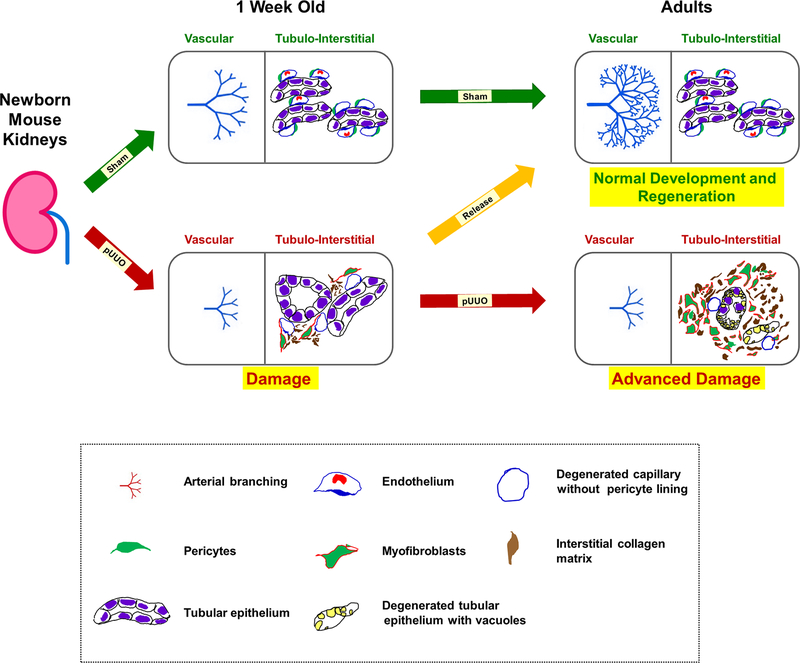
Our current study reveals the capacity of the developing mammalian kidney to resume vascular and nephron development and maturation following the release of pUUO created during nephrogenesis. Recovery is more complete when obstructive injury is moderate at the time of release, as over 96% of kidneys with moderate hydronephrosis recovered near-normal architecture, whereas only 36% of kidneys with severe hydronephrosis recovered. The pUUO model reproduces many characteristics of congenital ureteropelvic junction obstruction, the most common obstructive anomaly of the developing urinary tract, which also presents as a spectrum from mild to severe obstruction [52]. During neonatal pUUO, kidney vascular and tubulo-interstitial cells respond by interrupting normal development, and by shifting cellular differentiation to a pathway that leads to transformation of pericytes to myofibroblasts (Figure 15). Transition of myofibroblasts could exacerbate the renal damage by microvascular degeneration and interstitial collagen deposition. In addition, persistent obstruction leads to excessive nephro-vascular damage and loss (Figure 15). In contrast to the extensive vascular damage with stunting of renal arterial branching that results in decreased RBF during obstruction, release of obstruction resulted in a remarkable repair and regeneration of the renal vasculature (Figure 15). More importantly, our current study also indicates that the remarkable vascular regeneration observed post-release also improved the renal blood flow achieving levels similar to sham kidneys using two independent techniques at 2W and 5W post release. A previous study done in adult mice where RBF was measured as a ratio of RPF(renal plasma flow) to 1-hematocrit showed only 56% recovery after release [53]. These differences suggest that the recovery potential of the renal vasculature in the developing kidney is significantly higher than that of the adult kidney.
Figure 15. A proposed model of kidney injury and repair during obstruction and post-release in neonatal mouse kidneys:
Normal vasculogenesis and tubulogenesis through fetal and early postnatal life result in formation of the renal arterial tree and differentiated tubular epithelium in adulthood (green arrows). This process is dependent on a tightly regulated balance between a robust evolutionarily conserved morphogenetic program and constraints imposed by mutations, epigenetic factors, or environmental stressors, such as congenital urinary tract obstruction. Elevated levels of TGF-β1 mRNA observed during neonatal obstruction injury is proposed to increase the expression of α-SMA in pericytes, thereby transitioning them to collagen producing myofibroblasts. This cell fate change triggers a cascade of injury responses (red arrow) in the surrounding interstitium causing micro-vascular damage with pericyte effacement from the interstitial micro-vasculature and collagen deposition. Persistent obstruction advances the damage further (red arrow) due to continued transformation of pericytes to myofibroblasts. More importantly, the renal vasculature is severely affected with stunting of renal arterial branching resulting in decreased in RBF. In addition, there is tubular loss, migration of myofibroblasts to the interstitial space, and exacerbated collagen matrix deposition in the interstitium. Timely release of obstruction (orange arrow) impedes the tissue injury cascade by inhibiting the increases in TGF-β1 and α-SMA expression due to obstruction and reverses the balance to favor the normal pericyte phenotype, resumption of vascular branching, restoration of RBF and development of the nephron and collecting duct epithelium.
Furthermore, the contra-lateral kidneys of obstructed animals showed increase in the density of the arteriolar branches indicating a morphogenetic compensatory mechanism. The rate of compensatory kidney growth depends on duration and severity of injury in the obstructed kidneys [14, 54] and relief of obstruction decreased this phenomenon. The compensatory growth of the contra-lateral kidneys hitherto has been thought as a hypertrophic, maladaptive mechanism [55]. Ours is the first report showing that in fact the compensatory effect of the contra-lateral kidneys is a developmental phenomenon, as the renal vasculature displays increased branching morphogenesis. These results favor the process of angiogenesis rather than vasculogenesis. Nevertheless, the role of angioblasts in vascular regrowth remains to be explored. In addition, the role of pro-angiogenic molecules, factors promoting vascular myogenesis and arteriogenesis [56–58] in the interstitial milieu post-injury and release is not known and needs to be characterized. Identifying the cellular and molecular mechanisms promoting microvascular repair and regeneration will be critical for designing treatment strategies to hasten kidney repair in patients with chronic kidney diseases [59].
Recent studies in the neonatal mouse demonstrated that proximal tubule cells respond to UUO within the first 7 days of obstruction by increased oxidative stress, mitochondrial swelling, vacuolization and cell death [23]. The tubular response to obstruction is mediated by mechanical stretching of the epithelial cells, metabolic stress induced by mitochondrial injury, macrophage infiltration, hypoxia and marked up-regulation of TGF-β1 [60]. These factors also affect the redox state in the tissues and production of reactive oxygen species. Our current study confirms these observations and also provides additional information that release of obstruction preserves the tubular cells from undergoing: 1) extensive loss of primary cilia, mitochondria and other sub-cellular structures 2) dys-regulated fatty acid oxidation, 3) hypoxia and 4) oxidative stress. In addition to cell fate changes, increasing levels of TGF-β1 stimulates oxidative stress and cell death whereas inhibition of oxidative stress ameliorates tubular injury and interstitial fibrosis [33]. The decrease in TGF-β1 levels observed in the post-release kidneys likely contributes to remodeling of vasculature and nephrons. Identification of the upstream molecular regulators promoting the recovery of tissue damage following release of ureteral obstruction may lead to novel therapeutic strategies for obstructive nephropathy and other chronic kidney diseases.
TGF-β1 is the primary factor for the differentiation of pericytes to myofibroblasts and fibrosis activation in most chronic kidney diseases [61–65]. In the current study both TGF-β1 and αSMA expression levels were increased post-obstruction and normalized following release indicating that relief of obstruction reverts the injury and damage. As the microvasculature is stabilized by the interaction of pericytes with endothelial tubes [66–68] we predict that inhibition of TGF-β1 post-release of obstruction could promote reversal of cell fate changes, renewal of the pericyte population and the recruitment of pericytes to arteriolar and capillary walls. There is mounting evidence for the importance of stromal cells in balancing the switch between regeneration and fibrotic repair [69]. Elucidation of gene regulatory networks activated in the unique microenvironment of the developing kidney is likely to provide new insight into the regenerative mechanisms.
Our study in neonatal mice confirms that Foxd1 derived cells are the main contributors to the formation of myofibroblasts similar to adult kidneys [15, 70]. Whether there is any contribution of circulating Foxd1 derived cells in myofibroblast formation in obstructed kidneys remains to be determined. We found no direct contribution of tubular (nephron and collecting duct), podocyte, renin progenitors (data not shown) and their descendants to the formation of myofibroblasts or the progression of interstitial fibrosis. This suggest that stromal cells in the developing neonatal and early postnatal kidney while still capable of differentiating into their derivatives can also activate a cellular program similar to the one of adult kidneys in response to injury. Injury to nephrons and the interstitium have also been viewed as early attempts at repair [71] allowing for regeneration when the obstruction is released. However, this hypothesis needs to be proven experimentally. From an evolutionary perspective, allocation of energy for maintaining nonfunctioning nephrons must be limited, accounting for “failed repair” during persistent obstruction [72]. Importantly, compared to the adult kidney, enhanced renal recovery of the post-obstructed neonatal kidney is consistent with greater allocation of energy to both growth and regeneration in the pre-reproductive phase of the life cycle.
Similar to the adult mouse models, [15, 73, 74] the current study in neonatal mice demonstrates an increase in cell proliferation and no dilution of the genetic labelling in tissues undergoing repair. Moreover, presence of GFP and RFP double positive cell clusters with stem cell markers OCT4 or Nanog in the present study raises the possibility of neogenesis, MRPCs (multi potent renal progenitor cells) and VSELs (very small embryonic like stem cells) in tissue repair [75–77], similar to the formation of neoblasts or blastema that gives rise to differentiated cells during regeneration in planarians, fish and Axolotl [78–81]. This regeneration pathway may be suppressed by the presence of severe ureteral obstruction during nephron maturation but could be unmasked by release of obstruction.
In summary, using a pUUO model in neonatal mice, our study fills an important gap in the field and provides compelling evidence on the origin of cells directly contributing to the tissue damage and regeneration in neonatal obstructive nephropathy. Our study also underscores the importance of timely release of obstruction in the developing kidney [82] and the crucial role of the vasculature and associated nephrons in the tissue repair following the release of obstruction. Identifying the mechanisms and molecular targets mediating the repair and regeneration following the release of obstruction would be of paramount importance for the development of therapeutic interventions in the prevention and/or treatment of chronic kidney diseases in pediatric and adult patients.
Supplementary Material
Clinical Perspectives.
Congenital obstructive nephropathy is the leading cause of chronic kidney disease in children. Using a mouse model that replicates obstruction in the mid-trimester human fetus, we identified the major renal progenitors and their descendants that contribute to kidney damage and regeneration during obstruction and after its release, respectively.
We observed extensive cell fate changes in stromal cell derivatives and nephronvascular loss during obstruction. Surgical correction of the obstruction reverses cellular damage and cell fate changes and the kidney vasculature and tubularinterstitial compartments regenerate. The remarkable structural and functional recovery and regeneration following release of the obstructed neonatal kidney suggests that surgical correction of congenital obstructive nephropathy should not be delayed.
Deciphering the cellular and molecular mechanisms involved in nephron-vascular repair and regeneration post-release of obstruction has potential therapeutic implications for infants and children and the expanding adult population suffering from chronic kidney disease.
Acknowledgements
We thank Dr. Silvia Medrano and Dr. Brian Belyea for reading the manuscript and providing suggestions and the technical assistance of Danielle Stumbo, Tiffany Southard and Xiuyin Liang. We thank the UVA molecular imaging core facilities for MRI scans performed in the current study.
Funding
This work was supported by National Institutes of Health grants DK091330, DK096373 and DK116196 to M.L.S.S.L.
Abbreviations List
- 4-HNE
4 Hydroxynonenal
- α-SMA
Alpha-smooth muscle actin Acox1,Acyl-Coenzyme A oxidase 1, palmitoyl
- Acox2
Acyl-Coenzyme A oxidase 2, branched chain
- CKD
chronic kidney disease
- Cox4
Cytochrome c oxidase subunit 4I1
- Cpt1a
Carnitine palmitoyltransferase 1a, liver
- Cpt2
Carnitine palmitoyltransferase 2
- Cre
Cre Recombinase
- Ct
cycle threshold
- FAO
Fatty Acid Oxidation
- Foxd1
Forkhead Box D1
- GFP
Green fluorescent protein
- HCl
Hydrochloric acid
- HI
Hydronephrosis Index
- Hif1α
Hypoxia-inducible factor 1-alpha
- Hif2α
Epas1 endothelial PAS domain protein 1
- HO
Heme oxygenase-1
- Hoxb7
Homeobox B7
- Mafb
v-maf musculoaponeurotic fibrosarcoma oncogene family, protein B
- mG
membrane-targeted green fluorescent protein
- mT
membrane-targeted tandem dimer Tomato
- Nanog
Nanog homeobox
- Nrf1
Nuclear respiratory factor 1
- Nrf2
Nuclear factor, erythroid derived 2, like 2
- Oct4
POU domain, class 5, transcription factor 1
- Parkn
Parkin RBR E3 ubiquitin protein ligase
- PDGFRβ
platelet derived growth factor receptor, beta polypeptide
- PECAM
Platelet Endothelial Cell Adhesion Molecule-1
- PPARα1
Peroxisome proliferator activated receptor alpha
- pUUO
partial unilateral ureteral obstruction
- qRT-PCR
Quantitative -Reverse transcription- Polymerase chain reaction
- RBF
Renal Blood Flow
- RFP
red fluorescent protein
- RPF
Renal Plasma Flow
- Rps14
Ribosomal Protein S14
- SEM
standard error of the mean
- Six2
Sine Oculis Homeobox Homolog 2
- Sox9
SRY (sex determining region Y)-box 9
- spASL
steady-pulsed arterial spin labeling
- STEM
Scanning Transmission Electron Microscopy
- Tfam
Transcription factor A, mitochondrial
- TGC
Tet-off-eGFPCre
- TGF-β1
transforming growth factor, beta 1
- UB
ureteric bud
- US
Ultrasound
- VSELs
very small embryonic like stem cells
- WO
weeks after obstruction
- WR
weeks after release
Footnotes
Competing interests
The authors declare that there are no competing interests associated with the manuscript.
References:
- 1.Liapis H (2003). Biology of Congenital Obstructive Nephropathy. Nephron Exp Nephrol. 93, 87–91, 10.1159/000069554 [DOI] [PubMed] [Google Scholar]
- 2.Ingraham SE, and McHugh KM (2011). Current perspectives on congenital obstructive nephropathy. Pediatr Nephrol. 26, 1453–1461, 10.1007/s00467-011-1799-8 [DOI] [PubMed] [Google Scholar]
- 3.Chevalier RL (2015). Congenital urinary tract obstruction: the long view. Adv Chronic Kidney Dis. 22, 312–319, 10.1053/j.ackd.2015.01.012 [DOI] [PMC free article] [PubMed] [Google Scholar]
- 4.Guerin F, Azoulay R, Berrebi D, Sebag G, Aigrain Y, Peuchmaur M, and El-Ghoneimi A (2008). Partial unilateral ureteral obstruction in newborn mice: magnetic resonance imaging and pathology studies. J Urol. 179, 1553–1563, 10.1016/j.juro.2007.11.088 [DOI] [PubMed] [Google Scholar]
- 5.Thornhill BA, and Chevalier RL (2012). Variable partial unilateral ureteral obstruction and its release in the neonatal and adult mouse. Methods Mol Biol. 886, 381–392, 10.1007/978-1-61779-851-1_33 [DOI] [PubMed] [Google Scholar]
- 6.Botto N, Azoulay R, Peuchmaur M, and El Ghoneimi A (2011). Renal parenchymal fibrosis and atrophy are not correlated with upper tract dilatation: long-term study of partial unilateral ureteral obstruction in neonatal mice. J Pediatr Urol. 7, 310–316, 10.1016/j.jpurol.2011.02.022 [DOI] [PubMed] [Google Scholar]
- 7.Chevalier RL (2008). Chronic partial ureteral obstruction and the developing kidney. Pediatr Radiol. 38, S35–40, 10.1007/s00247-007-0585-z [DOI] [PubMed] [Google Scholar]
- 8.Eskild-Jensen A, Frokiaer J, Djurhuus JC, Jorgensen TM, and Nyengaard JR (2002). Reduced number of glomeruli in kidneys with neonatally induced partial ureteropelvic obstruction in pigs. J Urol. 167, 1435–1439, 10.1016/S0022-5347(05)65338-4 [DOI] [PubMed] [Google Scholar]
- 9.Chevalier RL, Forbes MS, Galarreta CI, and Thornhill BA (2014). Responses of proximal tubular cells to injury in congenital renal disease: fight or flight. Pediatr Nephrol. 29, 537–541, 10.1007/s00467-013-2590-9 [DOI] [PMC free article] [PubMed] [Google Scholar]
- 10.Hinchliffe SA, Sargent PH, Howard CV, Chan YF, and van Velzen D (1991). Human intrauterine renal growth expressed in absolute number of glomeruli assessed by the disector method and Cavalieri principle. Lab Invest. 64, 777–784, https://www.ncbi.nlm.nih.gov/pubmed/2046329 [PubMed] [Google Scholar]
- 11.Hartman HA, Lai HL, and Patterson LT (2007). Cessation of renal morphogenesis in mice. Dev Biol. 310, 379–387, 10.1016/j.ydbio.2007.08.021 [DOI] [PMC free article] [PubMed] [Google Scholar]
- 12.Rumballe BA, Georgas KM, Combes AN, Ju AL, Gilbert T, and Little MH (2011). Nephron formation adopts a novel spatial topology at cessation of nephrogenesis. Dev Biol. 360, 110–122, 10.1016/j.ydbio.2011.09.011 [DOI] [PMC free article] [PubMed] [Google Scholar]
- 13.Short KM, Combes AN, Lefevre J, Ju AL, Georgas KM, Lamberton T, Cairncross O, Rumballe BA, McMahon AP, Hamilton NA, et al. (2014). Global quantification of tissue dynamics in the developing mouse kidney. Dev Cell. 29, 188–202, 10.1016/j.devcel.2014.02.017 [DOI] [PubMed] [Google Scholar]
- 14.Thornhill BA, Forbes MS, Marcinko ES, and Chevalier RL (2007). Glomerulotubular disconnection in neonatal mice after relief of partial ureteral obstruction. Kidney Int. 72, 1103–1112, 10.1038/sj.ki.5002512 [DOI] [PubMed] [Google Scholar]
- 15.Humphreys BD, Lin SL, Kobayashi A, Hudson TE, Nowlin BT, Bonventre JV, Valerius MT, McMahon AP, and Duffield JS (2010). Fate tracing reveals the pericyte and not epithelial origin of myofibroblasts in kidney fibrosis. Am J Pathol. 176, 85–97, 10.2353/ajpath.2010.090517 [DOI] [PMC free article] [PubMed] [Google Scholar]
- 16.Kobayashi A, Valerius MT, Mugford JW, Carroll TJ, Self M, Oliver G, and McMahon AP (2008). Six2 defines and regulates a multipotent self-renewing nephron progenitor population throughout mammalian kidney development. Cell Stem Cell. 3,169–81, 10.1016/j.stem.2008.05.020 [DOI] [PMC free article] [PubMed] [Google Scholar]
- 17.Yu J, Carroll TJ, and McMahon AP (2002). Sonic hedgehog regulates proliferation and differentiation of mesenchymal cells in the mouse metanephric kidney. Development. 129, 5301–5312, https://www.ncbi.nlm.nih.gov/pubmed/12399320 [DOI] [PubMed] [Google Scholar]
- 18.Muzumdar MD, Tasic B, Miyamichi K, Li L, and Luo L (2007). A global double-fluorescent Cre reporter mouse. Genesis. 45, 593–605, 10.1002/dvg.20335 [DOI] [PubMed] [Google Scholar]
- 19.Sequeira-Lopez ML, Weatherford ET, Borges GR, Monteagudo MC, Pentz ES, Harfe BD, Carretero O, Sigmund CD, and Gomez RA (2010). The microRNA-processing enzyme dicer maintains juxtaglomerular cells. J Am Soc Nephrol. 21, 460–467, 10.1681/ASN.2009090964 [DOI] [PMC free article] [PubMed] [Google Scholar]
- 20.Mehlem A, Hagberg CE, Muhl L, Eriksson U, and Falkevall A (2013). Imaging of neutral lipids by oil red O for analyzing the metabolic status in health and disease. Nat Protoc. 8, 1149–1154, 10.1038/nprot.2013.055 [DOI] [PubMed] [Google Scholar]
- 21.Sequeira-Lopez ML, Nagalakshmi VK, Li M, Sigmund CD, and Gomez RA (2015). Vascular versus tubular renin: role in kidney development. Am J Physiol Regul Integr Comp Physiol. 309, 650–657, 10.1152/ajpregu.00313.2015 [DOI] [PMC free article] [PubMed] [Google Scholar]
- 22.Thornhill BA, Forbes MS, Marcinko ES, and Chevalier RL (2007). Glomerulotubular disconnection in neonatal mice after relief of partial ureteral obstruction. Kidney Int. 72, 1103–1112, 10.1038/sj.ki.5002512 [DOI] [PubMed] [Google Scholar]
- 23.Forbes MS, Thornhill BA, Galarreta CI, Minor JJ, Gordon KA, and Chevalier RL (2013). Chronic unilateral ureteral obstruction in the neonatal mouse delays maturation of both kidneys and leads to late formation of atubular glomeruli. Am J Physiol Renal Physiol. 305, 1736–1746, 10.1152/ajprenal.00152.2013 [DOI] [PMC free article] [PubMed] [Google Scholar]
- 24.Belyea BC, Xu F, Pentz ES, Medrano S, Li M, Hu Y, Turner S, Legallo R, Jones CA, Tario JD, et al. (2014). Identification of renin progenitors in the mouse bone marrow that give rise to B-cell leukaemia. Nat Commun. 5, 3273, 10.1038/ncomms4273 [DOI] [PMC free article] [PubMed] [Google Scholar]
- 25.Reddi V, Zaglul A, Pentz ES, and Gomez RA (1998). Renin-expressing cells are associated with branching of the developing kidney vasculature. J Am Soc Nephrol. 9, 63–71, http://jasn.asnjournals.org/content/9/1/63.abstract [DOI] [PubMed] [Google Scholar]
- 26.Chu PL, Gigliotti JC, Cechova S, Bodonyi-Kovacs G, Chan F, Ralph DL, Howell N, Kalantari K, Klibanov AL, Carey RM, et al. (2017). Renal Collectrin Protects against Salt-Sensitive Hypertension and Is Downregulated by Angiotensin II. J Am Soc Nephrol. 28, 1826–1837, 10.1681/ASN.2016060675 [DOI] [PMC free article] [PubMed] [Google Scholar]
- 27.Troalen T, Capron T, Cozzone PJ, Bernard M, and Kober F (2013). Cine-ASL: a steady-pulsed arterial spin labeling method for myocardial perfusion mapping in mice. Part I. Experimental study. Magn Reson Med. 70, 1389–1398, 10.1002/mrm.24565 [DOI] [PubMed] [Google Scholar]
- 28.Privratsky JR, and Newman PJ (2014). PECAM-1: regulator of endothelial junctional integrity. Cell Tissue Res. 355, 607–619, 10.1007/s00441-013-1779-3 [DOI] [PMC free article] [PubMed] [Google Scholar]
- 29.Meyer G, Czompa A, Reboul C, Csepanyi E, Czegledi A, Bak I, Balla G, Balla J, Tosaki A, and Lekli I (2013). The cellular autophagy markers Beclin-1 and LC3B-II are increased during reperfusion in fibrillated mouse hearts. Curr Pharm Des. 19, 6912–6918, 10.2174/138161281939131127122510 [DOI] [PubMed] [Google Scholar]
- 30.Han SJ, Jang HS, Seu SY, Cho HJ, Hwang YJ, Kim JI, and Park KM (2017). Hepatic ischemia/reperfusion injury disrupts the homeostasis of kidney primary cilia via oxidative stress. Biochim Biophys Acta Mol Basis Dis. 1863, 1817–1828, 10.1016/j.bbadis.2017.05.004 [DOI] [PubMed] [Google Scholar]
- 31.Deane JA, and Ricardo SD (2012). Emerging roles for renal primary cilia in epithelial repair. Int Rev Cell Mol Biol. 293, 169–193, 10.1016/B978-0-12-394304-0.00011-7 [DOI] [PubMed] [Google Scholar]
- 32.Kawada N, Moriyama T, Ando A, Fukunaga M, Miyata T, Kurokawa K, Imai E, and Hori M (1999). Increased oxidative stress in mouse kidneys with unilateral ureteral obstruction. Kidney Int 56, 1004–1013, 10.1046/j.1523-1755.1999.00612.x [DOI] [PubMed] [Google Scholar]
- 33.Dendooven A, Ishola DA Jr., Nguyen TQ, Van der Giezen DM, Kok RJ, Goldschmeding R, and Joles JA (2011). Oxidative stress in obstructive nephropathy. Int J Exp Pathol. 92, 202–210, 10.1111/j.1365-2613.2010.00730.x [DOI] [PMC free article] [PubMed] [Google Scholar]
- 34.Ozbek E (2012). Induction of oxidative stress in kidney. Int J Nephrol, 465897, 10.1155/2012/465897 [DOI] [PMC free article] [PubMed] [Google Scholar]
- 35.Pat B, Yang T, Kong C, Watters D, Johnson DW, and Gobe G (2005). Activation of ERK in renal fibrosis after unilateral ureteral obstruction: modulation by antioxidants. Kidney Int. 67, 931–943, 10.1111/j.1523-1755.2005.00157.x [DOI] [PubMed] [Google Scholar]
- 36.Galarreta CI, Forbes MS, Thornhill BA, Antignac C, Gubler MC, Nevo N, Murphy MP, and Chevalier RL (2015). The swan-neck lesion: proximal tubular adaptation to oxidative stress in nephropathic cystinosis. Am J Physiol Renal Physiol. 308, 1155–1166, 10.1152/ajprenal.00591.2014 [DOI] [PubMed] [Google Scholar]
- 37.Sugiyama H, Kobayashi M, Wang DH, Sunami R, Maeshima Y, Yamasaki Y, Masuoka N, Kira S, and Makino H (2005). Telmisartan inhibits both oxidative stress and renal fibrosis after unilateral ureteral obstruction in acatalasemic mice. Nephrol Dial Transplant. 20, 2670–2680, 10.1093/ndt/gfi045 [DOI] [PubMed] [Google Scholar]
- 38.Galvan DL, Green NH, and Danesh FR (2017). The hallmarks of mitochondrial dysfunction in chronic kidney disease. Kidney Int. 92, 1051–1057, 10.1016/j.kint.2017.05.034 [DOI] [PMC free article] [PubMed] [Google Scholar]
- 39.Nsiah-Sefaa A, and McKenzie M (2016). Combined defects in oxidative phosphorylation and fatty acid beta-oxidation in mitochondrial disease. Biosci Rep. 36, e00313, http://www.bioscirep.org/content/36/2/e00313 [DOI] [PMC free article] [PubMed] [Google Scholar]
- 40.Wajner M, and Amaral AU (2015). Mitochondrial dysfunction in fatty acid oxidation disorders: insights from human and animal studies. Biosci Rep. 36, e00281 http://www.bioscirep.org/content/36/1/e00281 [DOI] [PMC free article] [PubMed] [Google Scholar]
- 41.Li SY, Fu ZJ, and Lo AC (2012). Hypoxia-induced oxidative stress in ischemic retinopathy. Oxid Med Cell Longev. 426769, 10.1155/2012/426769 [DOI] [PMC free article] [PubMed] [Google Scholar]
- 42.Araneda OF, and Tuesta M (2012). Lung oxidative damage by hypoxia. Oxid Med Cell Longev. 856918, 10.1155/2012/856918 [DOI] [PMC free article] [PubMed] [Google Scholar]
- 43.Kang HM, Ahn SH, Choi P, Ko YA, Han SH, Chinga F, Park AS, Tao J, Sharma K, Pullman J, et al. (2015). Defective fatty acid oxidation in renal tubular epithelial cells has a key role in kidney fibrosis development. Nat Med. 21, 37–46, https://www.nature.com/articles/nm.3762 [DOI] [PMC free article] [PubMed] [Google Scholar]
- 44.Poirier Y, Antonenkov VD, Glumoff T, and Hiltunen JK (2006). Peroxisomal beta-oxidation--a metabolic pathway with multiple functions. Biochim Biophys Acta. 1763, 1413–1426, 10.1016/j.bbamcr.2006.08.034 [DOI] [PubMed] [Google Scholar]
- 45.Scarpulla RC, Vega RB, and Kelly DP (2012). Transcriptional integration of mitochondrial biogenesis. Trends Endocrinol Metab. 23, 459–466, 10.1016/j.tem.2012.06.006 [DOI] [PMC free article] [PubMed] [Google Scholar]
- 46.Palikaras K, and Tavernarakis N (2014). Mitochondrial homeostasis: the interplay between mitophagy and mitochondrial biogenesis. Exp Gerontol. 56, 182–188, 10.1016/j.exger.2014.01.021 [DOI] [PubMed] [Google Scholar]
- 47.Fernandez-Checa JC, Fernandez A, Morales A, Mari M, Garcia-Ruiz C, and Colell A (2010). Oxidative stress and altered mitochondrial function in neurodegenerative diseases: lessons from mouse models. CNS Neurol Disord Drug Targets 9, 439–454, 10.2174/187152710791556113 [DOI] [PubMed] [Google Scholar]
- 48.Sequeira-Lopez ML, Lin EE, Li M, Hu Y, Sigmund CD, and Gomez RA (2014). The earliest metanephric arteriolar progenitors and their role in kidney vascular development. Am J Physiol Regul Integr Comp Physiol. 308, 138–149, 10.1152/ajpregu.00428.2014 [DOI] [PMC free article] [PubMed] [Google Scholar]
- 49.Brunskill EW, Georgas K, Rumballe B, Little MH, and Potter SS (2011). Defining the molecular character of the developing and adult kidney podocyte. PloS one 6, 24640, 10.1371/journal.pone.0024640 [DOI] [PMC free article] [PubMed] [Google Scholar]
- 50.Hickmann L, Steglich A, Gerlach M, Al-Mekhlafi M, Sradnick J, Lachmann P, Sequeira-Lopez MLS, Gomez RA, Hohenstein B, Hugo C, et al. (2017). Persistent and inducible neogenesis repopulates progenitor renin lineage cells in the kidney. Kidney Int. 92, 1419–1432, 10.1016/j.kint.2017.04.014 [DOI] [PMC free article] [PubMed] [Google Scholar]
- 51.Kang HM, Huang S, Reidy K, Han SH, Chinga F, and Susztak K (2016). Sox9-Positive Progenitor Cells Play a Key Role in Renal Tubule Epithelial Regeneration in Mice. Cell reports 14, 861–871, 10.1016/j.celrep.2015.12.071 [DOI] [PMC free article] [PubMed] [Google Scholar]
- 52.Rosen S, Peters CA, Chevalier RL, and Huang WY (2008). The kidney in congenital ureteropelvic junction obstruction: a spectrum from normal to nephrectomy. J Urol. 179, 1257–1263, 10.1016/j.juro.2007.11.048 [DOI] [PubMed] [Google Scholar]
- 53.Chaabane W, Praddaude F, Buleon M, Jaafar A, Vallet M, Rischmann P, Galarreta CI, Chevalier RL, and Tack I (2013). Renal functional decline and glomerulotubular injury are arrested but not restored by release of unilateral ureteral obstruction (UUO). Am J Physiol Renal Physiol. 15, 432–439, 10.1152/ajprenal.00425.2012 [DOI] [PubMed] [Google Scholar]
- 54.Yoo KH, Thornhill BA, Forbes MS, and Chevalier RL (2006). Compensatory renal growth due to neonatal ureteral obstruction: implications for clinical studies. Pediatr Nephrol. 21, 368–375, 10.1007/s00467-005-2119-y [DOI] [PubMed] [Google Scholar]
- 55.Fong D, Denton KM, Moritz KM, Evans R, and Singh RR (2014). Compensatory responses to nephron deficiency: adaptive or maladaptive? Nephrology 19, 119–128, 10.1111/nep.12198 [DOI] [PubMed] [Google Scholar]
- 56.Bergers G, and Song S (2005). The role of pericytes in blood-vessel formation and maintenance. Neuro Oncol. 7, 452–464, 10.1215/S1152851705000232 [DOI] [PMC free article] [PubMed] [Google Scholar]
- 57.Sequeira Lopez ML, and Gomez RA (2011). Development of the renal arterioles. J Am Soc Nephrol. 22, 2156–2165, 10.1681/ASN.2011080818 [DOI] [PMC free article] [PubMed] [Google Scholar]
- 58.Gaengel K, Genove G, Armulik A, and Betsholtz C (2009). Endothelial-mural cell signaling in vascular development and angiogenesis. Arterioscler Thromb Vasc Biol. 29, 630–638, 10.1161/ATVBAHA.107.161521 [DOI] [PubMed] [Google Scholar]
- 59.Babickova J, Klinkhammer BM, Buhl EM, Djudjaj S, Hoss M, Heymann F, Tacke F, Floege J, Becker JU, and Boor P (2017). Regardless of etiology, progressive renal disease causes ultrastructural and functional alterations of peritubular capillaries. Kidney Int. 91, 70–85, 10.1016/j.kint.2016.07.038 [DOI] [PubMed] [Google Scholar]
- 60.Chevalier RL, Thornhill BA, Forbes MS, and Kiley SC (2010). Mechanisms of renal injury and progression of renal disease in congenital obstructive nephropathy. Pediatr Nephrol. 25, 687–697, 10.1007/s00467-009-1316-5 [DOI] [PubMed] [Google Scholar]
- 61.Schrimpf C, Xin C, Campanholle G, Gill SE, Stallcup W, Lin SL, Davis GE, Gharib SA, Humphreys BD, and Duffield JS (2012). Pericyte TIMP3 and ADAMTS1 modulate vascular stability after kidney injury. J Am Soc Nephrol. 23, 868–883, 10.1681/ASN.2011080851 [DOI] [PMC free article] [PubMed] [Google Scholar]
- 62.Meng XM, Nikolic-Paterson DJ, and Lan HY (2016). TGF-beta: the master regulator of fibrosis. Nat Rev Nephrol. 12, 325–338, 10.1038/nrneph.2016.48 [DOI] [PubMed] [Google Scholar]
- 63.Fischer C, Deininger N, Wolf G, and Loeffler I (2018). CERA Attenuates Kidney Fibrogenesis in the db/db Mouse by Influencing the Renal Myofibroblast Generation. J Clin Med. 7, 2077–0383, 10.3390/jcm7020015 [DOI] [PMC free article] [PubMed] [Google Scholar]
- 64.Siani A, and Tirelli N (2014). Myofibroblast differentiation: main features, biomedical relevance, and the role of reactive oxygen species. Antioxid Redox Signal. 21, 768–785, 10.1089/ars.2013.5724 [DOI] [PubMed] [Google Scholar]
- 65.Sun YB, Qu X, Caruana G, and Li J (2016). The origin of renal fibroblasts/myofibroblasts and the signals that trigger fibrosis. Differentiation. Research in Biological Diversity 92, 102–107, 10.1016/j.diff.2016.05.008 [DOI] [PubMed] [Google Scholar]
- 66.Davis GE, Kim DJ, Meng CX, Norden PR, Speichinger KR, Davis MT, Smith AO, Bowers SL, and Stratman AN (2013). Control of vascular tube morphogenesis and maturation in 3D extracellular matrices by endothelial cells and pericytes. Methods Mol Biol. 1066, 17–28, 10.1007/978-1-62703-604-7_2 [DOI] [PubMed] [Google Scholar]
- 67.Davis GE, Norden PR, and Bowers SL (2015). Molecular control of capillary morphogenesis and maturation by recognition and remodeling of the extracellular matrix: functional roles of endothelial cells and pericytes in health and disease. Connect Tissue Res. 56, 392–402, 10.3109/03008207.2015.1066781 [DOI] [PMC free article] [PubMed] [Google Scholar]
- 68.Bowers SL, Norden PR, and Davis GE (2016). Molecular Signaling Pathways Controlling Vascular Tube Morphogenesis and Pericyte-Induced Tube Maturation in 3D Extracellular Matrices. Adv Pharmacol. 77, 241–280, 10.1016/bs.apha.2016.04.005 [DOI] [PubMed] [Google Scholar]
- 69.Rabelink TJ, and Little MH (2013). Stromal cells in tissue homeostasis: balancing regeneration and fibrosis. Nat Rev Nephrol. 9, 747–753, 10.1038/nrneph.2013.152 [DOI] [PubMed] [Google Scholar]
- 70.Lin SL, Kisseleva T, Brenner DA, and Duffield JS (2008). Pericytes and perivascular fibroblasts are the primary source of collagen-producing cells in obstructive fibrosis of the kidney. Am J Pathol. 173, 1617–1627, 10.2353/ajpath.2008.080433 [DOI] [PMC free article] [PubMed] [Google Scholar]
- 71.Kaissling B, Lehir M, and Kriz W (2013). Renal epithelial injury and fibrosis. Biochim Biophys Acta. 1832, 931–939, 10.1016/j.bbadis.2013.02.010 [DOI] [PubMed] [Google Scholar]
- 72.Chevalier RL (2017). Evolutionary Nephrology. Kidney Int Rep. 2, 302–317, 10.1016/j.ekir.2017.01.012 [DOI] [PMC free article] [PubMed] [Google Scholar]
- 73.Angelotti ML, Ronconi E, Ballerini L, Peired A, Mazzinghi B, Sagrinati C, Parente E, Gacci M, Carini M, Rotondi M, et al. (2012). Characterization of renal progenitors committed toward tubular lineage and their regenerative potential in renal tubular injury. Stem Cells 30, 1714–25, 10.1002/stem.1130 [DOI] [PubMed] [Google Scholar]
- 74.Little MH, and Kairath P (2016). Regenerative medicine in kidney disease. Kidney Int. 90, 289–299, 10.1016/j.kint.2016.03.030 [DOI] [PubMed] [Google Scholar]
- 75.Kim Y, Jeong J, Kang H, Lim J, Heo J, Ratajczak J, Ratajczak MZ, and Shin DM (2014). The molecular nature of very small embryonic-like stem cells in adult tissues. Int J Stem Cells. 7, 55–62, 10.15283/ijsc.2014.7.2.55 [DOI] [PMC free article] [PubMed] [Google Scholar]
- 76.Shin DM, Liu R, Klich I, Ratajczak J, Kucia M, and Ratajczak MZ (2010). Molecular characterization of isolated from murine adult tissues very small embryonic/epiblast like stem cells (VSELs). Mol Cells. 29, 533–538, 10.1007/s10059-010-0081-4 [DOI] [PubMed] [Google Scholar]
- 77.Takaori K, and Yanagita M (2014). Kidney regeneration and stem cells. Anat Rec 297, 129–136, 10.1002/ar.22801 [DOI] [PubMed] [Google Scholar]
- 78.Tanaka EM (2003). Cell differentiation and cell fate during urodele tail and limb regeneration. Curr Opin Genet Dev. 13, 497–501, https://www.ncbi.nlm.nih.gov/pubmed/14550415 [DOI] [PubMed] [Google Scholar]
- 79.Tanaka EM, and Reddien PW (2011). The cellular basis for animal regeneration. Dev Cell. 21, 172–85, 10.1016/j.devcel.2011.06.016 [DOI] [PMC free article] [PubMed] [Google Scholar]
- 80.Slack JM (2006). Amphibian muscle regeneration-dedifferentiation or satellite cells? Trends Cell Biol. 16, 273–5, 10.1016/j.tcb.2006.04.007 [DOI] [PubMed] [Google Scholar]
- 81.Tanaka EM, and Weidinger G (2008). Micromanaging regeneration. Genes Dev. 22, 700–5, 10.1101/gad.1660508 [DOI] [PMC free article] [PubMed] [Google Scholar]
- 82.Peters CA (1995). Urinary tract obstruction in children. J Urol. 154, 1874–83, https://www.ncbi.nlm.nih.gov/pubmed/7563375 [DOI] [PubMed] [Google Scholar]
Associated Data
This section collects any data citations, data availability statements, or supplementary materials included in this article.


