

Abstract
Lateral spine images are captured using bone densitometers for vertebral fracture assessment (VFA) in older women. Abdominal aortic calcification (AAC) is commonly seen on these images; however, the long-term prognosis in women with AAC remains uncertain. In a prospective study of 1052 community-dwelling ambulant white women over 70 years old abdominal aortic calcification 24 scale (AAC24) scores were calculated from digital lateral spine images captured during bone density testing in 1998 or 1999. Cardiovascular risk factors were assessed in 1998, whereas 14.5-year atherosclerotic vascular disease (ASVD)-related hospitalizations and deaths (events) were available through linked health records. Using established cut points for AAC 471 women (45%) had low AAC (AAC24 score 0 or 1), 387 (37%) moderate AAC (AAC24 score 2–5), and 197 (19%) had high AAC (AAC24 score ≥6). Over 14.5 years, 420 women experienced an ASVD event. Increasing severity of AAC was associated with increased absolute risk of ASVD events (37%, 39%, and 49%, respectively, p = 0.008 for trend), ASVD deaths (15%, 21%, and 27%, respectively, p < 0.001 for trend), and all-cause mortality (30%, 38%, and 44%, respectively, p < 0.001 for trend). After adjusting for Framingham risk scores, women with high AAC had increased relative hazard for ASVD events, HR 1.37 (95% CI, 1.07 to 1.77; p = 0.013) compared to women with low AAC. Similarly, women with moderate AAC and high AAC had increased relative hazards for ASVD deaths HR 1.41 (95% CI, 1.03 to 1.94; p = 0.034) and HR 1.80 (95% CI, 1.26 to 2.57; p = 0.001), or any deaths HR 1.30 (95% CI, 1.03 to 1.64; p = 0.026) and HR 1.53 (95% CI, 1.17 to 2.00; p = 0.002), compared to women with low AAC. In conclusion, more advanced AAC on images captured for VFA is associated with long-term ASVD hospitalizations and deaths before and after adjusting for Framingham risk scores. AAC assessment could be considered in addition to VFA to identify individuals who may benefit for more aggressive cardiovascular primary prevention strategies.
Keywords: AGING, CARDIOVASCULAR DISEASE, EPIDEMIOLOGY
Introduction
Primary prevention strategies for osteoporotic fractures in elderly women are driven by screening measurements of bone mineral density testing using dual-energy X-ray absorptiometry (DXA) machines. These machines can also capture lateral images of the thoracic and lumbar spine to evaluate the presence of vertebral fractures quickly and reproducibly. Capturing these images also exposes the patients to substantially lower radiation exposure than plain radiographs of the spine(1) and are a cost-effective approach to identify future fracture risk. Thus such measurements are indicated in many patients referred for osteoporosis assessment(2)
Calcification of the blood vessels walls, particularly the large vessels such as the abdominal aorta and iliac arteries, is also commonly seen on these lateral spine images.(3) These calcifications can be visualized and semiquantitatively scored using the Kaupilla abdominal aortic calcification 24 scale (AAC24),(4) which has been shown to have good to very good agreement to AAC24 assessed using standard radiographs.(5,6)Because large numbers of elderly women are already undergoing routine bone densitometry, the use of these lateral spine images to identify women with subclinical cardiovascular disease (CVD) (or AAC) who are at a higher risk of future cardiovascular events may help to inform future treatment decisions. Additionally, using these images may form the basis of low-cost routine community-based initiatives to improve current CVD prevention strategies such as weight loss, improved diet, and increased physical activity, as well as drug therapy with statins.
This study extends upon findings from a 5-year prospective cohort study of 1471 women (mean age 72 years) that found the presence of any AAC was associated with increased risk of myocardial infarctions but not cardiovascular events or strokes after adjusting for Framingham risk scores (FRS) as well as a case-control study of 732 women aged over 75 years, with a median of 4 years of follow-up that graded the severity of AAC into low (AAC24 score 0 or 1), moderate (AAC24 score 2–5), and high (AAC24 score ≥ 6) and reported an increase in myocardial infarction and stroke risk with increasing AAC severity category.(7)
Similar to cardiovascular risk factors, structural CVD progresses over many years and may be exacerbated or attenuated by numerous factors. To establish the prognosis of women with differing severities of AAC, studies with long-term follow-up are needed, particularly because less advanced structural CVD may take a decade or more to become symptomatic. Furthermore, characterizing the time course of asymptomatic to clinical disease provides important information for primary prevention strategies that focusing on individuals with a longer estimated life expectancy.
Therefore, in this study we investigated the association between AAC severity using the established cut points with long-term cardiovascular risk and prognosis in elderly women. Additionally, previous studies relied upon receiver-operating characteristic (ROC) curve analyses, known to lack sensitivity to quantify the additional contribution of new risk factors to established risk indexes. We therefore sought to investigate whether the addition of AAC to established risk indexes improved measures of discrimination including ROC, net reclassification and integrated discrimination improvements.
Materials and Methods
This article complies with the STROBE reporting guidelines for observational studies.
Ethics statement
Written informed consent was obtained from all participants for the study and follow-up of electronic health records at baseline. The Human Ethics Committee of the University of Western Australia approved the study protocol and consent form (approval number 05/06/004/H50). The Human Research Ethics Committee of the Western Australian Department of Health also approved the data linkage study (approval number #2009/24).
Study population
The participants were recruited to a 5-year prospective, randomized, controlled trial of oral calcium supplements to prevent osteoporotic fractures: the Calcium Intake Fracture Outcome study, which commenced in 1998.(8) Women were recruited from the Western Australian general population of women aged over 70 years by mail using the electoral roll, which is a requirement of citizenship. Of the 5586 women approached, 1500 women were recruited into the study. All participants were ambulant with an expected survival beyond 5 years and were not receiving any medication (including hormone replacement therapy) known to affect bone metabolism. Baseline disease burden and medications were comparable between these participants and the general population of similar age, although these participants were more likely to be from higher socioeconomic groups.(8) Participants were randomized to receive either 1.2 g of elemental calcium as calcium carbonate daily or a matching placebo while a substudy of the original 1500 (n = 39) received calcium plus 1000 IU of vitamin D2 daily.(9) The RCT was commenced and completed before the introduction of clinical trial registries, hence the trial was retrospectively registered in the Australian New Zealand Clinical Trials Registry ACTRN12615000750583. The study was then extended for another 10 years as the Perth Longitudinal Study of Aging in Women (PLSAW; http://www.lsaw.com.au).
Between 1998 and 1999, there were 1052 participants (70%) who had lateral spine images captured as part of the study protocol. The women without lateral spine images or missing Framingham risk factors (n = 448) were 0.9 years older than those with a lateral spine image available (p < 0.001) and were more likely to have a history of smoking (p = 0.035). However, there were no other significant differences between other recorded cardiovascular risk factors. These differences may have been due to chance, or as the majority of images were captured in year 1, older less healthy women may have been less likely to remain in the study and attend the year 1 clinic visit.
Biochemistry
Fasting blood samples were collected at baseline (1998). Total cholesterol, high-density lipoprotein cholesterol (HDLC), and triglyceride concentrations were determined in 841 of 1052 (80%) women using a Hitachi 917 autoanalyzer (Roche Diagnostics, Mannheim, Germany). Low-density lipoprotein cholesterol was calculated using Friedewald’s method.(10)
Baseline cardiovascular risk assessment
The participants provided their previous medical history, and current medications were verified by their primary care provider. These data were coded using the International Classification of Primary Care – Plus (ICPC-Plus) method.(11) The coding methodology allows aggregation of different terms for similar pathologic entities as defined by the International Classification of Diseases and Related Health Problems, 10th Revision (ICD-10) coding system. These data were then used to determine the presence of preexisting diabetes (T89001-90009). Cardiovascular medications included antihypertensive medications, statins, and low-dose aspirin. Smoking status was coded as nonsmoker or current smoker. Current smoking data was not available in three women who were assigned as nonsmokers when calculating FRSs. Forty-seven women with incomplete smoking history records were given the median pack years from the whole cohort of women with a history of smoking (10.5 years). Women were then assigned into four groups: no history of smoking, less than 20 pack years of smoking, greater than or equal to 20 pack years of smoking, and current smokers. Weight was assessed using digital scales with participants wearing light clothes and no shoes. Height was assessed using a stadiometer and the body mass index (BMI) was calculated in kg/m2 at baseline. Blood pressure was measured on the right arm with a mercury column manometer using an adult cuff after the participants had been seated in an upright position and had rested for 5 min. An average of three blood pressure readings was recorded. Mean arterial pressure was calculated using the following equation = [(2 × diastolic blood pressure) + systolic blood pressure]/3. Women with a history of myocardial infarction (International Classification of Diseases, Ninth Revision [ICD 9] codes 410), stroke (ICD 9 codes 430-434) or revascularization procedures identified via primary hospital discharge diagnosis and operation procedure codes from 1980 to 1998 were excluded.
AAC24 scores
Bone densitometry and lateral spine images were collected in a convenience sample subgroup of the original cohort in 1998 (baseline) prior to commencing the intervention phase of the randomized controlled trial, with the majority of participants lateral spine images (82%) captured in 1999 (year 1). All abdominal aortic calcification scores from 0 to 24 were derived from digitally enhanced lateral single-energy images of the thoracolumbar spine using a Hologic 4500A machine (Hologic, Marlborough, MA, USA). A single experienced investigator (JTS) read all images using an established technique(5,7,12) blinded to outcomes. More than 99.5% of the captured lateral spine images were of sufficient quality to assess AAC. Severity of AAC was categorized using previously published groupings(7): low (AAC24 score 0 or 1), moderate (AAC24 score 2–5), and high (AAC24 score ≥6).
Cardiovascular outcomes
Codes were identified using the International Classification of Diseases, Injuries and Causes of Death Clinical Modification (ICD-9-CM) and the International Statistical Classification of Diseases and Related Health Problems, 10th Revision, Australian Modification (ICD-10-AM)(13,14) The prespecified primary outcome of the study was atherosclerotic vascular disease (ASVD) hospitalization and/or death. These included; coronary heart disease (ICD-9-CM codes 410-414 and ICD-10-AM codes I20-I25); heart failure (ICD-9-CM code 428 and ICD-10-AM code I50); cerebrovascular disease excluding hemorrhage (ICD-9-CM codes 433-438 and ICD-10-AM codes I63-69, G45.9); and peripheral arterial disease (ICD-9-CM codes 440-444 and ICD-10-AM codes I70-74), as described.(15) Additional outcomes included: hard coronary heart disease (myocardial infarction hospitalization ICD-9-CM code 411 and ICD-10-AM code I21 or coronary heart disease death), cerebrovascular hospitalization and deaths (ICD-9-CM codes 433-438 and ICD-10-AM codes I63-69, G45.9), and all-cause mortality. All events were defined using the principal discharge diagnosis codes from hospitalizations or coded multiple causes of death data or parts 1 and 2 of the death certificate where coded cause of death data was not yet available.
Estimated cardiovascular risk
The 10-year estimated FRS values were calculated in two ways. First, using BMI data for 1052 participants; and second, using total cholesterol and HDLC for 841 participants. The first equation, the FRS included age, sex, previous diabetes, BMI, current smoking status, and treated (prescribed antihypertensives) or the untreated systolic blood pressure using the equation and estimated regression coefficients developed by D’Agostino and colleagues.(16 ) The second FRS included age, sex, total cholesterol, HDLC, smoking, diabetes, and prescription or antihypertensive medications. Although the two equations are considered to be approximately equivalent,(17) we retested the associations adjusted for the second FRS equation in the 80% of women with lipid measure. We chose this approach to confirm the findings of analyses adjusting for FRS using BMI and allow comparisons with other novel and established cardiovascular risk factors that are generally added to the cardiovascular risk factors models including lipid measures.
Statistical analysis
Baseline data are presented as either mean ± SD, median and interquartile range (IQR), or number (%) where appropriate. The association of AAC24 severity (high or moderate versus low) with incident ASVD events (hospitalization or death) was assessed in unadjusted and multivariable-adjusted Cox regression analyses.(7) For the primary Cox proportional hazards regression analyses, we treated deaths as censored. This approach means that the hazard ratios (HRs) can be interpreted as the risk of ASVD event for any time during follow-up assuming that a woman stays alive for that long. Additionally, given the advanced age of these women we also performed competing-risks analyses based on Fine and Gray’s proportional subhazards model(18) to account for the competing risk of non-ASVD mortality. Cox proportional hazards assumptions were tested with the Schoenfeld residuals. No violations of the Cox proportional hazards assumptions were detected. Two sets of secondary analyses were done: (i) estimating the association of AAC24 with ASVD hospitalization and/or ASVD mortality; (ii) estimating the associations of AAC24 with all of these ASVD outcomes in the subset considered to not be at high risk by FRS (risk of ASVD by FRS <20%). The primary Cox proportional hazards regression were adjusted for treatment code (calcium or placebo) and the FRS. Additional Cox proportional hazards regression analyses were adjusted for treatment code (randomized to calcium or placebo for the first 5 years) and the traditional cardiovascular risk factors including either: (i) age, BMI, systolic blood pressure, smoking history (never or previous/current), prescription of antihypertensive and presence of diabetes; or (ii) age, total cholesterol, HDLC, systolic blood pressure, smoking history (never or previous/current), prescription of antihypertensive and presence of diabetes. We tested for linear trends across AAC categories by using the median AAC24 value for each category (low = 0, moderate = 3, or high = 8) in separate Cox proportional hazards analyses. The prognostic utility of AAC24 measures was assessed using standard tests to measure discrimination, calibration, and net risk reclassification improvement. The discriminative performance were calculated using the Harrell’s C-statistic(19) with discrimination considered to be poor (<0.6), moderate (0.6-0.8), or good (≥0.8). Because of the low sensitivity of these analyses to evaluate AAC’s incremental contribution to the well-established ASVD prediction, net reclassification (NRI) and integrated discrimination improvement (IDI) indices were also performed(20) In order to do so, the first model included all the variables in the general Framingham risk model using BMI and treatment code (referent model), and the second model included all variables in the general Framingham cardiovascular risk model using BMI plus treatment code with the addition of AAC severity (low, moderate, or high). The calibration was tested by separating participants into deciles of predicted risk compared to the actual risk. For net reclassification improvement we used a category-free approach (no p value applied) because there are no suggested cut points for cardiovascular risk in the elderly. Values of p < 0.05 in two-tailed testing were considered statistically significant for primary outcomes while a p value <0.01 was considered statistically significant for secondary cardiovascular outcomes. All analyses were undertaken using IBM SPSS Statistics version 21 (IBM Corp., Armonk, NY, USA), STATA (version 13; StataCorp LP, College Station, TX, USA), or SAS (version 9.4; SAS Institute Inc., Cary, NC, USA).
Results
AAC24 scores were available in 1052 women (527 of these women were randomized to calcium supplements and 525 were randomized to placebo). An overview of the study recruitment is provided in Supporting Figure 1.
Fig. 1.
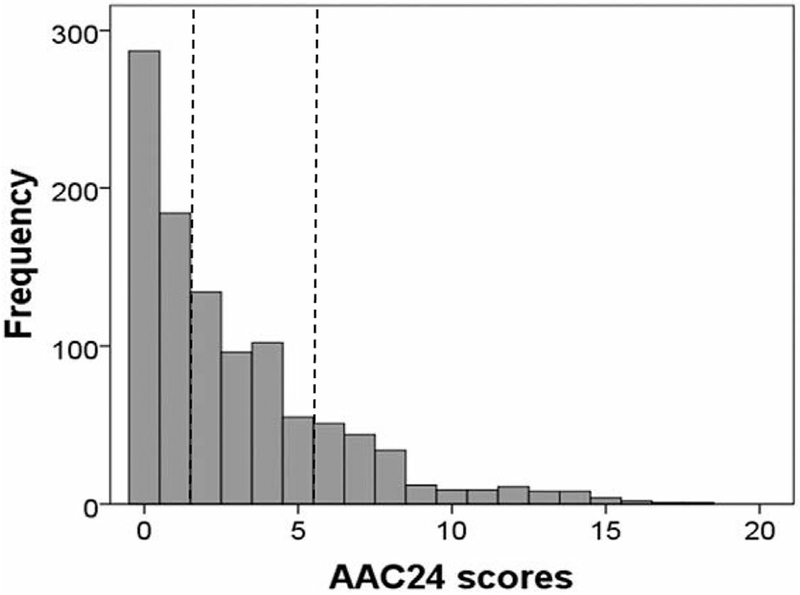
Distribution of AAC24 scores in elderly women (n = 1052). Checked lines indicate cut points between severity groupings.
Baseline characteristics
AAC24 scores were highly right-skewed (Fig. 1). AAC was categorized using previously published severity groupings into low (AAC24 score 0 or 1), moderate (AAC24 score 2–5), and high severity (AAC24 score ≥6); 471 women (44.8%) had low AAC severity, 387 (36.8%) had moderate AAC severity, and 194 (18.4%) had high severity. The median AAC24 score in this cohort was 2 (equivalent to 2/3 the length of one vertebral height) with an IQR of 0 to 4 (minimum score of 0 and maximum score of 18).
The relationships between AAC severity group, age, and cardiovascular risk factors are presented in Table 1. Compared to participants in the low AAC24 group those in the moderate and high AAC24 groups were older; had smoked more; had sustained more myocardial infarction hospitalization, stroke hospitalization, or coronary revascularization events; and were also receiving more statin, antihypertensive, and low-dose aspirin medications (all p < 0.05).
Table 1.
Baseline Characteristics of the Study Population Stratified by AAC Scores
| Characteristic | Whole cohort (n = 1052) | Low AAC (AAC24, 0 or 1) (n = 471) | Moderate AAC (AAC24, 2–5) (n = 387) | High AAC (AAC24, ≥6) (n = 194) |
|---|---|---|---|---|
| Age (years) | 74.9 ± 2.6 | 74.8 ± 2.6 | 74.9 ± 2.5 | 75.4 ± 2.7 |
| Body mass index (kg/m2)a | 27.2 ± 4.5 | 27.5 ± 4.7 | 27.3 ± 4.5 | 26.2 ± 3.6 |
| Smoking history, n (%)b | ||||
| Never | 683 (65.1) | 336 (71.6) | 234 (60.6) | 113 (58.2) |
| Previous <20 pack years | 252 (24.0) | 98 (20.9) | 104 (26.9) | 50 (19.9) |
| Previous ≥20 pack years | 111 (10.6) | 35 (7.5) | 48 (12.4) | 28 (14.4) |
| Current | 3 (0.3) | 0 (0) | 0 (0) | 3 (1.5) |
| Medication history, n (%) | ||||
| Low-dose aspirin medication | 212 (20.2) | 77 (16.3) | 82 (21.2) | 53 (27.3) |
| Antihypertensive medication | 449 (42.7) | 180 (38.2) | 177 (45.7) | 92 (47.4) |
| Statins medication | 200 (19.0) | 64 (13.6) | 73 (18.9) | 63 (32.5) |
| Blood pressure (mmHg) | ||||
| Systolic blood pressure | 138 ± 18 | 137 ± 18 | 138 ± 18 | 139 ± 19 |
| Diastolic blood pressure | 73 ± 11 | 74 ± 11 | 74 ± 11 | 72 ± 10 |
| Mean arterial pressure | 95 ± 12 | 95 ± 11 | 95 ± 12 | 94 ± 12 |
| Lipid profiles (mg/dL)c | ||||
| Total cholesterol | 226 ± 41 | 229 ± 40 | 224 ± 43 | 226 ± 37 |
| Low-density lipoprotein cholesterol | 142 ± 37 | 144 ± 36 | 141 ± 40 | 141 ± 34 |
| High-density lipoprotein cholesterol | 56 ± 15 | 57 ± 15 | 55 ± 14 | 56 ± 15 |
| Triglycerides | 138 ± 63 | 135 ± 58 | 138 ± 64 | 144 ± 69 |
| Medical history, n (%) | ||||
| Diabetes | 60 (5.7) | 25 (5.3) | 24 (6.2) | 11 (5.7) |
| MI, stroke, or revascularization | 56 (5.3) | 16 (3.4) | 24 (6.2) | 16 (8.2) |
Values are mean ± SD or n (%) as indicated. Values in bold p < 0.05 based on ANOVA or Mantel-Haenszel chi-square test of trend where appropriate.
AAC = abdominal aortic calcification; MI = myocardial infarction.
Measured in 1051 women.
Measured in 1049 women.
Measured in 841 women.
AAC categories and ASVD hospitalizations and deaths
Absolute ASVD risk is shown in (Table 2). Over 14.5 years 420 participants sustained an ASVD-related hospitalization or death. Of these, 335 women had an ASVD hospitalization and 206 had an ASVD-related death. Using prespecified cut points for low (AAC24 scores 0 and 1), moderate (AAC24 scores 2–5) and high AAC (AAC24 scores ≥6), women with severe AAC had increased rates of ASVD events, whereas women with moderate and severe AAC had increased rates of ASVD-related deaths and all cause mortality (Table 2). Cox proportional hazards regression analyses and trend tests are shown in Table 2. Using the median values for the three AAC categories there was a significant linear trend for increased risk for ASVD events, ASVD death, all-cause mortality, and cerebrovascular ASVD events in both unadjusted and FRS and treatment-adjusted analyses.
Table 2.
Cox Proportional Hazards Regression for ASVD Events by Severity of AAC
| n (%) | Event rate per 1000 person years (95% CI) | Unadjusted HR (95% CI) | FRS-adjusted HR (95% CI)a | |
|---|---|---|---|---|
| ASVD hospitalization and/or death (n = 420) | ||||
| Low AAC (AAC24 score 0 or 1) | 174 (36.9) | 32.28 (27.84–37.44) | 1 (reference) | 1 (reference) |
| Moderate AAC (AAC24 score 2–5) | 151 (39.0) | 34.80 (29.64–40.80) | 1.09 (0.88–1.35) | 1.05 (0.84–1.30) |
| High AAC (AAC24 score ≥6) | 95 (49.0) | 47.28 (40.80–57.84) | 1.51 (1.18–1.94) | 1.37 (1.07–1.77) |
| p for trend | 0.001 | 0.016 | ||
| ASVD deaths (n = 206) | ||||
| Low AAC (AAC24 score 0 or 1) | 72 (15.3) | 11.69 (9.28–14.73) | 1 (reference) | 1 (reference) |
| Moderate AAC (AAC24 score 2–5) | 82 (21.2) | 16.63 (13.39–20.64) | 1.47 (1.07–2.01) | 1.41 (1.03–1.94) |
| High AAC (AAC24 score ≥6) | 52 (26.8) | 21.54 (16.41–28.27) | 1.93 (1.35–2.76) | 1.80 (1.26–2.57) |
| p for trend | <0.001 | <0.001 | ||
| All-cause mortality (n = 377) | ||||
| Low AAC (AAC24 score 0 or 1) | 143 (30.4) | 23.22 (19.71–27.36) | 1 (reference) | 1 (reference) |
| Moderate AAC (AAC24 score 2–5) | 148 (38.2) | 30.01 (25.54–35.25) | 1.33 (1.06–1.67) | 1.30 (1.03–1.64) |
| High AAC (AAC24 score ≥6) | 86 (44.3) | 35.63 (28.84–44.01) | 1.51 (1.22–2.09) | 1.53 (1.17–2.00) |
| p for trend | <0.001 | 0.002 | ||
| Coronary heart disease hospitalization and/or death (n = 231) | ||||
| Low AAC (AAC24 score 0 or 1) | 93 (19.7) | 16.32 (13.31–19.99) | 1 (reference) | 1 (reference) |
| Moderate AAC (AAC24 score 2–5) | 92 (23.8) | 20.20 (16.47–24.79) | 1.25 (0.94–1.66) | 1.21 (0.91–1.62) |
| High AAC (AAC24 score ≥6) | 46 (23.7) | 20.87 (15.63–27.86) | 1.29 (0.91–1.84) | 1.17 (0.82–1.67) |
| p for trend | 0.129 | 0.353 | ||
| Myocardial infarction and/or coronary heart disease death (n = 154) | ||||
| Low AAC (AAC24 score 0 or 1) | 58 (12.3) | 9.67 (7.48–12.51) | 1 (reference) | 1 (reference) |
| Moderate AAC (AAC24 score 2–5) | 62 (16.0) | 12.80 (9.98–16.42) | 1.36 (0.95–1.94) | 1.29 (0.90–1.85) |
| High AAC (AAC24 score ≥6) | 34 (17.5) | 14.34 (10.24–20.06) | 1.53 (1.00–2.34) | 1.38 (0.90–2.11) |
| p for trend | 0.041 | 0.127 | ||
| Cerebrovascular disease hospitalization and/or death (n = 63) | ||||
| Low AAC (AAC24 score 0 or 1) | 63 (13.4) | 10.60 (8.28–13.56) | 1 (reference) | 1 (reference) |
| Moderate AAC (AAC24 score 2–5) | 65 (16.8) | 13.63 (10.69–17.38) | 1.31 (0.92–1.85) | 1.25 (0.89–1.77) |
| High AAC (AAC24 score ≥6) | 47 (24.2) | 20.81 (15.63–27.70) | 2.03 (1.39–2.97) | 1.90 (1.29–2.76) |
| p for trend | <0.001 | 0.001 | ||
ASVD = atherosclerotic vascular disease; AAC = abdominal aortic calcification; HR = hazard ratio; FRS = Framingham risk score.
Cox proportional hazards regression analyses were adjusted for general FRS plus treatment code (calcium or placebo). Trend test performed using the median values for each AAC severity category.
Values in bold p < 0.05 compared to women with no to low AAC.
Compared to those with low AAC, those with high AAC, but not individuals with moderate AAC, had an increased relative hazard for ASVD hospitalizations or death events (HR 1.51; 95% CI, 1.18 to 1.94; p < 0.001) that remained significant after adjustment for FRS values and treatment. For ASVD death, in unadjusted analysis compared to those with low AAC, both individuals with moderate AAC and high AAC had increased relative hazards (HR 1.47; 95% CI, 1.07 to 2.01; p = 0.018; and HR 1.93; 95% CI, 1.35 to 2.76; p < 0.001; respectively) that remained significant after adjustment for the FRS values (Table 2). Analyses in the subset of 841 women with lipid measures available identified similar results for both outcomes (Supporting Table 1).
AAC categories and relative hazards of other outcomes
The association between AAC severity and specific cardiovascular outcomes and all-cause mortality is presented in Table 2. Compared to those with low AAC, the high AAC group had increased relative hazards for cerebrovascular events and all-cause mortality in both unadjusted and FRS and treatment-adjusted analyses.
AAC categories and ASVD risk prediction
Changes in risk prediction are shown in Table 3 including Harrell’s C, the NRI, and the IDI. Good calibration was observed in all models, as shown by the nonsignificant Hosmer-Lemeshow test (all p > 0.2). All models for ASVD events and deaths demonstrated moderate discrimination (Harrell’s C-statistic of 0.6 to 0.8), the addition of AAC categories to traditional risk factors included in the Framingham risk calculation did not improve discrimination for ASVD (Harrell’s C-statistic for ASVD events +0.004 and ASVD deaths +0.010).
Table 3.
Analyses of the Harrell’s C, Net Reclassification Improvement Indices, and Integrated Discrimination Indices
| Harrell’s C | p | Category-free net reclassification (95% CI) | Net events correctly reclassified higher | Net non-events correctly reclassified lower | Integrated discrimination index (95% CI) | |
|---|---|---|---|---|---|---|
| ASVD events (n = 420) | ||||||
| Framingham risk factors | 0.629 | |||||
| Framingham risk factors + AAC severity groups | 0.632 | 0.224 | 0.086 (−0.037 to 0.209) | 14.3% | −5.7% | 0.003 (−0.001 to 0.006) |
| ASVD deaths (n = 206) | ||||||
| Framingham risk factors | 0.665 | |||||
| Framingham risk factors + AAC severity groups | 0.675 | 0.179 | 0.211 (0.060 to 0.365) | 23.9% | −2.6% | 0.009 0.002 to 0.015) |
ASVD = atherosclerotic vascular disease; AAC = abdominal aortic calcification; CVD = cardiovascular disease.
Compared to Framingham risk factors and treatment code.
p < 0.05 compared to model with Framingham general CVD risk factors.
The NRI for analysis for addition of AAC severity to base case general Framingham risk factors led to 14.3% and 23.9% of women correctly being reclassified at higher risk of ASVD events and ASVD-related deaths, respectively, but only identified a minimal reduction in the correct reclassification of women not experiencing ASVD events or death. Overall the addition of AAC identified an improvement in classification of 0.211 (95% CI, 0.060 to 0.356), p = 0.007 for ASVD-related death but not events 0.086 (95% CI, −0.037 to 0.209). Similarly, the addition of AAC severity scores to the model with the Framingham risk factors improved the discrimination slope (IDI) for ASVD-related deaths (0.9%; 95% CI, 0.2 to 1.5%), p = 0.008, but not ASVD events. These analyses were also undertaken in the subset of 841 women with lipids available and similar results were observed (Supporting Table 2).
Further analyses
Although not an a priori analysis, to consider a potentially easier method of assessing a lateral spine image as a secondary analysis we categorized women into no AAC (n = 287) and any AAC (n = 765) and assessed the association with cardiovascular events and all-cause mortality (Table 4). This simple classification identified a substantial increase in risk of all outcomes in those with any AAC, although lower than that identified in those with greatest AAC score severity. To confirm the robustness of the main finding we also undertook multivariable-adjusted Cox proportional hazards regression analyses using all of the cardiovascular risk factors used in the FRS and treatment code rather than the FRS alone, which did not substantially alter the results (Supporting Table 3). Additionally, because only a small proportion of the women were current smokers we reanalyzed the main multivariable-adjusted Cox proportional hazards regression for all outcomes replacing current smoking with smoking history (yes/no) and the results were somewhat attenuated for ASVD events but remained similar for other outcomes (Supporting Table 3). To assess the potential for reverse causality bias we (i) excluded those with a history of prior history of stroke, myocardial infarction, or revascularization and (ii) excluded women with events that occurred within the first 24 months which did not substantially change the overall results for either analysis (data not shown). Additionally, post hoc interaction testing identified a significant interaction between AAC and systolic blood pressure for ASVD events (p = 0.003). The effect of stratifying women by systolic blood pressure ≥140 mmHg is shown in Supporting Tables 4 and 5. For the 503 participants with systolic blood pressure ≥140 mmHg there was no association between severity of AAC and ASVD hospitalizations or deaths (all p > 0.05 and data not shown), whereas in the 549 women with a systolic blood pressure <140 mmHg there was a stronger association between severity of AAC and ASVD outcomes. No other interactions between AAC and conventional Framingham cardiovascular risk factors was observed. To assess the potential for competing risks bias we then performed the primary analyses using competing risks analysis with death from any non-ASVD causes as the competing risk. This did not substantially change the overall results (Supporting Table 6). Finally, given vitamin K antagonists are known to exacerbate vascular calcification, we undertook a further analysis adjusting for vitamin K antagonist use (n = 30) at baseline and the results were similar (data not shown).
Table 4.
Cox Proportional Hazards Regression for ASVD Events by the Presence of any AAC
| n (%) | Event rate (95% CI) | Unadjusted HR(95% CI) | FRS-adjusted HR (95% CI)a | |
|---|---|---|---|---|
| ASVD hospitalization and/or death (n = 420) | ||||
| No AAC (AAC24 score 0) | 96 (33.4) | 28.90 (23.66–35.30) | 1 (reference) | 1 (reference) |
| Any AAC (AAC24 score 1–24) | 324 (42.4) | 38.50 (34.53–42.93) | 1.36 (1.08–1.70) | 1.31 (1.05–1.65) |
| ASVD deaths (n = 206) | ||||
| No AAC (AAC24 score 0) | 40 (13.9) | 10.66 (7.82–14.53) | 1 (reference) | 1 (reference) |
| Any AAC (AAC24 score 1–24) | 166 (21.7) | 17.02 (14.62–19.82) | 1.65 (1.17–2.33) | 1.57 (1.11–2.23) |
| All-cause mortality (n = 377) | ||||
| No AAC (AAC24 score 0) | 85 (29.6) | 22.65 (18.31–28.02) | 1 (reference) | 1 (reference) |
| Any AAC (AAC24 score 1–24) | 292 (38.2) | 29.94 (26.70–33.58) | 1.36 (1.07–1.73) | 1.32 (1.04–1.69) |
| Coronary heart disease hospitalization and/or death (n = 231) | ||||
| No AAC (AAC24 score 0) | 50 (17.4) | 14.29 (10.83–18.86) | 1 (reference) | 1 (reference) |
| Any AAC (AAC24 score 1–24) | 181 (23.7) | 20.20 (17.46–23.37) | 1.43 (1.04–1.95) | 1.38 (1.01–1.89) |
| Myocardial infarction and/or coronary heart disease death (n = 154) | ||||
| No AAC (AAC24 score 0) | 30 (10.5) | 8.15 (5.70–11.65) | 1 (reference) | 1 (reference) |
| Any AAC (AAC24 score 1–24) | 124 (16.2) | 9.53 (10.91–15.51) | 1.64 (1.10–2.44) | 1.57 (1.05–2.34) |
| Cerebrovascular disease hospitalization and/or death (n = 63) | ||||
| No AAC (AAC24 score 0) | 33 (11.5) | 9.01 (6.40–12.67) | 1 (reference) | 1 (reference) |
| Any AAC (AAC24 score 1–24) | 142 (18.6) | 15.25 (12.94–17.98) | 1.73 (1.19–2.53) | 1.67 (1.15–2.45) |
Values in bold are p < 0.05 compared to women with no AAC.
ASVD = atherosclerotic vascular disease; AAC = abdominal aortic calcification; HR = hazard ratio; FRS = Framingham risk score.
Cox proportional hazards regression analyses were adjusted for general FRS plus treatment code (calcium or placebo).
Discussion
There are a number of important findings from this study. First, we showed that the majority of older women undertaking bone density testing had evidence of AAC, while advanced or severe AAC is seen in almost one in five of these women. Second, this is the first prospective cohort study using the AAC24 point scoring assessed on densitometric lateral spine images that describes the long-term prognosis in older women with more advanced AAC. Furthermore, we externally validated the cut points identified from an earlier case-control study(7) for 15-year ASVD hospitalizations and deaths. Additionally, this is the first study to have evaluated whether the addition of AAC severity from densitometric lateral spine imaging to established CVD risk factors improved newer measures of risk reclassification such as the net reclassification improvement. Finally, for the first time we showed that assessing AAC24 scores on densitometric lateral spine images at the time of bone density testing identifies women at a higher risk of 15-year all-cause mortality.
A recent study by Setiawati and colleagues(21) of 323 women (mean age 65 years) found computed tomography (CT) was the most sensitive test with 60% having AAC, while only 58% had detectable AAC on images from X-ray and 55% on images from a bone densitometer. In our study the prevalence of AAC in older women (mean age 75 years) was 73%, which is similar to two other studies of older women using densitometric lateral spine images (mean age 65 years and 71 years), with prevalences of 55% and 67%, respectively.(21,22) Similarly, in studies of older women with AAC assessed using CT or X-ray (mean cohort ages 65 to 78 years) the reported prevalence of AAC was 58% to 89%(4,21,23–25) However, two studies using bone densitometers in older women(26,27) with mean cohort ages of 68 and 74 years had substantially lower prevalence (7% and 50%). It is unclear why the prevalence was so much lower in these two studies but may be due to regional differences in cardiovascular risk factors or comorbidity burdens, differences in image capture or assessment methodology, or experience of the investigators reading the images.
We have previously shown that the presence and extent of these calcified lesions identified on images captured by bone densitometers are markers of subclinical CVD that are associated with other measures of generalized atherosclerosis in the carotid(28) and coronary arteries.(29) Because these older women are already undergoing routine bone densitometry, the addition of lateral spine images during bone density testing to assess AAC may help to inform future treatment decisions to prevent cardiovascular events in large numbers of older women. However, future studies investigating whether primary prevention strategies guided by the presence or severity of AAC can reduce future cardiovascular events in a cost effective manner are urgently needed.
In this study women with high AAC had significantly increased risk of long-term ASVD hospitalizations and deaths, whereas women with moderate AAC had increased risks of ASVD deaths and all-cause mortality. These findings were observed before and after adjusting for Framingham risk factors or scores based on either BMI or lipid measures, and taking into account competing risks demonstrating the robustness of the observed associations. In contrast, a 5-year prospective study of elderly New Zealand women found the presence of AAC using lateral spine images from a bone densitometer by a different manufacturer predicted myocardial infarction (MI), stroke, and cardiovascular events in unadjusted analyses but after adjusting for cardiovascular risk only the HR for MI of 2.05 (95% CI, 1.09 to 3.86) remained significant.(27)These differences may be due to the low prevalence of AAC in the New Zealand study, differences in identification and definitions of cardiovascular disease events, and reduced power due to the shorter duration of follow-up. Given the women in this study received standard clinical management for CVD and events were independent of self report, our finding are likely to reflect the true prognosis in women undertaking bone density testing.
Despite being robustly associated with ASVD hospitalizations and deaths, improvements in the discrimination for the prediction of ASVD hospitalizations and death was not significant using the Harrell’s C-statistic test. Because this test has been criticized as lacking sensitivity,(29,30) we also assessed the newer net reclassification improvement index, which suggested that there was some enhancement in the ability to identify elderly women who would suffer ASVD death with the addition of AAC severity, with minimal change in reclassification of elderly women to lower risk.
To our knowledge this is the first prospective study of AAC assessed using bone densitometers and a priori cut points that has shown women with more advanced AAC have increased long-term risk of all-cause mortality. These findings confirm two similar studies using standard radiographs. Rodondi and colleagues(25) reported that in women with a mean age 72.1 years those with any AAC had an increased risk of 16-year all cause mortality compared to women without AAC that remained significant after adjusting for cardiovascular risk factors, HR 1.37 (95% CI, 1.15 to 1.64), p < 0.001. In a second study of older men and women with a mean age of 60.7 years, and up to 35 years follow-up with increasing AAC severity, the reported HRs increased from 1.6 to 2.1.(30) Therefore, studies of elderly women consistently demonstrate that women with more advanced AAC have substantially poorer long-term prognosis irrespective of the methodology used to capture the lateral spine images.
We observed a significant interaction between AAC and systolic blood pressure with the strongest independent associations between measures of AAC and cardiovascular outcomes being observed in women with a systolic blood pressure below 140 mmHg. The most likely explanation is that in women with elevated blood pressure the higher blood pressure is in part due to advanced nature of the AAC via the Windkessel function,(31) whereby medial calcifications are thought to promote widespread arterial rigidity and hypertension,(31) which is implicated in resistant hypertension.(32) Given both systolic blood pressure and AAC may be in the same causal pathway, it is unsurprising the association was not observed in those with elevated blood pressure. However, given this was identified by post hoc interaction tests and thus hypothesis generating, these findings need to be investigated in future studies.
There are a number of important limitations of this study. First, because this was an observational study, causation cannot be established. Second, it is likely survivor and/or selection bias was present because the women recruited for this study were over 70 years old, were not receiving any medication known to affect bone metabolism, and were likely to survive for a further 5 years. Although disease burden and medications were comparable to the general population of a similar age, the sample was biased toward higher socioeconomic groups. Despite these differences the relationship between AAC and cardiovascular outcomes is likely to be the same or stronger in lower socioeconomic groups because of greater variation in AAC and less intensive CVD management. Similarly, because there were differences in the age and history of smoking between those with and without lateral spine images (70% and 30% of the cohort, respectively) selection bias may have been introduced. Third, because AAC was only measured once in 1998 to 1999, it is possible that recent changes in AAC may have a stronger association with ASVD events than baseline AAC values. As such, further studies are needed to assess if the trajectory of AAC over time predicts ASVD events and deaths better than a single measure. Fourth, the images used in this study were historical images and substantial improvements have since been made in image acquisition and quality from scanning densitometers that may allow detection of small calcifications which may have been missed in this study.
Additionally, the AAC24 point scale scoring system is a semiquantitative scoring system and is operator-dependent; however, for this study a highly experienced investigator (JTS1, with very good previously reported interoperator agreement (intraclass correlation coefficients of 0.89; 95% CI, 0.80 to 0.941, read all the images.(12) Despite being a semiquantitative scoring system, previous studies have demonstrated moderate to good correlations between AAC24 scores and quantitative assessment of AAC by CT in healthy women (Spearman’s rho = 0.58, p < 0.0011 and dialysis patients (r = 0.58, p < 0.0011.(33,34) A further limitation is that we did not compare the predictive utility of AAC with modern markers of cardiovascular risk such as natriuretic peptides and high-sensitivity cardiac troponin assays. Finally, because this cohort consisted of elderly white women with an average age of 75 years, these findings may not be generalizable to younger women or other ethnicities or populations; particularly men, given the gender differences observed in cardiovascular risk.
Despite these limitations, the strengths of this study include the nature of this cohort of elderly women that is representative of women typically undergoing bone densitometry for osteoporosis screening, the long-term follow-up of all participants, and adjustment for general FRS values. Also, to our knowledge this is also the first study to perform competing risks analyses, which are important to accurately determine disease risk in older individuals.(35) Additionally, we had complete and accurate data collection for cardiovascular hospitalizations and deaths from the Western Australian Data Linkage System over a 14.5-year period in the whole cohort. Finally, a single highly experienced investigator (JTS1 blinded to the outcomes assessed all lateral spine images in this study.
In conclusion, we found that AAC identified using low-cost, very low radiation scanning densitometry was associated with increased risk of atherosclerotic disease events and reduced long-term survival in elderly white women. These associations were particularly evident in women with severe AAC. These findings suggest that when severe AAC is observed on images in older women undergoing VFA this should be reported to the treating physician.
Supplementary Material
Acknowledgments
The study was supported by Kidney Health Australia grant S07 10, Healthway Health Promotion Foundation of Western Australia, Sir Charles Gairdner Hospital Research Advisory Committee Grant and by project grants 254627, 303169, and 572604 from the National Health and Medical Research Council of Australia. Hologic Inc. provided the software for JTS for image review. The salary of JRL is supported by a National Health and Medical Research Council of Australia Career Development Fellowship (ID: 1107474). DPK’s time was supported by a grant from the National Institute of Arthritis, Musculoskeletal and Skin Diseases (R01 AR 41398). None of the funding agencies had any role in the conduct of the study; collection, management, analysis, or interpretation of the data; or preparation, review, or approval of the manuscript. KEW is an employee of Hologic Inc. All time spent on this work was part of his employment. We thank the staff at the Data Linkage Branch, Hospital Morbidity Data Collection and Registry of Births, Deaths and Marriages for their work on providing data for this study.
Authors’ roles: All authors conceived and designed the study. JRL, JTS, WHL, GW, KZ and RLP collected the data. JRL, JTS, WHL, GW and RLP prepared the manuscript; all authors reviewed the manuscript; JRL and RLP had the primary responsibility for the final content. All authors read and approved the final manuscript.
Footnotes
Additional Supporting Information may be found in the online version of this article.
Disclosures
KEW is an employee of Hologic Inc. and reports personal fees, nonfinancial support, and other from Hologic, Inc., during the conduct of the study; personal fees and other from Hologic, Inc., outside the submitted work. In addition, KEW has multiple densitometer imaging and reporting patents which may be relevant, US and worldwide, both pending and issued, owned by Hologic, Inc.
References
- 1.Blake GM, Naeem M, Boutros M. Comparison of effective dose to children and adults from dual X-ray absorptiometry examinations. Bone. 2006;38(6):935–42. [DOI] [PubMed] [Google Scholar]
- 2.Schousboe JT, Ensrud KE, Nyman JA, Kane RL, Melton LJ 3rd. Cost-effectiveness of vertebral fracture assessment to detect prevalent vertebral deformity and select postmenopausal women with a femoral neck T-score>−2.5 for alendronate therapy: a modeling study. J Clin Densitom. 2006;9(2):133–43. [DOI] [PubMed] [Google Scholar]
- 3.Szulc P Abdominal aortic calcification: a reappraisal of epidemiological and pathophysiological data. Bone. 2016;84:25–37. [DOI] [PubMed] [Google Scholar]
- 4.Kauppila LI, Polak JF, Cupples LA, Hannan MT, Kiel DP, Wilson PWF. New indices to classify location, severity and progression of calcific lesions in the abdominal aorta: a 25-year follow-up study. Atherosclerosis. 1997;132(2):245–50. [DOI] [PubMed] [Google Scholar]
- 5.Schousboe JT, Wilson KE, Hangartner TN. Detection of aortic calcification during vertebral fracture assessment (VFA) compared to digital radiography. PLoS One. 2007;2(8):e715. [DOI] [PMC free article] [PubMed] [Google Scholar]
- 6.Schousboe JT, Debold CR. Reliability and accuracy of vertebral fracture assessment with densitometry compared to radiography in clinical practice. Osteoporos Int. 2006;17(2):281–9. [DOI] [PubMed] [Google Scholar]
- 7.Schousboe JT, Taylor BC, Kiel DP, Ensrud KE, Wilson KE, McCloskey EV. Abdominal aortic calcification detected on lateral spine images from a bone densitometer predicts incident myocardial infarction or stroke in older women. J Bone Miner Res. 2008;23(3):409–16. [DOI] [PubMed] [Google Scholar]
- 8.Prince RL, Devine A, Dhaliwal SS, Dick IM. Effects of calcium supplementation on clinical fracture and bone structure: results of a 5-year, double-blind, placebo-controlled trial in elderly women. Arch Intern Med. 2006;166(8):869–75. [DOI] [PubMed] [Google Scholar]
- 9.Zhu K, Devine A, Dick IM, Wilson SG, Prince RL. Effects of calcium and vitamin D supplementation on hip bone mineral density and calcium-related analytes in elderly ambulatory Australian women: a five-year randomized controlled trial. J Clin Endocrinol Metab. 2008;93(3):743–9. [DOI] [PubMed] [Google Scholar]
- 10.Friedewald WT, Levy RI, Fredrickson DS. Estimation of the concentration of low-density lipoprotein cholesterol in plasma, without use of the preparative ultracentrifuge. Clin Chem. 1972; 18(6):499–502. [PubMed] [Google Scholar]
- 11.Britt H, Scahill S, Miller G. ICPC PLUS for community health? A feasibility study. Health Inf Manag. 1997;27(4):171–5. [DOI] [PubMed] [Google Scholar]
- 12.Schousboe JT, Wilson KE, Kiel DP. Detection of abdominal aortic calcification with lateral spine imaging using DXA. J Clin Densitom. 2006;9(3):302–8. [DOI] [PubMed] [Google Scholar]
- 13.World Health Organization; Manual of the International Statistical Classification of Diseases, In juries, and Causes of Death: based on the recommendations of the ninth revision conference, 1975, and adopted by the Twenty-ninth World Health Assembly, 1975 revision. ed. 2 volumes. Geneva: World Health Organization; 1977. [cited 2018 Feb 23]. Available from: http://apps.who.int/iris/handle/10665/40492. [Google Scholar]
- 14.World Health Organization; ICD-10: International Statistical Classification of Diseases and Related Health Problems. 10th revision, 2nd ed. 3 volumes Geneva: World Health Organization; 2004. Available from: http://apps.who.int/iris/handle/10665/42980. [Google Scholar]
- 15.Lewis JR, Lim W, Dhaliwal SS, et al. Estimated glomerular filtration rate as an independent predictor of atherosclerotic vascular disease in older women. BMC Nephrol. 2012;13(1):58. [DOI] [PMC free article] [PubMed] [Google Scholar]
- 16.D’Agostino RB Sr, Vasan RS, Pencina MJ, et al. General cardiovascular risk profile for use in primary care: the Framingham Heart Study. Circulation. 2008;117(6):743–53. [DOI] [PubMed] [Google Scholar]
- 17.Gaziano TA, Young CR, Fitzmaurice G, Atwood S, Gaziano JM. Laboratory-based versus non-laboratory-based method for assessment of cardiovascular disease risk: the NHANES I Follow-up Study cohort. Lancet. 2008;371(9616):923–31. [DOI] [PMC free article] [PubMed] [Google Scholar]
- 18.Fine JP, Gray RJ. A proportional hazards model for the subdistribution of a competing risk. J Am Stat Assoc. 1999;94:496–509. [Google Scholar]
- 19.Pencina MJ, D’Agostino RB Sr, Song L. Quantifying discrimination of Framingham risk functions with different survival C statistics. Stat Med. 2012;31(15):1543–53. [DOI] [PMC free article] [PubMed] [Google Scholar]
- 20.Pencina MJ, D’Agostino RB Sr, D’Agostino RB Jr, Vasan RS. Evaluating the added predictive ability of a new marker: from area under the ROC curve to reclassification and beyond. Stat Med. 2008;27-(2):157–72; discussion 207–12. [DOI] [PubMed] [Google Scholar]
- 21.Setiawati R, Di Chio F, Rahardjo P, Nasuto M, Dimpudus FJ, Guglielmi G. Quantitative assessment of abdominal aortic calcifications using lateral lumbar radiograph, dual-energy X-ray absorptiometry, and quantitative computed tomography of the spine. J Clin Densitom. 2016;19(2):242–9. [DOI] [PubMed] [Google Scholar]
- 22.Schousboe JT, Beran MS. Abdominal aortic calcification on lateral spine bone density test images: potential role in cardiovascular disease risk screening. J Patient Cent Res Rev. 2016;3(3):183. [Google Scholar]
- 23.Chuang ML, Massaro JM, Levitzky YS, et al. Prevalence and distribution of abdominal aortic calcium by gender and age group in a community-based cohort (from the Framingham Heart Study). Am J Cardiol. 2012;110(6):891–6. [DOI] [PMC free article] [PubMed] [Google Scholar]
- 24.Wong ND, Lopez VA, Allison M, et al. Abdominal aortic calcium and multi-site atherosclerosis: the Multiethnic Study of Atherosclerosis. Atherosclerosis. 2011;214(2):436–41. [DOI] [PMC free article] [PubMed] [Google Scholar]
- 25.Rodondi N, Taylor BC, Bauer DC, et al. Association between aortic calcification and total and cardiovascular mortality in older women. J Intern Med. 2007;261(3):238–44. [DOI] [PubMed] [Google Scholar]
- 26.Golestani R, Tio R, Zeebregts CJ, et al. Abdominal aortic calcification detected by dual X-ray absorptiometry: a strong predictor for cardiovascular events. Ann Med. 2010;42(7):539–45. [DOI] [PubMed] [Google Scholar]
- 27.Bolland MJ, Wang TK, van Pelt NC, et al. Abdominal aortic calcification on vertebral morphometry images predicts incident myocardial infarction. J Bone Miner Res. 2010;25(3):505–12. [DOI] [PubMed] [Google Scholar]
- 28.Lewis JR, Schousboe JT, Lim WH, et al. Abdominal aortic calcification identified on lateral spine images from bone densitometers are a marker of generalized atherosclerosis in elderly women. Arterioscler Thromb Vasc Biol. 2016;36(1):166–73. [DOI] [PMC free article] [PubMed] [Google Scholar]
- 29.Schousboe JT, Claflin D, Barrett-Connor E. Association of coronary aortic calcium with abdominal aortic calcium detected on lateral dual energy X-ray absorptiometry spine images. Am J Cardiol. 2009;104(3):299–304. [DOI] [PMC free article] [PubMed] [Google Scholar]
- 30.Samelson EJ, Cupples LA, Broe KE, Hannan MT, O’Donnell CJ, Kiel DP. Vascular calcification in middle age and long-term risk of hip fracture: the Framingham Study. J Bone Miner Res. 2007;22(9) :1449–54. [DOI] [PMC free article] [PubMed] [Google Scholar]
- 31.Rattazzi M, Bertacco E, Puato M, Faggin E, Pauletto P. Hypertension and vascular calcification: a vicious cycle? J Hypertens. 2012;30(10): 1885–93. [DOI] [PubMed] [Google Scholar]
- 32.Williams B The aorta and resistant hypertension. J Am Coll Cardiol. 2009;53(5):452–4. [DOI] [PubMed] [Google Scholar]
- 33.Toussaint ND, Lau KK, Strauss BJ, Polkinghorne KR, Kerr PG. Determination and validation of aortic calcification measurement from lateral bone densitometry in dialysis patients. Clin J Am Soc Nephrol. 2009;4(1):119–27. [DOI] [PMC free article] [PubMed] [Google Scholar]
- 34.Cecelja M, Frost ML, Spector TD, Chowienczyk P. Abdominal aortic calcification detection using dual-energy X-ray absorptiometry: validation study in healthy women compared to computed tomography. Calcif Tissue Int. 2013;92(6):495–500. [DOI] [PubMed] [Google Scholar]
- 35.Berry SD, Ngo L, Samelson EJ, Kiel DP. Competing risk of death: an important consideration in studies of older adults. J Am Geriatr Soc. 2010;58(4):783–7. [DOI] [PMC free article] [PubMed] [Google Scholar]
Associated Data
This section collects any data citations, data availability statements, or supplementary materials included in this article.