

Supplemental Digital Content is available in the text
Keywords: agricultural workers, chronic kidney disease, global health, prevention
Abstract
Objective:
Identify early biomarkers and mechanisms of acute kidney injury in workers at risk of developing chronic kidney disease of unknown origin (CKDu).
Methods:
We assessed cross-shift changes in kidney function and biomarkers of injury in 105 healthy sugarcane workers. We obtained pre-harvest clinical data as well as daily environmental, clinical, and productivity data for each worker.
Results:
The average percent decline in cross-shift estimated glomerular filtration rate (eGFR) was 21.8% (standard deviation [SD] 13.6%). Increasing wet bulb globe temperature (WBGT), high uric acid, decreased urine pH, urinary leukocyte esterase, and serum hyperosmolality were risk factors for decline in kidney function.
Conclusions:
Sugarcane workers with normal kidney function experience recurrent subclinical kidney injury, associated with elevations in biomarkers of injury that suggest exposure to high temperatures and extreme physical demands.
Chronic kidney disease of unknown origin (CKDu) is an emerging global pandemic with known hot-spots in agricultural communities of Central America,1–4 India,5,6 Sri Lanka,7 Egypt,8 and the United States.9,10 In Central America it has become a leading cause of death and hospitalization, particularly among young, male sugarcane workers, but has also been shown to affect women and children in agricultural communities.11–14 Between 1990 and 2009, the mortality from CKD increased 7-fold in El Salvador and 3-fold in Nicaragua.8 The age-adjusted mortality rates from end stage renal disease (ESRD) in these countries are among the highest in the world.15 The Pan American Health Organization (PAHO) estimates that more than 60,000 renal failure deaths (41% in those younger than 60) occurred in Central America between 1997 and 2013.15,16 According to projections from the Global Health Observatory, CKD is currently one of the fastest growing causes of global mortality worldwide, and impacts are anticipated to increase over the next decade.17
Currently, CKDu is often diagnosed at a very late stage due to a lack of overt early clinical signs and symptoms and a dearth of systematic surveillance.16 Recent evidence suggests that some workers at risk for CKDu are experiencing episodes of clinically apparent acute interstitial nephritis with renal biopsies demonstrating tubulointerstitial inflammatory infiltrates with varying degrees of underlying fibrosis.11,18 This histological pattern may suggest recurrent injury in individuals with a normal estimated glomerular filtration rate (eGFR). Acute kidney injury is a known risk factor for eventual CKD,19–21 however, this progression has not been fully explored in the context of the natural history of CKDu. Similarly, little is known about early asymptomatic changes. A better understanding of early pathophysiologic changes in workers at risk for CKDu will help shed light on the underlying pathogenesis and natural history of CKDu and offers opportunities for early stage prevention. Additionally, such knowledge will equip occupational and environmental medicine (OEM) providers, on the forefront of emerging health issues related to worker populations, with information needed to recognize, respond to, and help mitigate these health threats to workers worldwide.
Chronic exposure to high ambient temperatures, extreme physical exertion, and recurrent dehydration have previously been implicated as contributing factors to the development of CKDu.12,22–24 While three cohort studies have examined cross-shift changes in renal physiology among workers in endemic regions, data are still limited on the nephrotoxic impact and mechanism of injury that may result from performing intense physical labor in hot setting.2,25,26 Exposure to agrochemicals and heavy metals, silicates, intake of fructose-rich soft drinks, use of non-steroidal anti-inflammatory drug (NSAIDs), tobacco use, and nutritional factors are other suspected causes under broad investigation.27–30 These potential risk factors are not mutually exclusive and may operate in concert, simultaneously or sequentially over periods of time, resulting in acute and chronic manifestations of disease.31,32 Likely, some factors may exert a stronger impact in certain populations and individuals more than others.
To improve understanding of the earliest signs of renal dysfunction in this occupational setting, we examined endogenous biomarkers of physiologic stress and injury in a healthy cohort of Guatemalan sugarcane workers who, by nature of their occupation, are at risk for CKDu. In distinction from prior studies, our workers were also hydrating themselves with a median of 15 L of water daily, thereby allowing us to look at changes in subjects who were well hydrated. The aims of the current study were to (1) assess changes in renal function across a work shift in a cohort of workers with normal eGFR, (2) assess associations between cross-shift changes in kidney function, biomarkers of injury and demographic, environmental, and clinical characteristics, (3) test several hypothetical physiological pathways of injury depicted in Fig. 1, including: heat stress, dehydration and hypovolemia, muscle breakdown, and tissue hypoperfusion, and (4) to examine whether inflammation is a potential intermediate end-point that is associated with kidney injury. A better understanding of early biomarkers of injury serves to inform interventions aimed at prevention, detection, and diagnosis of subclinical disease. Additionally, an understanding of acute early changes in renal function contributes to a growing understanding of the multifactorial root causes of CKDu.
FIGURE 1.
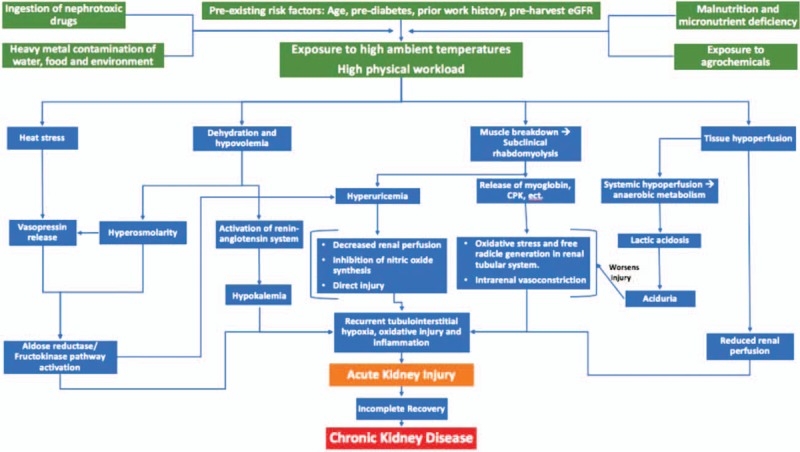
Mechanisms by which recurrent exposure to high ambient temperature and high physical workloads, in synergy with other exposures and risk factors, may lead to CKDu. CKDu, chronic kidney disease of unknown origin.
MATERIALS AND METHODS
Setting and Study Design
This study was conducted across the 2016 to 2017 sugarcane harvest in a population of 105 field workers employed by Pantaleon, a sugarcane agribusiness in Guatemala. The sugarcane harvest season runs from November until May each year. A detailed description of the field setting has been described by Butler-Dawson et al.33
In this longitudinal study, we prospectively assessed cross-shift changes in eGFR, biomarkers of renal function, and biomarkers of heat stress in 105 workers at three separate time points during the harvest season. Additionally, we collected clinical, environmental, occupational, and non-occupational data for each worker. Prior to each harvest, field workers undergo a fitness-for-work medical screening and health risk assessment survey. The screening evaluation includes clinical data (age, height, weight, blood pressure, heart rate), demographic information (location of home of residence, occupational history, lifestyle behaviors), and evaluation of eGFR via serum creatinine.
Workers were recruited for employment from local communities in the coastal area near the sugarcane fields (approximate altitude 350 m) as well as from highland communities of Guatemala (approximate altitude 1800 m). Workers were hired if they passed the fitness-for-work screening and had an eGFR greater than 60 mL/min/1.73 m2. Once hired, workers were assigned to work cohorts of approximately 50 workers each that remained constant for the duration of the season. The University of Colorado Center for Health, Work & Environment (CHWE) and Pantaleon executed a memorandum of understanding in 2016, with the shared goal of assessing and improving the health, safety, and well-being of the workers. Data from the pre-harvest medical screenings were provided to the research team at the CHWE. Ethics review and approval for this study was granted by the Colorado Multiple Institutional Review Board (COMIRB) and in Guatemala by the Comite de Etica, Facultad de Medicina, Universidad Francisco Marroquin-Hospital Universitario Esperanza.
Study Participants
All participants were over the age of 18 and had passed the pre-employment medical screening. In January 2017, a stratified random sampling method was used to construct a list of 10 work groups. Details are described in Butler-Dawson et al.31 In brief, we stratified work groups by job type (production vs cane cutting) and by home residence, local, coastal region residents versus highland region residents (among cane cutting groups only). Eight cane cutting work groups (four local and four highland work groups) were selected out of a total of 46 work groups. Two production groups were selected from 28 work groups that had between 40 and 70 workers. Production workers perform tasks such as planting seeds and field maintenance. Approximately 10 workers from each selected group were randomly chosen for invitation into the study. Of 105 workers who were invited to participate, all 105 were enrolled and participated in at least one of three data collection time points (100%). All study subjects completed and signed a written informed consent if they agreed to participate.
Productivity and Work Environment
During the harvest season (November to April), cane cutters are typically in the field for 10 hours (cutting cane for 8 hours) in 6-day blocks before taking a rest day. Productivity data for each study participant (tons of cane harvested per day) on the day of study, as well as the prior day, was provided to University of Colorado researchers.
Since 2009, Pantaleon has provided water, rest, and shade (WRS) interventions aligned with US Occupational Safety and Health Administration (OSHA) recommendations.34 Cane cutters are instructed to drink 16 L of water including 2.5 L of electrolyte solution (composition per liter: 4.6 g NaCl, 34 g carbohydrates [26 g sucrose], and 2 g KCl) and take three 20-minute work breaks and one 60-minute shaded lunch break during the work shift. Cane cutters are provided with 5 L water jugs and unlimited access to water during the work shift, distributed from centrally located mobile water tanks in the cane field. During the months of February and March, production workers were not included in the WRS intervention. WRS interventions for all production workers began in April. Self-reported data on water and electrolyte solution intake were collected from each worker after each study day.
Data Collection and Analysis
During study days, evaluations were performed at mobile stations alongside the fields. Urine samples were collected immediately before and after each work shift. Blood was obtained post-shift (venipuncture) and creatinine was measured pre- and post-shift with a handheld point of care (POC) device. Workers were asked to perform their work tasks as they would do on a typical day. Trained bilingual research personnel from the University of Colorado used a structured interviewer-administered survey to evaluate work and health behaviors. Detailed laboratory methods are included as a supplement (Supplemental Digital Content 1).
Assessment of Kidney Function
Pre- and post-shift blood was collected by finger prick and read instantly in the field using the Nova® Statscan (Stat Sensor Creatinine Meter, Nova Biomedical Corporation, Waltham, MA). In a prior study, we demonstrated that this POC test consistently overestimates creatinine by an average of 22% (95% confidence interval [CI]: 19.8%, 24.7%).35 Therefore, an adjustment factor of 0.7775 was applied to all POC creatinine values. eGFR per 1.73 m2 of body surface area was calculated using the Chronic Kidney Disease Epidemiology Collaboration formula based on serum creatinine.36 The primary outcome for this analysis is cross-shift percent change in eGFR, calculated by comparing pre-shift to post-shift values during the day of study.
Assessment of Biomarkers
Pre- and post-shift urine samples were collected in sterile cups in the field. On each sample, urine dipstick analysis was performed and specific gravity was measured using a digital refractometer. Samples were subsequently analyzed for creatinine, sodium, potassium, albumin, magnesium, and neutrophil gelatinase-associated lipocalin (NGAL). Urine dipstick results, including pH, leukocyte esterase, and protein, were subsequently analyzed as categorical variables, given the nature of the test.
Post-shift blood samples were collected from each participant by a trained phlebotomist and subsequently analyzed for blood urea nitrogen (BUN), creatinine, uric acid, sodium, potassium, lactic acid, and creatine kinase. Hemoglobin A1c was measured only at the February time point. For biomarkers below the limit of detection, we substituted the limit of detection/√2. To account for urine concentration, we corrected for urinary sodium, magnesium, potassium, and albumin relative to urinary creatinine. Serum osmolality was calculated based on serum electrolytes values.37 Normal values for all tests were determined based upon reference laboratory guidelines. See supplement (Supplemental Digital Content 1) for further laboratory methods and collection details.
Environmental Measures
During each study day, wet bulb globe temperature (WBGT), dry bulb globe temperature (DBGT), and relative humidity were recorded during the work shift using a 3M QUESTemp34 Thermal Environmental Monitor placed 1 m above the ground in direct sun, in the field where the study participants worked. We computed the average and maximum WBGT for each study day. On the last day of the study, the monitor only recorded data for 40 minutes of the work shift so WBGT on this day was not include in the analyses.
Education and Wellness Incentive
During the informed consent process and at each round of data collection, study subjects received enhanced education that was in addition to the health education modules regularly conducted by company field nurses and doctors. This included a brief presentation and a brochure, based on OSHA's WRS program.38 During the study period, workers were incentivized with raffle tickets to maintain adequate hydration (determined by urine specific gravity and change in body weight).33
Statistical Analyses
Baseline characteristics were compared between cane cutters and production workers using chi-square or Fisher Exact tests for categorical characteristics; t tests with Satterthwaite corrections for unequal variances were used for continuous variables. Cross-shift percent change in eGFR, was the outcome measure for the univariate and multivariable analyses with all workers combined.
We evaluated the association between potential risk factors and percent change in eGFR across the work shift using linear mixed-effects univariate and multivariable models with random intercepts for individuals. We constructed three multivariable models based on the biomarkers of interest. In model 1, we assessed the associations between pre-shift urinary biomarkers and cross-shift change. In this model, all pre-shift factors that had a P-value of <0.1 in the univariate models were included in the final model 1. In model 2, we assessed associations between post-shift biomarkers from the different hypothesized pathways of injury (Fig. 1) and cross-shift change. In this model, we included biomarkers from each of the hypothesized pathways of injury. This model includes average WBGT, serum osmolality, hyperuricemia (serum uric acid more than 7 vs less than or equal to 7), creatine kinase (less than 174, 174 to 870, more than 870), and dipstick pH level (7.0 to 7.5, 6.0 to 6.5, and 5.0). In model 3, we assessed the association between post-shift renal inflammation (dipstick positive leukocyte esterase more than or equal to 70+ leu/μL vs negative/±15) and cross-shift change to assess the hypothesis that recurrent inflammation leads to greater decline in kidney function (percent change in eGFR cross-shift). In all of the multivariable models we controlled for a priori risk factors for decline in kidney function including: age, pre-shift eGFR, hypertension, and HbA1c.2,12,16,18 The distribution of cross-shift percent change in eGFR was verified for normality. All analyses were done using SAS version 9.4 (Cary, NC).
RESULTS
Participation
Eighty-three cane cutters were invited to participate and all consented. Work attendance varied, thus, 81 workers participated in February, 69 in March, and 71 in April. Sixty-three (76%) cane cutters participated at all three time points. Twelve (15%) participated at two time points and eight (10%) at only one time point. All 22 production workers who were invited to participate consented to the study. Twenty-one participated in February, 22 in March, and 22 in April. Two (9%) production workers participated at only two time points, and 20 (91%) participated at all three time points.
Pre-Harvest Characteristics
Baseline demographic and clinical characteristics of the 105 workers are shown in Table 1. The mean pre-harvest creatinine for the cohort was 0.90 (SD = 0.15), eGFR = 111.12 (SD = 15.6). In total, 12% of workers started the season with an eGFR less than 90, none below 60. No worker had a HbA1c in the diabetic range (more than 6.5), however, 50% of workers had a HbA1c in the pre-diabetic range (5.7 to 6.4). Evidence of stage 1 hypertension (BP = 140 to 159/90 to 99) was found in 4% of participants. None demonstrated stage 2 hypertension. Differences in pre-harvest clinical variables were not significantly different between the cane cutters and production workers except body mass index.
TABLE 1.
Pre-Harvest Demographic and Clinical Characteristics of the Study Population
| Baseline Characteristics | All Participants N = 105 | Cane Cutters N = 83 | Production Workers N = 22 | P-Value |
| Demographic, mean (SD) | ||||
| Age, yrs | 30.1 (9.1) | 29.05 (8.1) | 34.0 (11.3) | <0.05 |
| Home residence, n (%) | ||||
| Local | 63 (60%) | 41 (49%) | 22 (100%) | <0.01 |
| Highland | 42 (40%) | 42 (51%) | 0 (0%) | |
| Number of seasons worked | 7.1 (5.2) | 7.2 (5.0) | 6.7 (6.1) | 0.21 |
| Clinical, mean (SD) | ||||
| Body mass index | 23.6 (2.8) | 23.2 (2.5) | 25.2 (3.1) | <0.01 |
| Pre-harvest serum creatinine, mg/dL | 0.9 (0.2) | 0.9 (0.2) | 0.9 (0.1) | 0.5 |
| Pre-harvest eGFR, mL/min/1.73 m2 | 111.1 (15.6) | 111.5 (15.8) | 109.7 (14.9) | 0.6 |
| Pre-harvest eGFR <90, n (%) | 13 (12.4%) | 10 (12.1%) | 3 (13.6%) | 1.0 |
| Pre-harvest eGFR >90, n (%) | 92 (87.6%) | 73 (87.9%) | 19 (86.4%) | |
| HbA1c* | 5.66 (0.29) | 5.65 (0.28) | 5.68 (0.32) | 0.75 |
| HbA1c (>6.5) n, %* | 0 (0.00%) | 0 (0.00%) | 0 (0.00%) | – |
| HbA1c (5.7–6.4), n (%)* | 53 (50%) | 40 (48%) | 13 (59%) | 0.36 |
| Hypertension** | 4 (4%) | 2 (3%) | 2 (9%) | 0.22 |
Median or mean (SD) are shown for continuous variables, number (n), and percent (%) for demographics and medical conditions.
*HbA1c was measured post-shift in February.
**Stage 1 hypertension as defined as a systolic blood pressure from 130-139 or a diastolic blood pressure from 80-89.
Hydration
As displayed in Table 2, mean self-reported water intake was approximately 13 L daily (median = 15) and mean electrolyte solution intake was approximately five 500-mL bags (2.5 L total fluid) for each worker.
TABLE 2.
Self-Reported Water and Electrolyte Intake
| Water Intake, L | Electrolyte Solution Intake (500 mL bag)* | |||||
| N | Mean (SD) | Median (Range) | N | Mean (SD) | Median (Range) | |
| February | 103 | 13.8 (6.3) | 15 (34.0) | 100 | 5.0 (3.0) | 5.0 (12.0) |
| March | 88 | 13.7 (4.7) | 15 (18.0) | 88 | 5.0 (3.4) | 5.0 (17.0) |
| April | 92 | 12.7 (4.4) | 15 (18.0) | 91 | 5.4 (3.1) | 5.0 (18.0) |
*Each 500 mL bag of electrolyte solution contains 4 g sodium citrate, 4.6 g sodium chloride, 2 g potassium chloride, 34 g carbohydrates, and 26 g sucrose.
Overall, workers appeared well-hydrated during this study period. Averaged across the monthly time points, 46% of workers had maximally dilute urine (urine specific gravity less than 1.005) pre-shift, which increased to 67% post-shift. Approximately, 47% started the day with normal urine specific gravity and the proportion decreased to 25% post-shift. Approximately 6% started the day dehydrated (more than 1.02) which increased to 9% post-shift (Fig. 2A, B)
FIGURE 2.
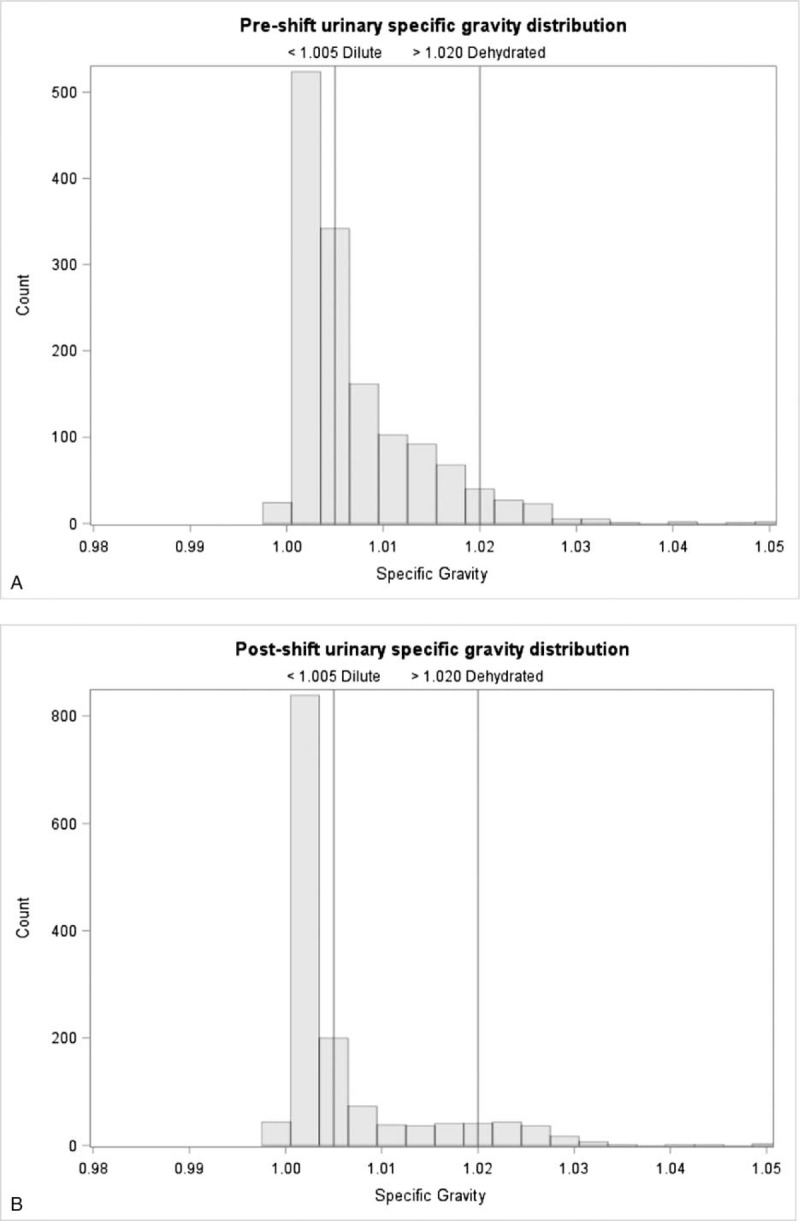
A: Pre-shift urine specific gravity among study participants, averaged across February, March, and April, 2017. B: Post-shift urine specific gravity among study participants, averaged across February, March, and April, 2017.
Cross-Shift Changes in Kidney Function
Kidney function significantly declined from pre- to post-shift at all time points, P-value <0.01 (Fig. 3). Overall, the average percent decline in cross-shift eGFR was 21.8% (SD 13.6%), with 27% to 45% of workers declining by greater than 25% at each monthly time point.
FIGURE 3.
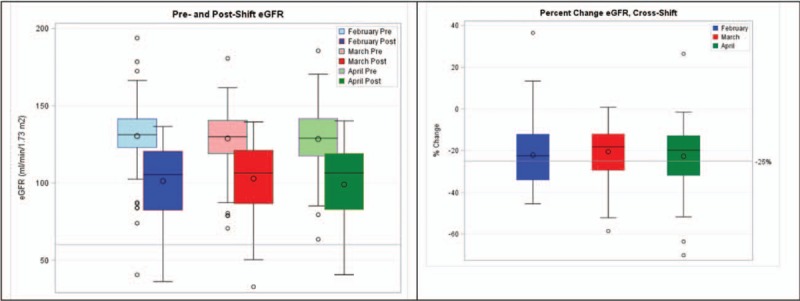
Comparison between pre- and post-shift eGFR during 3 study months (left) and cross-shift percent change in eGFR (right). eGFR, estimated glomerular filtration rate.
Heat Exposure and Productivity
The average WBGT temperature was 31.5 °C in February, 30.6 °C in March, and 31.5 °C in April. The average maximum WBGT temperatures were 34.7 °C in February, 34.2 °C in March, and 34.3 °C in April. In February, the average number of tons of cane cut on each study day was 6.2 (SD = 2.3), March 6.6 (SD = 2.5), and April 5.7 (SD = 2.0) (Table 3).
TABLE 3.
Heat Exposure, Productivity, Behaviors, and Pre- and Post-Shift Urinary Biomarkers for February, March, and April
| February, Mean (SD) or N (%) | March, Mean (SD) or N (%) | April, Mean (SD) or N (%) | |
| Heat exposure | |||
| Average WBGT | 31.57 (1.21) | 30.67 (1.09) | 31.5 (0.7) |
| Maximum WBGT | 34.94 (1.57) | 34.25 (1.33) | 34.2 (0.7) |
| Productivity | |||
| Cane harvested on study day (tons/worker) | 6.19 (2.25) | 6.59 (2.52) | 5.7 (2.0) |
| Can harvested on previous day (tons/worker) | 6.31 (2.43) | 6.37 (3.46) | 5.9 (1.7) |
| Self-reported behaviors | |||
| Smoked cigarette on study day | 5 (5%) | 5 (6%) | 7 (8%) |
| NSAID use on study day | 12 (12%) | 3 (4%) | 2 (2%) |
| Urine Biomarkers | Normal Values | Pre-Shift | Post-Shift | P-Value | Pre-Shift | Post-Shift | P-Value | Pre-Shift | Post-Shift | P-Value |
| Specific gravity | 1.01–1.03 | 1.008 (0.01) | 1.006 (0.01) | <0.01 | 1.009 (0.01) | 1.006 (0.01) | <0.01 | 1.007 (0.005) | 1.005 (0.006) | <0.01 |
| NGAL, ng/mL | * | 27.1 (51.8) | 11.2 (12.6) | <0.01 | 13.8 (17.8) | 7.1 (13.1) | <0.01 | 10.6 (11.9) | 9.4 (13.4) | <0.01 |
| Leukocyte esterase (≥70+ Leu/μL) | 0 | 15 (15%) | 4 (4%) | 0.01 | 11 (12%) | 8 (9%) | <0.01 | 6 (7%) | 12 (13%) | <0.01 |
| Albumin/creatinine, mg/g | <30 | 22.3 (68.1) | 18.0 (24.1) | 0.71 | 14.0 (28.9) | 20.7 (26.4) | <0.01 | 9.1 (13.3) | 29.4 (61.4) | 0.71 |
| pH = 7.0–7.5 | 5.0–8.0 | 13 (13%) | 14 (14%) | <0.01 | 16 (18%) | 16 (18%) | <0.01 | 10 (11%) | 13 (14%) | <0.01 |
| pH = 6.0–6.5 | 5.0–8.0 | 50 (50%) | 50 (50%) | 34 (37%) | 42 (47%) | 48 (52%) | 47 (51%) | |||
| pH = 5.0–5.5 | 5.0–8.0 | 32 (32%) | 37 (37%) | 16 (18%) | 16 (18%) | 34 (37%) | 32 (35%) | |||
| Uric acid/creatinine, mg/mg | * | 0.79 (0.8) | 0.49 (0.39) | <0.01 | 0.58 (0.46) | 0.37 (0.15) | <.001 | 0.52 (0.15) | 0.4 (0.15) | <0.01 |
| Urine uric acid, mg/dL | * | 15.7 (12.3) | 10.9 (11.8) | <0.01 | 17.3 (10.0) | 11.3 (11.7) | <.001 | 24.4 (19.3) | 13.0 (15.0) | <0.01 |
| Sodium/creatinine, mmol/g | * | 236.7 (242.2) | 156.5 (216.5) | <0.01 | 121.9 (101.3) | 111.4 (95.3) | 0.1 | 125.1 (197.7) | 105.5 (163.4) | 0.17 |
| Magnesium/creatinine, mg/mg | * | 0.14 (0.14) | 0.11 (0.06) | <0.001 | 0.14 (0.11) | 0.11 (0.06) | 0.03 | 0.20 (0.1) | 0.10 (0.1) | <0.001 |
| Proteinuria (≥30 mg/dL) | 0 | 0 (0%) | 2 (2%) | – | 1 (1%) | 1 (1%) | – | 0 (0%) | 1 (1%) | – |
Bold values are statistically significant.
*Normal values not established.
Cross-Shift Changes in Urine Biomarkers
Table 3 displays the average pre-shift and post-shift urine and serum biomarkers for all workers at each time point. Urine specific gravity deceased significantly across the work shift. Average NGAL levels ranged from 10 to 27 ng/mL pre-shift to 7 to 11 ng/mL post-shift and significantly decreased across the work shift. Urinary leukocyte esterase was a common finding both pre- and post-shift. Average albumin to creatinine ratio (ACR) ranged from 9 to 22 μg/mg pre-shift to 18 to 30 μg/mg post-shift and only increased significantly across the work shift in March. Aciduria (defined as a dipstick pH of 5.0) was a common finding both pre- and post-shift. Urinary sodium and magnesium decreased significantly across the work shift.
Post-Shift Serum Biomarkers
Creatine kinase as well as lactic acid levels were elevated at all time points (Table 4). Average uric acid levels were on the high end of normal (6.2 to 6.4), with 18% to 24% of workers demonstrating hyperuricemia (more than 7.0 mg/dL). Average glucose levels were normal. BUN ranged from 12 to 15 mg/dL. Hypo-osmolality was common, with 31% to 51% of workers demonstrating a serum osmolality less than 280 mmol/kg. Very few workers demonstrated hyperosmolality (osmolality more than 295 mmol/kg). Average serum potassium was low, ranging from 3.4 to 3.5 mmol/L (normal = 3.5 to 5.0). Average serum sodium was on the low end of normal, ranging from 134 to 136 (normal = 135 to 145).
TABLE 4.
Post-Shift Biomarkers of Injury From February, March, and April, 2017
| February | March | April | ||
| Post-Shift Serum Biomarkers | Normal Values | Mean (SD) or N (%) | Mean (SD) or N (%) | Mean (SD) or N (%) |
| Creatine kinase | 174 (IU/L) | 436.7 (241.3) | 339.9 (239.6) | 425.0 (370.0) |
| Lactate | 0.5–1 (mmol/L) | 3.8 (1.4) | 3.34 (1.03) | 3.9 (0.9) |
| Uric acid | 3.4–7.0 (mg/dL) | 6.2 (2.4) | 6.16 (2.19) | 6.4 (1.3) |
| Uric acid >7.0 | 18 (18%) | 18 (23%) | 24 (28%) | |
| Glucose | 70–100 (mg/dL) | 81.8 (13.7) | 85.4 (13.5) | 88.4 (15.6) |
| Blood urea nitrogen (BUN) | 7–20 (mg/dL) | 14.8 (5.7) | 12.9 (4.3) | 13.4 (5.2) |
| Osmolality <280 | 280–295 (mmol/kg) | 51 (51%) | 34 (43%) | 31 (36%) |
| Osmolality >295 | 280–295 (mmol/kg) | 1 (1%) | 1 (1%) | 2 (2%) |
| Potassium | 3.5–5.0 (mmol/L) | 3.5 (0.46) | 3.4 (0.40) | 3.5 (0.40) |
| Sodium | 135–145 (mmol/L) | 134.39 (3.77) | 135.35 (3.29) | 136.00 (3.50) |
| ΔIntracellular volume | (L)* | 0.95 (0.66) | 0.78 (0.57) | 0.66 (0.58) |
| ΔExtracellular volume | (L)* | −1.00 (1.79) | −0.68 (1.40) | −0.24 (2.33) |
*Normal values not established.
Factors Associated With Cross-Shift Decline in eGFR
Baseline Demographics and Clinical Characteristics
As shown in Table 5, we observed that for each year increase in age, the cross-shift eGFR declined an average of 0.3% (P < 0.01). Similarly, cross-shift eGFR declined with each number of sugarcane harvests worked (P < 0.01). Those with a higher pre-season baseline eGFR suffered less cross-shift decline in eGFR (P < 0.0001). Although none of the study participants met the laboratory definition of diabetes (based on HbA1c at the start of the study), for each 1% increase in HbA1c, there was an average 7.8% decline in cross-shift eGFR (P < 0.01). The presence of hypertension was not significantly associated with decline. Pre-shift eGFR was not associated with cross-shift declines. Home residence and body mass index were not significantly associated with cross-shift declines.
TABLE 5.
Univariate Analysis Testing Associations Between Risk Factors and Percent Change in eGFR Across the Work Shift
| Effect | Estimate | Standard Error | DF | t Value | P-Value |
| Demographics and baseline health | |||||
| Age | −0.3 | 0.1 | 103.0 | −2.5 | <0.01 |
| Harvests worked (n = 96) | −0.5 | 0.2 | 94.0 | −2.6 | <0.01 |
| Highland | −1.4 | 2.0 | 81.0 | −0.7 | 0.51 |
| Body mass index, kg/m | −0.3 | 0.4 | 95.0 | −0.9 | 0.40 |
| HgA1c | −7.8 | 3.4 | 103.0 | −2.3 | 0.02 |
| Hypertension (stage 1) | −0.2 | 5.5 | 95.0 | 0.0 | 0.96 |
| Pre-harvest eGFR | 0.2 | 0.1 | 102.0 | 3.7 | <0.01 |
| Pre-Shift eGFR | 0.0 | 0.0 | 175.0 | 0.6 | 0.54 |
| NSAID use | 1.2 | 3.0 | 100 | 0.4 | 0.69 |
| Smoking | −2.7 | 3.5 | 158 | −0.8 | 0.44 |
| Heat exposure* | |||||
| Average WBGT | −0.6 | 0.7 | 165 | −0.8 | 0.44 |
| Maximum WBGT | −0.2 | 0.6 | 165 | −0.4 | 0.73 |
| Physical work load | |||||
| Cane harvested | 0.0 | 0.4 | 132.0 | −0.1 | 0.90 |
| Cane harvested (prior day) | −0.5 | 0.4 | 62.0 | −1.2 | 0.22 |
| Pre-shift urine biomarkers | |||||
| Specific gravity | −2.6 | 1.2 | 174.0 | −2.3 | <0.01 |
| NGAL | −0.2 | 0.1 | 173.0 | −2.9 | <0.01 |
| Leukocyte esterase, ≥70+/μL | −2.9 | 2.7 | 84.0 | −1.1 | 0.29 |
| Albumin–creatinine ratio | 0.0 | 0.0 | 168.0 | 0.5 | 0.60 |
| pH = 6.0–6.5 (ref: 7.0–7.5) | −3.3 | 1.7 | 78 | −2.0 | 0.05 |
| pH = 5.0 (ref: 7.0–7.5) | −3.2 | 2.5 | 78 | −1.3 | 0.20 |
| Uric acid | −0.1 | 0.1 | 168.0 | −2.4 | 0.02 |
| Sodium/creatinine | 0.0 | 0.0 | 168.0 | 2.2 | 0.02 |
| Magnesium/creatinine | 26.5 | 6.1 | 168.0 | 4.4 | <0.01 |
| Proteinuria >1+ | 4.7 | 12.8 | 173.0 | 0.4 | 0.71 |
| Post-shift urine biomarkers | |||||
| Specific gravity | −3.3 | 1.2 | 175.0 | −2.7 | <0.01 |
| NGAL | −0.2 | 0.1 | 171.0 | −2.8 | <0.01 |
| Leukocyte esterase, ≥70+/μL | −7.8 | 2.9 | 94.0 | −2.7 | <0.01 |
| Albumin–creatinine ratio | 0.0 | 0.0 | 161.0 | −0.9 | 0.36 |
| pH = 6.0–6.5 (ref: 7.0–7.5) | −1.8 | 1.7 | 68 | −1.0 | 0.30 |
| pH = 5.0 (ref: 7.0–7.5) | −9.9 | 2.1 | 68 | −4.0 | <0.01 |
| Uric acid | −0.1 | 0.1 | 162.0 | −1.8 | 0.08 |
| Sodium/creatinine | 0.0 | 0.0 | 161.0 | 1.8 | 0.07 |
| Magnesium/creatinine | 23.6 | 14.7 | 162 | 1.6 | 0.11 |
| Proteinuria >1+ | 2.7 | 6.8 | 174 | 0.4 | 0.70 |
| Post-shift serum biomarkers | |||||
| Creatine kinase, continuous | 0.0 | 0.0 | 157.0 | 1.2 | 0.25 |
| Creatine kinase, 174–870 (ref: ≤174) | 4. | 2.6 | 25 | 1.6 | 0.23 |
| Creatine kinase, ≥870 (ref: ≤174) | 5.5 | 4.3 | 25 | 1.3 | 0.21 |
| Lactate | 0.0 | 0.7 | 158.0 | −0.1 | 0.95 |
| Uric acid | −1.0 | 0.4 | 157.0 | −2.5 | <0.01 |
| Hyperuricemia (>7.0) | −9.3 | 2.0 | 157.0 | −4.6 | <0.01 |
| Glucose | 0.0 | 0.1 | 100.0 | −0.3 | 0.76 |
| Blood urea nitrogen | −0.9 | 0.2 | 157.0 | −5.7 | <0.01 |
| Serum osmolality (cont.) | −0.3 | 0.1 | 157.0 | −2.6 | 0.01 |
| Serum osmolality <280 | 3.9 | 1.7 | 40.0 | 2.3 | 0.03 |
| Serum osmolality >295 | −9.1 | 6.5 | 40.0 | −1.4 | 0.17 |
| Potassium | 2.0 | 2.1 | 157.0 | 1.0 | 0.34 |
| Sodium | −0.3 | 0.2 | 158.0 | −1.1 | 0.28 |
| ΔIntracellular volume | 1.9 | 1.4 | 158.0 | 1.3 | 0.18 |
Bold values are statistically significant.
eGFR, estimated glomerular filtration rate; NGAL, neutrophil gelatinase-associated lipocalin; NSAID, non-steroidal anti-inflammatory drug.
*Last study day removed from analysis because WBGT meter only ran for 40 minutes during the work shift.
Heat Exposure and Productivity
In the univariate model, neither average or maximum WBGT was significantly associated with cross-shift declines in eGFR. The quantity of cane harvested, either on the day of study or the day prior, was also not significantly associated with cross-shift changes in eGFR.
Urine Biomarkers
Increasing pre- and post-shift specific gravity were significantly associated with a cross-shift decline in eGFR (P < 0.01). Post-shift aciduria (pH 5.0) was significantly associated with cross-shift decline. For each unit increase in pre- and post-shift NGAL, cross-shift eGFR declined on average 0.2% (P < 0.01). Higher urine uric acid levels, both pre- and post-shift, were associated with decline (P < 0.1). Post-shift urine leukocyte esterase, more than or equal to 70+ Leu/μL or greater, were associated with an 8% decline in eGFR (P < 0.01). Albumin/creatinine ratios and proteinuria (>1+) were not significantly associated.
Post-Shift Serum Biomarkers
Uric acid was significantly associated with cross-shift decline in eGFR, and those with hyperuricemia (more than 7.0 mg/dL) experienced an average 9% decline in cross-shift eGFR. BUN was significantly associated with cross-shift decline in eGFR, with every 1 mg/dL increase associated with an approximately 1% decline. Increasing serum osmolality was associated with a 0.3% decline. Serum hypo-osmolality was associated with a 4% increase in eGFR whereas hyperosmolality was not significant although very few workers had hyperosmolality. Creatine kinase, lactate, potassium, and sodium were not significantly associated with cross-shift decline in eGFR.
Multivariable Analysis of Factors Associated With Cross-Shift Decline in eGFR
Pre-shift biomarkers associated with percent change in eGFR across the work shift are presented in Table 6. Increasing HbA1c and age were significantly associated with cross-shift decline in eGFR in the pre-shift biomarkers model. Increasing urinary magnesium/creatinine was found to be protective and was associated with improvement in kidney function across the work shift.
TABLE 6.
Multivariable Analysis of Pre-Shift Biomarkers Associated With Percent Change in Cross-Shift eGFR
| Effect | Estimate | P-Value |
| Intercept | 12.60 | 0.93 |
| Age (per 1-yr increase) | −0.26 | 0.04 |
| HgA1c (per 1% increase) | −7.35 | 0.04 |
| Pre-shift eGFR (per 1 ml/min/1.73 m2 increase) | −0.04 | 0.51 |
| Hypertension (ref: no) | 1.06 | 0.84 |
| Pre-shift specific gravity (per 0.1 increase) | 0.17 | 0.90 |
| Pre-shift NGAL | −0.15 | 0.09 |
| Pre-shift pH = 6.0–6.5 (ref: 7.0–7.5) | −2.64 | 0.13 |
| Pre-shift pH = 5.0 (ref: 7.0–7.5) | −0.90 | 0.73 |
| Pre-shift urinary uric acid/creatinine | 2.55 | 0.18 |
| Pre-shift urinary magnesium/creatinine | 17.67 | 0.03 |
| Pre-shift urinary sodium/creatinine | −0.001 | 0.81 |
Bold values are statistically significant.
Next, we created a multivariable model which assessed the contribution of different pathways of injury to decline in cross-shift kidney function (Table 7). In the model, the biomarkers of physiologic pathways of injury included: average WBGT (heat stress), hyperosmolality (dehydration and hypovolemia), hyperuricemia, creatine kinase, and aciduria (muscle breakdown, subclinical rhabdomyolysis, and tissue hypoperfusion). We observed that increasing average WBGT was significantly associated with cross-shift decline in eGFR while controlling for other pathways of injury. Additionally, increasing age, increasing pre-shift eGFR, hyperuricemia, and aciduria were associated with a greater decline in eGFR. Notably, hyperuricemia was the strongest contributor to eGFR decline.
TABLE 7.
Multivariable Analysis of Post-Shift Biomarkers Associated With Percent Change in Cross-Shift eGFR
| Effect | Estimate | P-Value |
| Intercept | 150.25 | <0.01 |
| Age (per 1-yr increase) | −0.4177 | <0.01 |
| HgA1c (per 1% increase) | −4.4031 | 0.23 |
| Pre-shift eGFR (per 1 mL/min/1.73 m2 increase) | −0.1738 | <0.01 |
| Hypertension (ref: no) | 6.5354 | 0.22 |
| Average WBGT (per 1 °C increase) | −1.6231 | 0.03 |
| Osmolality (per 1-unit increase) | −0.2124 | 0.08 |
| Hyperuricemia (ref: no) | −8.8987 | <0.01 |
| Creatine kinase, 174–870 (ref: ≤174) | 1.6358 | 0.53 |
| Creatine kinase, ≥870 (ref: ≤174) | 1.4272 | 0.74 |
| pH = 6.0–6.5 (ref: 7.0–7.5) | −1.6484 | 0.35 |
| pH = 5.0 (ref: 7.0–7.5) | −6.0508 | 0.03 |
Bold values are statistically significant.
WBGT, wet bulb globe temperature.
In the model which examined the hypothesis that inflammation is associated with daily sub-clinical kidney injury, we observed that post-shift urinary leukocyte esterase was associated with an average decline of 10% across the work shift. In addition, increasing age, HgA1c, and pre-shift eGFR were significant risk factors for decline (Table 8).
TABLE 8.
Multivariable Analysis of Post-Shift Inflammation Associated With Percent Change in Cross-Shift eGFR
| Effect | Estimate | P-Value |
| Intercept | 50.55 | 0.04 |
| Age (per 1-yr increase) | −0.35 | <0.01 |
| HgA1c (per 1% increase) | −8.24 | 0.02 |
| Pre-shift eGFR (per 1 mL/min/1.73 m2 increase) | −0.11 | 0.03 |
| Hypertension (ref: no) | 0.54 | 0.92 |
| Post-shift leukocyte esterase (≥70+ /μL) | −9.95 | <0.01 |
Bold values are statistically significant.
eGFR, estimated glomerular filtration rate.
Post-hoc Analysis
Creatine kinase may hypothetically produce cross-shift increases in measured serum creatinine. However, in this study, no associations between creatine kinase categories (less than or equal to 174, 174 to 870, more than 870) and percent change in eGFR, nor post-shift creatinine, were found at any time point using Wilcoxon rank test (P = 0.90).
DISCUSSION
In this study of 105 sugarcane workers who started the harvest season with normal eGFR, we saw a high prevalence of acute cross-shift declines in eGFR. We observed that most workers were well hydrated throughout the work shift, yet still experienced significant decline in renal function. The combined evidence relating kidney function to WBGT and other biomarkers of injury leads us to conclude that heat stress is a contributory risk factor for acute kidney injury in this population. Our data also suggest that the daily acute changes in kidney function are the consequence of an interstitial inflammatory process, which is consistent with the current understanding of CKDu.10
Additionally, we found surprisingly high rates of pre-diabetes based on HbA1c in this work group which were associated with a significant risk of cross-shift decline in eGFR. One potential reason for this finding is that hyperuricemia has been epidemiologically and experimentally associated with the development of prediabetes and diabetes.39 It is also possible that laboratory measurement of HgA1c is being affected by anemia, which is common,21,40,41 although not measured in this study. Other risk factors for greater decline across the work shift included age and pre-shift eGFR.
The finding of cross-shift decline in renal function is consistent with other studies of workers exposed to comparable occupational conditions in El Salvador,2,12 Nicaragua,25,42 the US,43 and Brazil.26 However, our cohort is noteworthy in that all workers started the season with normal eGFR, were overall well hydrated and despite which, they manifested cross-shift renal dysfunction.
Role of Heat Stress in Early Kidney Injury
In multivariate analysis, we found WBGT to be a significant contributor to cross-shift decline in kidney function (Table 6). High ambient temperatures coupled with a high physical workload place profound physiologic demands on the body. Previous studies in Central America have suggested a link between these factors and the development of CKDu2,22,25,26,42,44–46 and prior studies have found WBGT and heat strain to be significantly associated with cross-shift declines in eGFR.2,43 Cutting sugarcane is strenuous work and the average worker in this study harvested over 6 tons of sugar cane per day under an average WBGT of 31.24 (standard deviation [SD] 1.09).24 The OSHA heat exposure threshold is 30 °C, at which point it is recommended that workers spend 25% time working and 75% of time resting each hour, whereas these workers spent 10 hours in the field harvesting with 2 hours of rest time (75% time working and 25% time resting).47 While our study supports the conclusion that heat exposure contributes to risk of acute kidney injury, we found no relationship between acute renal dysfunction and rhabdomyolysis, suggesting the need to consider other mechanisms of injury.
In addition to contributing to dehydration, hypovolemia, and tissue hypoperfusion, heat exposure independently activates other pathways of injury (Fig. 1). Animal models suggest that heat exposure results in direct vasopressin release, which activates the aldose-reductase/fructokinase pathway, resulting in direct kidney injury from elevated fructose levels and secondary injury from elevated uric acid.48
Role of Uric Acid in Early Kidney Injury
In this study, there was a significant association between hyperuricemia, uricosuria, and decline in cross-shift eGFR. Hyperuricemia was found in approximately 25% of workers, similar to the incidence reported in a cohort of equivalently young and otherwise healthy workers who met clinical criteria for acute CKDu.11 Notably, in the multivariable model, it was the single strongest contributor to cross-shift decline in kidney function. Other studies have reported higher rates of hyperuricemia (75% [49] and 91%2), however, in those studies the workers did not have a normal baseline eGFR and were potentially identified at later stages of disease.49 We suspect that hyperuricemia may be an important early manifestation of kidney injury and plays a role in the pathogenesis of disease.
Mechanistically, heat stress and hypoperfusion result in the release of uric acid from the breakdown of damaged cells and heat exposure results in uric acid generation through the aldose-reductase/fructokinase pathway.48,50 Uric acid mediates kidney injury in a number of ways. Systemic hyperuricemia alters autoregulation of intra-renal perfusion pressure, causing afferent arteriolar vasoconstriction, and resulting in an elevation of glomerular pressure. Ultimately, this results in a reduction in renal blood flow, which worsens hypoperfusion and may result in inflammatory impacts and oxidative damage.51 Uric acid also suppresses the synthesis of nitric oxide, causing vasoconstriction in the renal tubules, resulting in a hypoxic state, an inflammatory response, and ultimately fibrosis.52 Additionally, uricosuria independently induces inflammation resulting in tubular injury and fibrosis, which is worsened under acidic urinary conditions.53,54
Role of Subclinical Rhabdomyolysis in Early Kidney Injury
Chronic clinical and subclinical rhabdomyolysis were common in this cohort, as has been reported elsewhere. Wegman et al12 showed that increasing creatine kinase levels correlated with larger cross-shift declines in eGFR. Using a different approach, Paula Santos et al26 found significant increases in creatine kinase across the work shift associated with both acute kidney injury (defined per KDIGO criteria55) as well as non-acute kidney injury. Using an approach similar to Wegman, we found no relationship between creatine kinase elevations and cross-shift declines in eGFR. Serum creatine kinase begins to rise within 2 to 12 hours following the onset of muscle injury and reaches its maximum within 24 to 72 hours and a decline is usually seen within 3 to 5 days of cessation of injury.56,57 Although subclinical rhabdomyolysis was commonly found in our study cohort, data from Clarkson et al58 suggest that exercise-induced rhabdomyolysis should not be expected to cause increases in serum creatinine. In fact, given the extent of urinary acidification in our cohort, the lack of relationship between creatine kinase levels and acute nephrotoxicity furthers the case against subclinical rhabdomyolysis as a cause of the acute kidney injury that we observed.55
Role of Tissue Hypoperfusion in Early Kidney Injury
Our findings suggest that tissue hypoperfusion and resulting aciduria may compound the nephrotoxic effects of uric acid and possibly other nephrotoxins. Tissue hypoperfusion results in lactic acid generation from anaerobic cellular metabolism. In this study, poor tissue perfusion was demonstrated by significantly elevated BUN levels that were associated with declining cross-shift eGFR. Poor perfusion results in lactic acidosis and subsequent aciduria (pH < 7.0), which was significantly associated with cross-shift declines in eGFR (Table 5). Additionally, renal hypoperfusion can result in direct injury.59
Among this study cohort, post-shift urine alkalinity was significantly associated with an increase in cross-shift eGFR (protective) and elevated post-shift urine specific gravity was associated with a decrease in cross-shift eGFR.
Role of Dehydration and Hypovolemia in Early Kidney Injury
In this study, indicators of hypovolemia were associated with cross-shift declines in eGFR in the univariate analysis, including increasing post-shift urine specific gravity, BUN, and calculated serum osmolality. Prior studies have suggested that recurrent dehydration is a risk factor for the development of CKDu.12,32 Recurrent volume depletion causes a pre-renal pattern of kidney injury which has been shown experimentally to result in renal tubular injury and fibrosis.59 Mechanistically, hypovolemia results in increased serum osmolality which stimulates the aldose-reductase pathway in the kidney.32 Subsequent fructokinase activity generates oxidants that cause local tubular injury and simultaneously results in the formation of uric acid.48 Volume depletion also may cause renal injury by decreasing renal perfusion.59
The observed relationship between cross-shift decline in eGFR and serum osmolality and other markers of dehydration may be partially mediated by vasopressin. Recurrent dehydration and resulting renal injury, has been shown to be mediated by vasopressin, an endogenous hormone that is released in response to hyperosmolality and hypovolemia.48 Hypovolemia also activates the renin-angiotensin-aldosterone system (RAAS). Aldosterone decreases renal absorption of potassium, which may explain the high prevalence of hypokalemia in this study and others.1 Hypokalemia can in-turn independently reduce intrarenal perfusion pressure which can elicit renal tubular injury.60,61 Aldosterone release also results in bicarbonate reabsorption in the distal renal tubule which can worsen aciduria.2
Relationship Between Acute, Early Injury, and Chronic Kidney Disease
The proposed pathways described in Fig. 1 converge to suggest a shared mechanism of injury: renal hypoxia, oxidative damage, and resulting inflammation. Supporting this hypothesis, we found evidence that inflammation (leukocyturia) is a significant marker of cross-shift decline in kidney function (Table 7).
Recent evidence suggests that acute kidney injury is highly associated with eventual progression to CKDu. In a recent study by Fischer et al,21 8.4% of patients from CKDu endemic regions who presented to clinical attention with AKI progressed to CKDu within a median of 8 months. Importantly, 98% of patients presented in the acute period with leukocyturia and leukocytosis, suggesting an underlying inflammatory process of injury. Although workers in our study did not require clinical attention, we observed significant leukocyturia at all time points, suggesting that a similar injury pattern is occurring in workers with subclinical injury and that this injury pattern is occurring repeatedly throughout the harvest season. We speculate that workers who experience renal injury 1 day have insufficient time to recover kidney function before returning to work, resulting in compounding injury via the mechanisms described above, eventually leading to CKDu.
Biomarkers Predictive of Kidney Injury
This study identified an association between several physiologic biomarkers of tubular kidney injury and cross-shift decline in kidney function. In the univariate analysis, we found that both pre- and post-shift urinary NGAL levels significantly correlated with a decrease in cross-shift eGFR. Similarly, in a recent, prospective, community based, longitudinal study in Nicaragua, NGAL was found to be higher in people at high risk of decline in kidney function.62 In another longitudinal cohort study among sugarcane workers in Nicaragua, NGAL was found to increase during the harvest relative to pre-season evaluation,42 suggesting to the authors that the injury was due to occupational exposures. Urinary NGAL is a tubular epithelial cell protein that is upregulated and released in response to injury.42 NGAL's proposed function is as an endogenous bacteriostatic protein that scavenges bacterial siderophores (small molecules which bind iron). By binding iron, NGAL could have a bacteriostatic and antioxidant effect.63 Thus, induction of urinary NGAL under harmful conditions is a compensatory response to ameliorate oxidative stress-mediated damage.
From a practical, cost-effective perspective, it is noteworthy that several biomarkers that can be measured by dipstick were elevated in workers who experienced cross-shift declines in eGFR. Thus, dipstick analysis may prove to be a useful on-site screening tool in worker health programs to identify at risk workers and prevent injury. For example, pre-shift and post-shift urinary leukocytes were significantly associated with a decline in eGFR, suggesting an acute, recurrent inflammatory process. There is evidence that CKDu may manifest in an acute fashion at which time the pathologic picture is consistent with acute tubule-interstitial nephritis with accompanying systemic inflammation, including fever, elevations in C-reactive protein, leucocytosis, and culture negative leukocyturia.11 Therefore, workers with leukocyturia may be experiencing some degree of acute interstitial nephritis, consistent with acute CKDu.
OEM providers are uniquely positioned to monitor workers for early signs of CKDu, educate workers and employers, and evaluate and treat acute and chronic kidney injury in worker populations. With increasing ambient temperatures due to climate change, the OEM provider can play a pivotal role in recommending heat warning systems, hydration interventions, and medical surveillance programs, using these newly elucidated biomarkers of injury, to limit the burden of disease.64
LIMITATIONS
The study has several limitations. It would have been advantageous to have biomarker data for sequential days to evaluate if injury patterns are cumulative across a work week. Additionally, it would have been useful to have examined serum markers of injury pre-shift to be able to compare cross-shift changes, however, twice per day venipuncture exceeded workers’ comfort. While we recognize that eGFR may not be the ideal indicator of renal function, since serum creatinine is not in equilibrium across the work shift, given the current limited understanding of early markers of kidney injury, such as NGAL, and the use of eGFR in other worker cohort studies evaluating workers that included individuals with normal eGFR,12,25,26 we felt it was the best option for the current study design.
CONCLUSION
In conclusion, the present study demonstrates repetitive subclinical kidney injury among well hydrated sugarcane workers. We found elevations in biomarkers that support several hypothetical pathways through which exposure to high temperatures may contribute to the pathogenesis of kidney damage. However, these pathways of injury almost certainly synergize with other environmental exposures. Future research longitudinal research should test this hypothesis. In the interim, efforts should be made to identify, and mitigate, the risk of recurrent acute kidney injury.
Supplementary Material
Footnotes
Clinical Significance: An epidemic of kidney disease of unknown origin has emerged in the last decade among young agricultural workers characterized by progressive renal failure with a dearth of early symptoms. Across a work-shift, healthy individuals experience repetitive subclinical kidney injury associated with ambient high temperatures and biomarkers of extreme exertion.
Financial Support: This study was supported in part by Pantaleon; the Chancellor, CU Anschutz; Centers for Disease Control and Prevention (CDC) (U19 OH01127), and the Mountain and Plains Education and Research Center (T42 OH009229). Its contents are solely the responsibility of the authors and do not necessarily represent the official views of the CDC or the Department of Health and Human Services.
Disclosures: University of Colorado and Pantaleon are separate, independent organizations. University of Colorado employed appropriate research methods in keeping with academic freedom, based conclusions on critical analysis of the evidence and reported findings fully and objectively. The terms of this arrangement have been reviewed and approved by the University of Colorado in accordance with its conflict of interest policies.
REFERENCES
- 1.Glaser J, Lemery J, Rajagopalan B, et al. Climate change and the emergent epidemic of CKD from heat stress in rural communities: the case for heat stress nephropathy. Clin J Am Soc Nephrol 2016; 11:1472–1483. [DOI] [PMC free article] [PubMed] [Google Scholar]
- 2.García-Trabanino R, Jarquín E, Wesseling C, et al. Heat stress, dehydration, and kidney function in sugarcane cutters in El Salvador–a cross-shift study of workers at risk of Mesoamerican nephropathy. Environ Res 2015; 142:746–755. [DOI] [PubMed] [Google Scholar]
- 3.Orantes CM, Herrera R, Almaguer M, et al. Chronic kidney disease and associated risk factors in the Bajo Lempa region of El Salvador: Nefrolempa study, 2009. MEDICC Rev 2011; 13:14–22. [DOI] [PubMed] [Google Scholar]
- 4.Herrera R, Orantes CM, Almaguer M, et al. Clinical characteristics of chronic kidney disease of nontraditional causes in Salvadoran farming communities. MEDICC Rev 2014; 16:39–48. [DOI] [PubMed] [Google Scholar]
- 5.Nanayakkara S, Komiya T, Ratnatunga N, et al. Tubulointerstitial damage as the major pathological lesion in endemic chronic kidney disease among farmers in North Central Province of Sri Lanka. Environ Health Prev Med 2012; 17:213–221. [DOI] [PMC free article] [PubMed] [Google Scholar]
- 6.Abraham G, Varughese S, Thandavan T, et al. Chronic kidney disease hotspots in developing countries in South Asia. Clin Kidney J 2016; 9:135–141. [DOI] [PMC free article] [PubMed] [Google Scholar]
- 7.Wanigasuriya K. Update on uncertain etiology of chronic kidney disease in Sri Lanka's north-central dry zone. MEDICC Rev 2014; 16:61–65. [DOI] [PubMed] [Google Scholar]
- 8.Gifford FJ, Gifford RM, Eddleston M, Dhaun N. Endemic nephropathy around the world. Kidney Int Rep 2017; 2:282–292. [DOI] [PMC free article] [PubMed] [Google Scholar]
- 9.Moyce S, Joseph J, Tancredi D, Mitchell D, Schenker M. Cumulative incidence of acute kidney injury in California's agricultural workers. J Occup Environ Med 2016; 58:391–397. [DOI] [PMC free article] [PubMed] [Google Scholar]
- 10.Johnson RJ, Wesseling C, Newman LS. Epidemic chronic kidney disease in agricultural communities. N Engl J Med. in press. [DOI] [PubMed] [Google Scholar]
- 11.Fischer RS, Vangala C, Truong L, et al. Early detection of acute tubulointerstitial nephritis in the genesis of Mesoamerican nephropathy. Kidney Int 2018; 93:681–690. [DOI] [PubMed] [Google Scholar]
- 12.Wegman DH, Apelqvist J, Bottai M, et al. Intervention to diminish dehydration and kidney damage among sugarcane workers. Scand J Work Environ Health 2018; 44:16–24. [DOI] [PubMed] [Google Scholar]
- 13.Ramírez-Rubio O, Amador JJ, Kaufman JS, et al. Urine biomarkers of kidney injury among adolescents in Nicaragua, a region affected by an epidemic of chronic kidney disease of unknown aetiology. Nephrol Dial Transplant 2015; 31:424–432. [DOI] [PMC free article] [PubMed] [Google Scholar]
- 14.Cerón A, Fort MP, Morine CM, Lou-Meda R. Chronic kidney disease among children in Guatemala. Rev Panam Salud Publica 2014; 36:376–382. [PubMed] [Google Scholar]
- 15.Global Burden of Disease: Disease and Injury Country Estimates World Health Organization. Available at: https://www.who.int/healthinfo/global_burden_disease/en/ Accessed December 20, 2018. [Google Scholar]
- 16.Epidemic of Chronic Kidney Disease in Agricultural Communities in Central America Case definitions, Methodological Basis and Approaches for Public Health Surveillance. Washington, DC: PAHO; 2017. [Google Scholar]
- 17.Webster AC, Nagler EV, Morton RL, Masson P. Chronic kidney disease. Lancet 2017; 389:1238–1252. [DOI] [PubMed] [Google Scholar]
- 18.Fischer RS, Mandayam S, Chavarria D, et al. Clinical evidence of acute mesoamerican nephropathy. Am J Trop Med Hyg 2017; 97:1247–1256. [DOI] [PMC free article] [PubMed] [Google Scholar]
- 19.Coca SG, Singanamala S, Parikh CR. Chronic kidney disease after acute kidney injury: a systematic review and meta-analysis. Kidney Int 2012; 81:442–448. [DOI] [PMC free article] [PubMed] [Google Scholar]
- 20.Beker BM, Corleto MG, Fieiras C, Musso CG. Novel acute kidney injury biomarkers: their characteristics, utility and concerns. Int Urol Nephrol 2018; 50:705–713. [DOI] [PubMed] [Google Scholar]
- 21.Fischer RS, Vangala C, Mandayam S, et al. Clinical markers to predict progression from acute to chronic kidney disease in Mesoamerican nephropathy. Kidney Int 2018; 94:1205–1216. [DOI] [PMC free article] [PubMed] [Google Scholar]
- 22.Lucas RA, Bodin T, García-Trabanino R, et al. Heat stress and workload associated with sugarcane cutting-an excessively strenuous occupation!. Extrem Physiol Med 2015; 4:A23. [Google Scholar]
- 23.Johnson RJ, Sánchez-Lozada LG. Chronic kidney disease: mesoamerican nephropathy—new clues to the cause. Nat Rev Nephrol 2013; 9:560. [DOI] [PubMed] [Google Scholar]
- 24.Crowe J, Wesseling C, Solano BR, et al. Heat exposure in sugarcane harvesters in Costa Rica. Am J Ind Med 2013; 56:1157–1164. [DOI] [PubMed] [Google Scholar]
- 25.Wesseling C, Aragón A, González M, et al. Kidney function in sugarcane cutters in Nicaragua—a longitudinal study of workers at risk of Mesoamerican nephropathy. Environ Res 2016; 147:125–132. [DOI] [PubMed] [Google Scholar]
- 26.Santos UP, Zanetta DMT, Terra-Filho M, Burdmann EA. Burnt sugarcane harvesting is associated with acute renal dysfunction. Kidney Int 2015; 87:792–799. [DOI] [PubMed] [Google Scholar]
- 27.Wesseling C, Aragon A, Gonzalez M, et al. Heat stress, hydration and uric acid: a cross-sectional study in workers of three occupations in a hotspot of Mesoamerican nephropathy in Nicaragua. BMJ Open 2016; 6:e011034. [DOI] [PMC free article] [PubMed] [Google Scholar]
- 28.Roncal-Jimenez C, Lanaspa M, Jensen T, Sanchez-Lozada L, Johnson R. Mechanisms by which dehydration may lead to chronic kidney disease. Ann Nutr Metab 2015; 66 suppl:10–13. [DOI] [PubMed] [Google Scholar]
- 29.Jayasumana C, Gunatilake S, Senanayake P. Glyphosate, hard water and nephrotoxic metals: are they the culprits behind the epidemic of chronic kidney disease of unknown etiology in Sri Lanka? Int J Environ Res Public Health 2014; 11:2125–2147. [DOI] [PMC free article] [PubMed] [Google Scholar]
- 30.Valcke M, Levasseur ME, da Silva AS, Wesseling C. Pesticide exposures and chronic kidney disease of unknown etiology: an epidemiologic review. Environ Health 2017; 16:49. [DOI] [PMC free article] [PubMed] [Google Scholar]
- 31.Schulte PA, Pandalai S, Wulsin V, Chun H. Interaction of occupational and personal risk factors in workforce health and safety. Am J Public Health 2012; 102:434–448. [DOI] [PMC free article] [PubMed] [Google Scholar]
- 32.Correa-Rotter R, Wesseling C, Johnson RJ. CKD of unknown origin in Central America: the case for a Mesoamerican nephropathy. Am J Kidney Dis 2014; 63:506–520. [DOI] [PMC free article] [PubMed] [Google Scholar]
- 33.Butler-Dawson J, Krisher L, Asensio C, et al. Risk factors for declines in kidney function in sugarcane workers in Guatemala. J Occup Environ Med 2018; 60:548–558. [DOI] [PMC free article] [PubMed] [Google Scholar]
- 34.National Institute of Safety and Health (NIOSH) Working in Hot Environments NIOSH Pub No 86-112. Cincinnati, OH: NIOSH; 1986. [Google Scholar]
- 35.Griffin BR, Butler-Dawson J, Dally M, et al. Unadjusted point of care creatinine results overestimate acute kidney injury incidence during field testing in Guatemala. PLoS One 2018; 13:e0204614. [DOI] [PMC free article] [PubMed] [Google Scholar]
- 36.Levey AS, Stevens LA, Schmid CH, et al. A new equation to estimate glomerular filtration rate. Ann Intern Med 2009; 150:604–612. [DOI] [PMC free article] [PubMed] [Google Scholar]
- 37.MedCalc online. Available at: http://wwwmedcalccom/osmolhtml Accessed December 20, 2018. [Google Scholar]
- 38.United States Department of Labor Occupational Safety and Health Administration. Water Rest Shade OSHS's Campaign to Keep Workers Safe in the Heat. Available at: https://wwwoshagov/heat/ Accessed March 6, 2018. [Google Scholar]
- 39.Johnson RJ, Nakagawa T, Sanchez-Lozada LG, et al. Sugar, uric acid, and the etiology of diabetes and obesity. Diabetes 2013; 62:3307–3315. [DOI] [PMC free article] [PubMed] [Google Scholar]
- 40.Coban E, Ozdogan M, Timuragaoglu A. Effect of iron deficiency anemia on the levels of hemoglobin A1c in nondiabetic patients. Acta Haematol 2004; 112:126–128. [DOI] [PubMed] [Google Scholar]
- 41.English E, Idris I, Smith G, Dhatariya K, Kilpatrick ES, John WG. The effect of anaemia and abnormalities of erythrocyte indices on HbA1c analysis: a systematic review. Diabetologia 2015; 58:1409–1421. [DOI] [PubMed] [Google Scholar]
- 42.Laws RL, Brooks DR, Amador JJ, et al. Biomarkers of kidney injury among Nicaraguan sugarcane workers. Am J Kidney Dis 2016; 67:209–217. [DOI] [PMC free article] [PubMed] [Google Scholar]
- 43.Moyce S, Mitchell D, Armitage T, Tancredi D, Joseph J, Schenker M. Heat strain, volume depletion and kidney function in California agricultural workers. Occup Environ Med 2017; 74:402–409. [DOI] [PMC free article] [PubMed] [Google Scholar]
- 44.Patel DR, Gyamfi R, Torres A. Exertional rhabdomyolysis and acute kidney injury. Phys Sportsmed 2009; 37:71–79. [DOI] [PubMed] [Google Scholar]
- 45.Delgado Cortez O. Heat stress assessment among workers in a Nicaraguan sugarcane farm. Global Health Action 2009; 2:2069. [DOI] [PMC free article] [PubMed] [Google Scholar]
- 46.Crowe J, Nilsson M, Kjellstrom T, Wesseling C. Heat-Related symptoms in sugarcane harvesters. Am J Ind Med 2015; 58:541–548. [DOI] [PubMed] [Google Scholar]
- 47.Occupational Safety and Health Administration (OSHA) OSHA Technical Manual, Section III: Chapter 4 Heat Stress. Available at: https://wwwoshagov/dts/osta/otm/otm_iii/otm_iii_4html Accessed March 19, 2018. [Google Scholar]
- 48.García-Arroyo FE, Tapia E, Blas-Marron MG, et al. Vasopressin mediates the renal damage induced by limited fructose rehydration in recurrently dehydrated rats. Int J Biol Sci 2017; 13:961–975. [DOI] [PMC free article] [PubMed] [Google Scholar]
- 49.Wijkström J, Leiva R, Elinder CG, et al. Clinical and pathological characterization of Mesoamerican nephropathy: a new kidney disease in Central America. Am J Kidney Dis 2013; 62:908–918. [DOI] [PubMed] [Google Scholar]
- 50.Knochel JP. Mechanisms of rhabdomyolysis. Curr Opin Rheumatol 1993; 5:725–731. [DOI] [PubMed] [Google Scholar]
- 51.Roncal-Jimenez C, García-Trabanino R, Barregard L, et al. Heat stress nephropathy from exercise-induced uric acid crystalluria: a perspective on Mesoamerican nephropathy. Am J Kidney Dis 2016; 67:20–30. [DOI] [PubMed] [Google Scholar]
- 52.Kanellis J, Kang DH. Uric acid as a mediator of endothelial dysfunction, inflammation, and vascular disease. Semin Nephrol 2005; 25:39–42. [DOI] [PubMed] [Google Scholar]
- 53.Johnson RJ, Kivlighn SD, Kim YG, Suga S, Fogo AB. Reappraisal of the pathogenesis and consequences of hyperuricemia in hypertension, cardiovascular disease, and renal disease. Am J Kidney Dis 1999; 33:225–234. [DOI] [PubMed] [Google Scholar]
- 54.Iwata H, Nishio S, Yokoyama M, Matsumoto A, Takeuchi M. Solubility of uric acid and supersaturation of monosodium urate: why is uric acid so highly soluble in urine? J Urol 1989; 142:1095–1098. [DOI] [PubMed] [Google Scholar]
- 55.Khwaja A. KDIGO clinical practice guidelines for acute kidney injury. Nephron Clin Pract 2012; 120:c179–c184. [DOI] [PubMed] [Google Scholar]
- 56.Zutt R, Van Der Kooi A, Linthorst G, Wanders R, De Visser M. Rhabdomyolysis: review of the literature. Neuromuscul Disord 2014; 24:651–659. [DOI] [PubMed] [Google Scholar]
- 57.Huerta-Alardín AL, Varon J, Marik PE. Bench-to-bedside review: rhabdomyolysis–an overview for clinicians. Crit Care 2004; 9:158–169. [DOI] [PMC free article] [PubMed] [Google Scholar]
- 58.Clarkson PM, Kearns AK, Rouzier P, Rubin R, Thompson PD. Serum creatine kinase levels and renal function measures in exertional muscle damage. Med Sci Sports Exerc 2006; 38:623–627. [DOI] [PubMed] [Google Scholar]
- 59.Roncal Jimenez C, Ishimoto T, Lanaspa M. Dehydration-induced renal injury: a fructokinase mediated disease?[published online ahead of print December 11, 2013]. Kidney Int 2013. [Google Scholar]
- 60.Nakagawa T, Kang DH, Ohashi R, et al. Tubulointerstitial disease: role of ischemia and microvascular disease. Curr Opin Nephrol Hypertens 2003; 12:233–241. [DOI] [PubMed] [Google Scholar]
- 61.Suga S-I, Phillips MI, Ray PE, et al. Hypokalemia induces renal injury and alterations in vasoactive mediators that favor salt sensitivity. Am J Physiol Renal Physiol 2001; 281:F620–F629. [DOI] [PubMed] [Google Scholar]
- 62.Gonzalez-Quiroz M, Smpokou E-T, Silverwood RJ, et al. Decline in kidney function among apparently healthy young adults at risk of mesoamerican nephropathy. J Am Soc Nephrol 2018; 29:2200–2212. [DOI] [PMC free article] [PubMed] [Google Scholar]
- 63.Kokkoris S, Pipili C, Grapsa E, Kyprianou T, Nanas S. Novel biomarkers of acute kidney injury in the general adult ICU: a review. Ren Fail 2013; 35:579–591. [DOI] [PubMed] [Google Scholar]
- 64.Perkison WB, Kearney GD, Saberi P, et al. Responsibilities of the occupational and environmental medicine provider in the treatment and prevention of climate change-related health problems. J Occup Environ Med 2018; 60:e76–e81. [DOI] [PubMed] [Google Scholar]
Associated Data
This section collects any data citations, data availability statements, or supplementary materials included in this article.