Abstract
Compound 27 [1, 12-bis(4-(4-amino-6,7-dimethoxyquinazolin-2-yl)piperazin-1-yl)dodecane-1,12-dione ] is a novel small molecule agonist of EphA2 receptor Tyrosine Kinase. It showed much improved activity for the activation of EphA2 receptor compared to the parental compound Doxazosin. To support further pharmacological and toxicological studies of the compound, a method using liquid chromatography and electrospray ionization tandem mass spectrometry (LC- MS/MS) has been developed for the quantification of this compound. Liquid-liquid extraction was used to extract the compound from mouse plasma and brain tissue homogenate. Reverse phase chromatograph with gradient elution was performed to separate compound 27 from the endogenous molecules in the matrix, followed by MS detection using positive ion multiple reaction monitoring (MRM) mode. MRM Transitions m/z 387.3→290.1 and m/z 384.1→247.1 were selected for monitoring compound 27 and internal standard Prazosin, respectively. The linear calibration range was 2-200 ng/ml with the intra- and inter-day precision and accuracy within the acceptable range. This method was successfully applied in the quantitative analysis of compound 27 in mouse plasma and brain tissue with different drug administration routes.
Keywords: EphA2, cancer, agonist, LC-MS/MS, pharmacokinetics
1. Introduction
Erythropoietin-producing hepatocellular receptor 2 (EphA2) is one of the receptor tyrosine kinases overexpressed in many types of human cancers, and the overexpression is correlated with malignant progression and poor prognosis(Miao et al., 2009; Li et al., 2010; McCarron et al., 2010) . Upon activation by its endogenous ligand ephrin-A1, EphA2 suppresses tumor progression, including induction of apoptosis, inhibition of cell proliferation, and suppression of cell migration(Carles-Kinch et al., 2002; Duxbury et al., 2004; Noblitt et al., 2004; Jackson et al., 2008) . However, in the absence of ligand, EphA2 could initiate ligand-independent activation, which actually trigger different signal transduction and promotes cell migration and invasion (Miao et al., 2009; Astin et al., 2010; Li et al., 2010; McCarron et al., 2010; Biao-xue et al., 2011) . Unfortunately, EphA2 overexpression is always accompanied by loss of expression or mis-localization of ephrin-A1 in tumors. The reduced ligand leads to more ligand-independent activation of EphA2, which eventually results in tumor progression(Pasquale, 2008, 2010; Miao et al., 2009; Li et al., 2010; Miao and Wang, 2012; Nasreen, Khodayari and Mohammed, 2012) . In vivo studies have demonstrated that EphA2 activation by systemically administered ephrin-A1 could decrease tumorigenicity and invasiveness of carcinoma xenografts(Noblitt et al., 2004; Jackson et al., 2008; Wang, 2011). As therapeutic agents, ephrins have multiple disadvantages such as low stability and low permeability. Small molecule which can mimic ephrin-A1 for activation of EphA2 can be exploited as novel cancer therapeutics.
Previously, we identified Doxazosin that could activate EphA2 and inhibit malignant behaviors of prostate cancer in vitro and in vivo (Petty et al., 2012). As an antagonist for α1-adrenoreceptor, Doxazosin is commonly used for treating hypertension and benign prostate hyperplasia. However, the potency of Doxazosin as an agonist of EphA2 is not good enough for clinical application in cancer treatment. Further structural optimization of Doxazosin led to the discovery of a new EphA2 agonist compound 27 with enhanced affinity, specificity, and potency (Petty et al., 2018). In order to investigate the compound with in vivo animal models for its targeting effect to EphA2 and therapeutic efficacy, a pre-clinical pharmacokinetic study is urgently needed. A quantitative method for determination of the concentration of compound 27 is required to establish the pharmacokinetics (PK) profiles. Hence, in the present study, we describe a simple and robust method using standard LC–MS/MS for the determination of the concentration of compound 27 in different matrixes. Finally, this method was successfully applied to the pre-clinical pharmacokinetic study of compound 27 in mouse plasma and brain tissue after subcutaneous or intraperitoneal injection to the mice.
2. Experimental
2.1. Materials
Compound 27 and internal standard (ISTD) Prazosin were synthesized and purified according to the published procedure (Figure. 1)(Petty et al., 2018). HPLC grade acetonitrile and ACS grade ethyl acetate were purchased from BDH chemicals (Carle Place, NY) and LC/MS grade formic acid was from Fisher Scientific (Waltham, MA). Deionized water was purified using a Barnstead NANOpure® water purification system from Thermo Scientific (Waltham, MA). Six different lots of Non Swiss Albino Mouse plasma were obtained from Innovative Research (Novi, MI).
Figure 1.
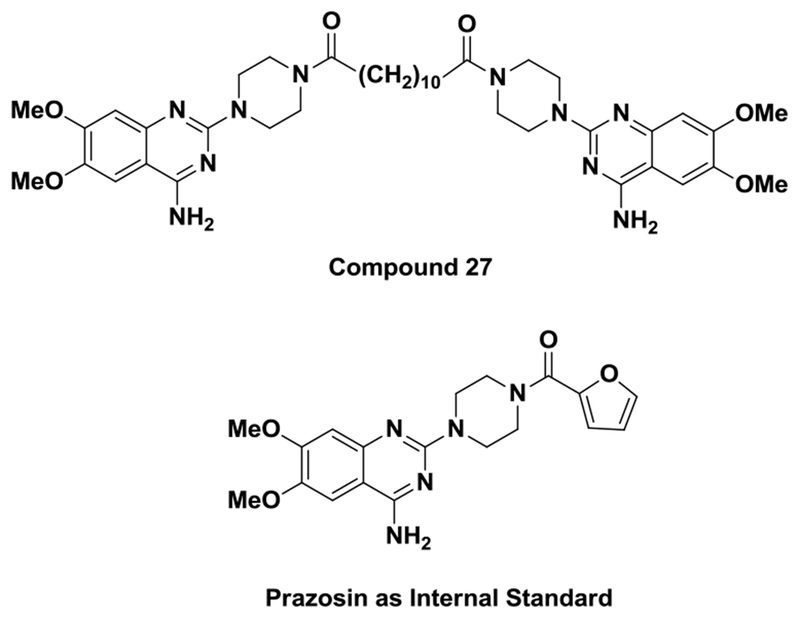
The chemical structures of compound 27 and internal standard (IS) Prazosin
2.2. Preparation of stock solutions and working solutions
The stock solution of compound 27 and Prazosin were prepared by dissolving the corresponding compounds in DMSO to reach the concentration of 1 mg/mL. One set of compound 27 working solutions at 20, 50, 100, 200, 500, 1000 and 2000 ng/mL, was prepared by serial dilution of the stock solution with acetonitrile, and then used for preparing the calibration standards. Another set of compound 27 working solution at 10, 30, 250 and1600ng/mL was made in a similar way, and used for preparation of quality control (QC) samples. The Prazosin working solution was prepared by diluting 1 mg/mL stock solution to 100ng/mL with acetonitrile.
2.3. Preparation of calibration standards and quality control (QC) samples
The calibration standards were prepared by spiking 5 μL of compound 27 working solution into 45 μL blank mouse plasma (total volume 50μL) to give the final concentration of compound 27 at 2, 5, 10, 20, 50, 100 and 200ng/mL. The mouse blank plasma is the mixture of six different mice plasma. The QC samples were preparation in a similar way at 1, 3, 25 and 160 ng/mL, representing lower limit of quantification (LLOQ), low QC (LQC), middle QC (MQC) and high QC (HQC) of compound 27 in mouse plasma, respectively. For the brain homogenate, six different mouse brains were homogenized together and sonicated and then centrifuged. 5 μL of compound 27 working solution was added to 45 μL of blank supernatant of the brain homogenate. All of the calibration standards and QC samples were further treated according to the sample preparation procedure.
2.4. Sample preparation for analysis
For unknown study samples, 45 μL sample (serum or brain homogenate) was used and 5 μL acetonitrile was added to make 50 μL that is identical to the standard curve samples. 50 μL mouse plasma or brain homogenate samples from the calibration standards, QC samples or to be tested samples were mixed with 5 μL ISTD working solution (100 ng/mL) to reach 55 μL total volume. 500 μL of ethyl acetate was added to the 55 μL samples, followed by vortexing for 60s and then centrifuging at 12000 rpm for 15min. Then 400 μL of supernatant was collected and blow-dried using nitrogen blow down dry evaporator. The dry residue was reconstituted with 200 μL acetonitrile/water (4:1, v/v) and then subjected to LC-MS/MS analysis.
2.5. LC-MS/MS analysis
A Shimadzu UPLC system (Columbia, MD) consists of Prominence DGU-20A3R inline degasser, two LC-30AD pumps, a SIL-30AC auto sampler, and a CBM-20A controller. The chromatographic separation was performed on a Kinetex C18 column at room temperature (50 × 2.1mm, 1.3μm) with a SecurityGuard ULTRA Cartridges and UPLC in-line filter (Phenomenex, CA). An optimized gradient of mobile phase A: water with 2% acetonitrile and 0.1% formic acid and mobile phase B: acetonitrile with 0.1% formic acid at the flow rate of 0.25 ml/min was used (see Table 1).
Table 1.
HPLC gradient programa
| Minutes | B % |
|---|---|
| 0-1 | 10 (isocratic) |
| 1-4 | 10-90 (linear) |
| 4-9 | 90 (isocratic) |
| 9-10 | 10 (linear) |
| 10-17 | 10 (isocratic) |
Mobile phase A was 2% acetonitrile with 0.1% formic acid and mobile phase B was 100% acetonitrile with 0.1% formic acid
The compound 27 detection was performed on an AB Sciex Qtrap 5500 mass spectrometer (Toronto, Canada) with positive electrospray ionization mode. The multiple reactions monitoring (MRM) function was used for quantification with the transitions setting at m/z 387.3→290.1 for compound 27 and m/z 384.1→247.1 for Prazosin. The optimized ion source parameters were set as follows: ion spray voltage, 5000 V; temperature, 450°C; heating gas, nebulization gas, curtain gas, 40psi. Compound parameters were as follows: declustering potential, 141V; entrance potential, 10 V; collision energy, 37 V for compound 27, 39 V for ISTD; collision exit potential, 24V for compound 27, 18V for ISTD. Data acquisition and quantification were performed using analyst software (version 1.6.2).
2.6. Analytical method validation
2.6.1. Calibration curve, sensitivity, and selectivity
Calibration curves were constructed using the peak area ratio of compound 27 to ISTD Prazosin (y) vs the concentration of compound 27 (x) in the calibration standards. The weighted linear regression was generated using 1/x as weighting factor. The sensitivity of the method was evaluated by whether the LLOQ and the lowest concentration in a calibration curve can be quantified with accuracy and precision within 20%. The selectivity was evaluated by testing the presence of the interfering peak in blank plasma samples from six different sources and blank brain tissue with untreated mice.
2.6.2. Matrix effect and extraction efficiency
The relative matrix effect and extraction efficiency were studied at three QC levels: 3, 25, and 160ng/ml. The relative matrix effect was determined by comparing the peak area ratio of compound 27 and ISTD spiked in the blank plasma post-extraction solution with that in the neat solution (acetonitrile/water (4:1, v/v)). The post-extraction solution was prepared by blank plasma extraction and reconstitution of dry extracts with acetonitrile/water using the procedures described above. The relative extraction efficiency was determined by comparing the peak area ratio of compound 27 and ISTD spiked in the plasma before extraction with that spiked in blank plasma post-extraction solution. The same procedure was repeated for brain homogenate.
2.6.3. Precision and accuracy
Intra- and inter-assay precision and accuracy were assessed using QC samples at three different concentrations: 3, 25, and 160ng/mL. Intra-assays were carried out with five replicates (n=5) for each concentration in the same day, while inter-assay were performed for each concentration in five replicates in five days. The experimental determined concentrations of compound 27 in QC samples were compared to the theoretical spiked values.
2.6.4. Stability study
The stability of compound 27 in mouse plasma was evaluated by subjecting QC samples (3 and 160ng/ml) to the following conditions: sitting at R. T. for 6 and 24h, three freeze/thaw cycles, −20°C for 2 months. The freeze thaw cycle comprises freezing for 24h at −20°C and then thawing at R. T. for 30 min.
2.7. Pharmacokinetic studies of compound 27 in mouse plasma and brain tissue
The animal study was approved by Case Western Reserve University animal care and use committee and adheres to the Guide for the Care and Use of Laboratory Animals, 8th edition (NIH). 3 month old female mice (Charles River) were randomly divided to 14 groups (5 mice per group). The mice were treated with the compounds or vehicle via subcutaneous injection or intraperitoneal injection (two sets of different treatment). At different time point ranged from 30mins to 24h, the mice were anesthetized to perform the heart perfusion with saline, and then euthanized. 200uL of blood sample was collected from each mice and brain tissue was collected as well. The plasma was immediately separated by centrifugation at 5000 rpm for 5min at the room temperature and stored frozen at −20 °C until analysis. The brain tissue were homogenized and centrifuged at 10000rpm to collect the supernatant, and then stored frozen at −20 °C until analysis. The examination of compound 27 was performed with the developed quantitative method.
Results and Discussion
3.1. Optimization of mass spectrometric and chromatographic conditions
In order to optimize the MS parameters for detection, 50 ng/mL of compound 27 and 10 ng/mL of ISTD in acetonitrile/water (4:1, v/v) were introduced into mass spectrometer through direct infusion at 10 μL/min. Based on the structural properties of compound 27, the positive ionization mode was chosen to detect the signals of the compound. The mass spectra of compound 27 and ISTD showed mass-to-charge ratio at [M+2H]2+ 387.3 and [M+H]+ 384.1, respectively. Due to the symmetric structure, compound 27 has two positive charges vs the ISTD has only one positive charge. The corresponding product ion spectra are shown in Figure 2. The three most abundant product ions after fragmentation were found at m/z 290.1, 247.1, and 231.0 for compound 27 and m/z 247.2, 231.1, and 95.1 for ISTD. The proposed structures for the product ions of both compound 27 and ISTD are shown in Figure 3. The MRM transitions of m/z 387.3→290.1 for compound 27 and m/z 384.1→247.1for ISTD were selected for quantification. The other MRM transitions, m/z 387.3→247.1 and 387.3→231.0 for compound 27, 384.1→231.1 and 384.1→95.1 for ISTD were also monitored during LC-MS/MS analysis for the qualitative accuracy.
Figure 2.
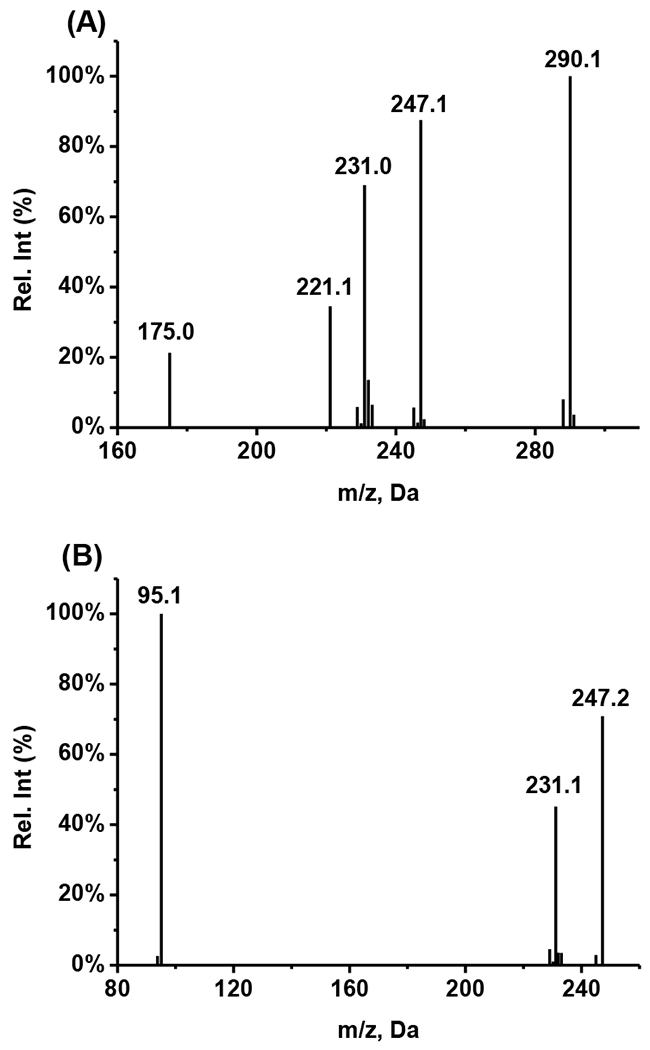
Product ion spectra of (A) compound 27 and (B) Prazosin (IS)
Figure 3.
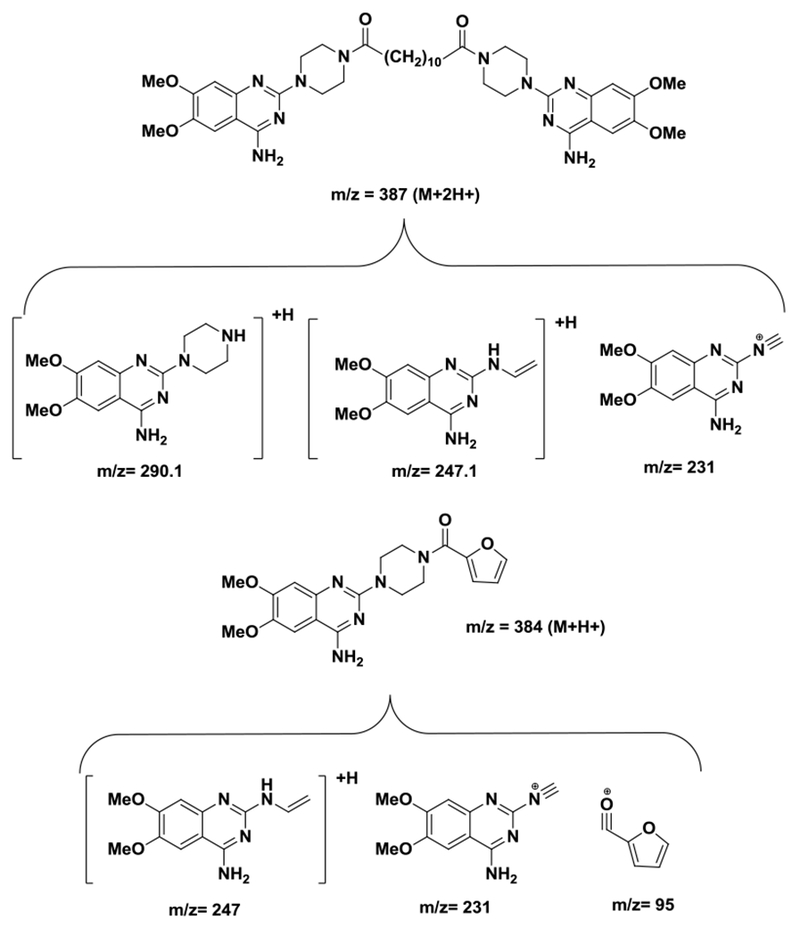
The proposed structures for product ions of compound 27 and IS
For the chromatographic separation, various linear gradients of water and acetonitrile were tested initially. However the peak tailing was always an issue. Considering the dimer structural properties of compound 27, the peak tailing could be caused by the ion-exchange interaction between a positive charged compound 27 and the stationary phase silanol in reverse phase HPLC column. So water/acetonitrile mobile phases with 0.1% formic acid were tested and found to be able to eliminate the peak tailing. An optimized gradient of water/acetonitrile mobile phases with 0.1% formic acid eluted compound 27 at 4.22 min and ISTD at 4.04min.
3.2. Sample extraction
As a simple and fast sample preparation technique, the protein precipitation (PPT) has been used extensively for sample extraction. Initially, PPT method using acetonitrile was explored to extract compound 27 from the calibration standards. The result did not show much matrix suppression. When it was used for extraction from the calibration standards which was spiked with 1% Twen80 or 1% Cremophor beforehand, significant matrix effects were observed. Mobile phase gradient adjustment cannot eliminate the effects from both formulation agents. Since 10% Cremophor was used as the formulation agent in the animal treatment, it presented in the mice plasma at high concentrations (>1 mg/ml) in the early sampling time points, which could make the sample signals not accurate. In order to reduce or eliminate the matrix effects from the formulation agents, we resorted to liquid-liquid extraction (LLE) which provides cleaner extracts than PPT. Considering the solubility of compound 27 in different organic solvents, we test two solvents ethyl acetate and methyl tert-butyl ether (MTBE) for LLE. No significant matrix effects were observed for LLE using both solvents. However ethyl acetate yielded slightly higher extraction recovery than MTBE. Therefore, LLE with ethyl acetate was used for plasma sample extraction in our study. To keep it consistent, the same method was also used for the brain sample process.
3.3. Development of LC-MS/MS method for the quantification of compound 27
3.3.1. Linearity, selectivity, and sensitivity
Compound calibration curve was obtained using blank plasma or brain homogenate supernatant and seven non-blank calibration standards at the concentrations of 2, 5, 10, 20, 50, 100 and 200 ng/mL. The peak area ratio of compound 27 to ISTD (y) vs compound 27 concentration(x) was plotted using a weighted (1/x) linear regression. The compound 27 calibration curves in both mouse plasma and brain tissue was highly linear from 2 to 200ng/ml with correlation coefficients (r) greater than 0.99.
The selectivity and sensitivity of method was evaluated by analyzing blank plasma and brain homogenate and LLOQ sample (1ng/mL). The MRM chromatograms of blank plasma, brain homogenate, LLOQ sample spiked with compound 27 and ISTD (Figure 4). No endogenous interference was observed at 4.22min for compound 27 and 4.04 min for ISTD. The chromatograph of compound 27 at LLOQ level showed sign-noise ratio above 10.
Figure 4.
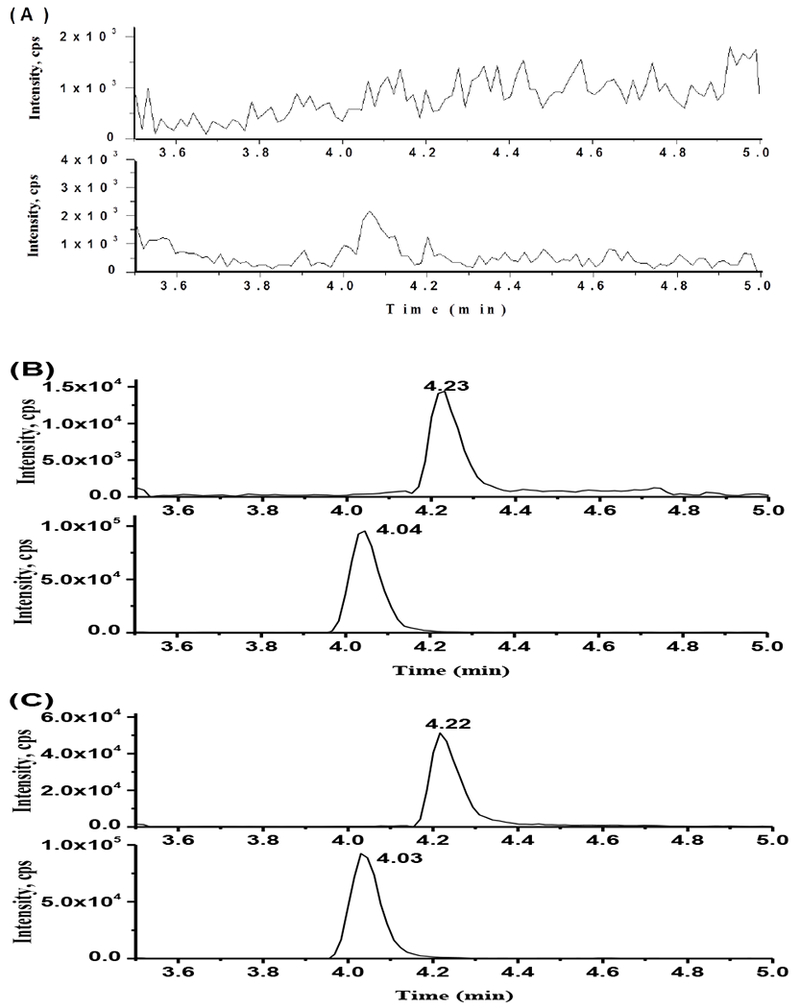
Representative MRM chromatography. (A) MRM of blank mouse plasma and brain tissue; (B) MRM of blank mouse plasma spkied with compound 27 at LLOQ level (1ng/mL) and IS (10ng/mL); (C) MRM of blank mouse brain tissue spkied with compound 27 at LLOQ level (1ng/mL) and IS (10ng/mL).
3.3.2. Matrix effect and recovery
The relative matrix effect and relative extraction efficiency from mouse plasma were evaluated at three levels of concentrations: 3, 25, 160ng/mL. As shown in Table 2, the relative matrix effects at three concentrations are all around 110% indicating minimal matrix effects. The relative extraction efficiency for three concentration levels range from 93% to 102%. The results indicated that the extraction method was efficient enough to meet the requirement of quantification. Due to the limited blank brain homogenate sample, the matrix effect was only evaluated at 3ng/mL and was found to be in the same range of plasma matrix effect (data not shown).
Table 2.
Relative matrix effects and extraction recovery of compound 27 in mouse plasma
| Compound 27 Concentration (ng/ml) | Relative matrix effects | Relative extract efficiency |
|---|---|---|
| 3 | 109.0% | 92.6% |
| 25 | 111.6% | 99.7% |
| 160 | 110.1% | 101.8% |
3.3.3. Precision and accuracy
The intra-assay and inter-assay precision and accuracy were assessed at three concentration levels: 3, 25, 160ng/mL. As shown in Table 3, the precision (%CV) and accuracy (%RE) for all the QC plasma samples were within 15% in the intra-and inter-assays, indicating that the precision and accuracy of this method was effective for the quantitative determination of drug concentration in biological matrices.
Table 3.
Intra-assay and Inter-assay for the quantification of compound 27 in mouse plasma
| Intra-assay (n=5) | Inter-assay (n=5) | |||||
|---|---|---|---|---|---|---|
| Spiked conc. (ng/ml) | Determined conc. (ng/ml)±SD | Precision (% CV) | Accuracy (% RE) | Determined conc. (ng/ml)±SD | Precision (% CV) | Accuracy (% RE) |
| 3 | 2.64 ± 0.03 | 1.1 | −12 | 2.60 ± 0.1 | 3.8 | −13.3 |
| 25 | 22.4 ± 1.89 | 8.4 | −10.4 | 22.6 ± 0.15 | 0.66 | −9.6 |
| 160 | 149 ± 3.74 | 2.5 | −6.9 | 150.6 ± 5.0 | 3.3 | −5.9 |
3.3.4. Stability
The stability of compound 27 in mouse plasma was determined for various storage conditions by measuring the concentrations of compound 27 in QC Samples after storage and comparing the results with the theoretical value. The results of stability assay are summarized in Table 4. There was no significant degradation or loss of compound 27 in mouse plasma after storing at room temperature for 6 and 24h, at −20°C for 30 days, and after three freeze-thaw cycles. Compound 27 was stable in mouse plasma for at least 24 h with the recovery above 90%. The recovery of compound 27 after three freeze–thaw cycles was 87% at LQC and 92.7% at HQC levels. The long-term storage stability for compound 27 at −20°C for 30 days was 85.6% and 90.4 % at LQC and HQC levels, respectively.
Table 4.
Stability test of compound 27 in mouse plasma
| Storage Conditions (n= 3) | Spiked conc. (ng/ml) | Determined conc. (ng/ml)±SD | Recovery (%) |
|---|---|---|---|
| At room temperature for 4 hr | 3 160 |
2.88 ± 0.16 151 ± 5.6 |
96 94.3 |
| At room temperature for 24 hr | 3 160 |
2.76 ± 0.01 151.3 ± 7.8 |
92.0 94.5 |
| Three freeze-thaw cycles | 3 160 |
2.62 ± 0.06 148.3 ± 4.7 |
87.0 92.7 |
| Long-term stability (at −20°C for 30 days) | 3 160 |
2.57± 0.10 144.7 ± 8.5 |
85.6 90.4 |
3.4. Application to pharmacokinetic studies of compound 27
The validated LC-MS/MS method was applied to the measurement of compound 27 in plasma and brain tissue samples from mice after dosing at different time points. A single-dose of 10mg/kg compound 27 in PBS with 10% Cremophor was administered to mice through an intraperitoneal (I.P.) injection or subcutaneous injection (S.C.) route. There were two sets of plasma and brain samples collected to compare the different drug administration routes.
The compound 27 concentrations in plasma and brain tissue to time profile were obtained for both administration routes. The maximum concentration of compound 27 in plasma was 54ng/ml, which was reached at 15min after dosing with I. P. injection. However subcutaneous injection lead to much higher maximum concentration of compound 27 in plasma from 30min to 4h after dosing (Figure 5A and B). The different PK profiles suggest that compound 27 administered by different routes may undergo different level of phase I metabolism. Compound 27 administered by I. P. injection likely undergo more extensive metabolism in mouse liver, leading to lower maximum concentration and shorter half-life in plasma. In both administration routes, compound 27 was detected in brain tissue. The concentration of the drug in brain tissue was about 10-20% of the concentration in blood, suggesting that part of the drug in the blood circulation could pass blood brain barrier and accumulated in brain tissue (Figure 5 C and D). Investigation of the metabolism of compound 27 could provide rational design to reduce or eliminate the phase I metabolism of compound 27 and improve its pharmacokinetic performance.
Figure 5.
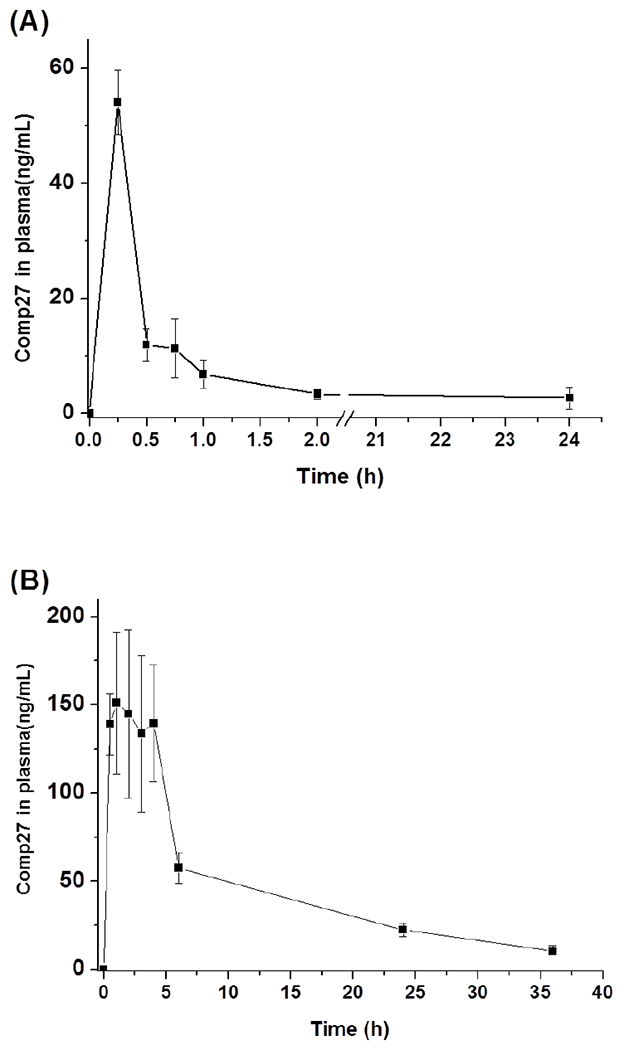
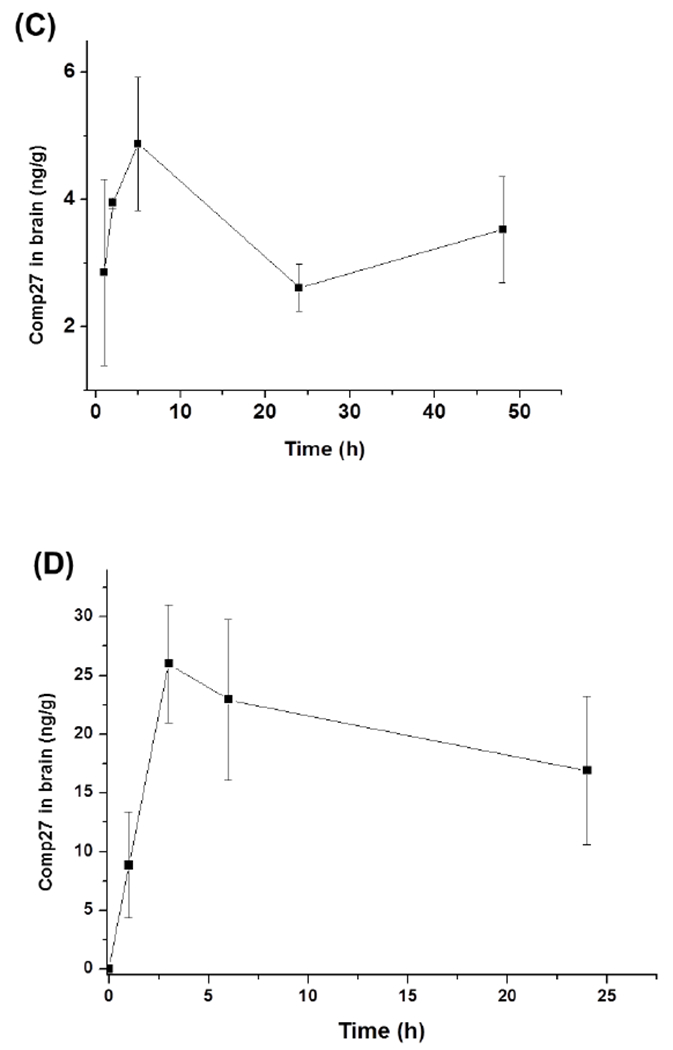
Mean concentration-time profile of compound 27 after the intraperitoneal injection (I.P.) and subcutaneous injection (S.C.) at a single dose of 10mg/kg. (A) I.P. injection plasma drug concentration vs time; (B) S.C. injection plasma drug concentration vs time; (C) I.P. injection brain tissue drug concentration vs time; (D) S.C. injection brain tissue drug concentration vs time. Each point represents the mean ± SD (n=5).
4. Conclusion
A rapid LC–MS/MS method for the quantification of compound 27 in mouse plasma and brain tissue was developed and validated. This method is simple, sensitive and specific for the analysis of compound 27 in biological matrixes. It also demonstrated excellent precision, accuracy, and reproducibility for routine analysis. The LLOQ of this method is as low as 1 ng/mL, showing an excellent signal to noise ratio. A linearity of calibration curve is excellent over the range of 2–200 ng/mL. We have successfully applied this LC–MS/MS method by measuring compound 27 in mouse plasma and brain tissue from a preclinical pharmacokinetic study. This method will be further used in pharmacokinetic studies in the future.
5. Acknowledgements
This work was supported by 1R01NS096956-01(B.W) and National Science Foundation Major Research Instrumentation Grants (CHE-0923398 and CHE-1126384).
6. References
- Astin JW et al. (2010). Competition amongst Eph receptors regulates contact inhibition of locomotion and invasiveness in prostate cancer cells. Nature Cell Biology, 12(12),1194–1204. [DOI] [PubMed] [Google Scholar]
- Biao-xue R et al. (2011). EphA2-Dependent Molecular Targeting Therapy for Malignant Tumors. Current Cancer Drug Targets, 11(9), 1082–1097. [DOI] [PubMed] [Google Scholar]
- Carles-Kinch K et al. (2002). Antibody targeting of the EphA2 tyrosine kinase inhibits malignant cell behavior. Cancer Research, 62(10), 2840–2847. [PubMed] [Google Scholar]
- Duxbury MS et al. (2004). Ligation of EphA2 by Ephrin A1-Fc inhibits pancreatic adenocarcinoma cellular invasiveness. Biochemical and Biophysical Research Communications, 320(4), 1096–1102. [DOI] [PubMed] [Google Scholar]
- Jackson D et al. (2008). A human antibody-drug conjugate targeting EphA2 inhibits tumor growth in vivo. Cancer Research, 68(22), 9367–9374. [DOI] [PubMed] [Google Scholar]
- Li X et al. (2010). Up-regulation of EphA2 and down-regulation of EphrinA1 are associated with the aggressive phenotype and poor prognosis of malignant glioma.. Tumour biology : the journal of the International Society for Oncodevelopmental Biology and Medicine, 31(5), 477–488. [DOI] [PubMed] [Google Scholar]
- McCarron JK et al. (2010). Ephrin expression and function in cancer. Future Oncol, 6(1), 165–176. [DOI] [PubMed] [Google Scholar]
- Miao H et al. (2009). EphA2 Mediates Ligand-Dependent Inhibition and Ligand-Independent Promotion of Cell Migration and Invasion via a Reciprocal Regulatory Loop with Akt. Cancer Cell, 16(1), 9–20. [DOI] [PMC free article] [PubMed] [Google Scholar]
- Miao H and Wang B (2012) . EphA receptor signaling-Complexity and emerging themes. Seminars in Cell and Developmental Biology, 16–25. [DOI] [PMC free article] [PubMed] [Google Scholar]
- Nasreen N, Khodayari N and Mohammed K a (2012) . Advances in malignant pleural mesothelioma therapy: targeting EphA2 a novel approach. American journal of cancer research, 2(2), 222–234. [PMC free article] [PubMed] [Google Scholar]
- Noblitt LW et al. (2004). Decreased tumorigenic potential of EphA2-overexpressing breast cancer cells following treatment with adenoviral vectors that express EphrinA1. Cancer gene therapy, 11(11), 757–766. [DOI] [PubMed] [Google Scholar]
- Pasquale EB (2008). Eph-Ephrin Bidirectional Signaling in Physiology and Disease. Cell, 38–52. [DOI] [PubMed] [Google Scholar]
- Pasquale EB (2010). Eph receptors and ephrins in cancer: bidirectional signalling and beyond. Nature reviews. Cancer, 10(3), 165–180. [DOI] [PMC free article] [PubMed] [Google Scholar]
- Petty A et al. (2012). A small molecule agonist of EphA2 receptor tyrosine kinase inhibits tumor cell migration in vitro and prostate cancer metastasis in vivo. PLoS ONE, 7(8). [DOI] [PMC free article] [PubMed] [Google Scholar]
- Petty A et al. (2018). Design and synthesis of small molecule agonists of EphA2 receptor. European Journal of Medicinal Chemistry, 143, 1261–1276. [DOI] [PMC free article] [PubMed] [Google Scholar]
- Wang B (2011). Cancer cells exploit the Eph-ephrin system to promote invasion and metastasis: tales of unwitting partners. Sci Signal, 4(175), pe28. [DOI] [PMC free article] [PubMed] [Google Scholar]


