



Abstract
The cochlear microphonic, traditionally thought of as an indication of electrical current flow through hair cells, in conjunction with suppressing high-pass noise or tones, is a promising method of assessing the health of outer hair cells at specific locations along the cochlear partition. We propose that the electrical potential recorded from the round window in gerbils in response to low-frequency tones, which we call cochlear response (CR), contains significant responses from multiple cellular sources, which may expand its diagnostic purview. In this study, CR is measured in the gerbil and modeled to identify its contributing sources. CR was recorded via an electrode placed in the round window niche of sixteen Mongolian gerbils and elicited with a 45 Hz tone burst embedded in 18 high-pass filtered noise conditions to target responses from increasing regions along the cochlear partition. Possible sources were modeled using previously-published hair cell and auditory nerve response data, and then weighted and combined using linear regression to produce a model response that fits closely to the mean CR waveform. The significant contributing sources identified by the model are outer hair cells, inner hair cells, and the auditory nerve. We conclude that the low-frequency CR contains contributions from several cellular sources.
1. INTRODUCTION
Hearing loss is one of the most prevalent disorders in the United States and across the globe. Clinical audiologists are often the primary health professionals who diagnose and treat these hearing disorders in the US. Diagnosis includes a battery of tests that help the clinician characterize the hearing loss and locate the site-of-lesion, both of which are crucial to choose an effective treatment for their patients’ individual needs. It has long been known that the audiogram –the diagnostic tool on which clinicians rely most heavily –is inadequate for determining the site-of-lesion of a sensorineural hearing loss (Landegger et al., 2016). In the cochlea, specifically, there are many anatomical structures that if damaged, will result in a hearing loss. Hearing aids or cochlear implants are prescribed to treat most sensorineural hearing losses, but outcomes are highly variable even between patients with similar audiometric patterns. Since there is no universally-effective umbrella treatment for all types of sensorineural hearing loss, it is imperative that diagnostic measures differentiate the possible sites-of-lesion within the cochlea, both spatially and cell-specifically. More sensitive diagnostic measures could spur the development of differentiated hearing-aid technology, more effective cochlear implantation, and research into new treatment methods. More immediately, they could at least provide some predictability of a given patient’s outcome with hearing aids.
Objective measures of cochlear health are promising tools for identifying damage or physiological dysfunction underlying hearing loss. The auditory brainstem response and otoacoustic emissions are widely used to screen for retrocochlear and outer hair cell (OHC) damage, respectively, although presence and threshold of these responses are the only parameters used clinically. Electrocochleography provides a closer look at the peripheral auditory nerve (AN) as well as hair cell responses. Features of the electrocochleogram include the compound action potential (CAP), summating potential (SP), cochlear microphonic (CM), and auditory nerve neurophonic (an alternating current neural potential). The CAP and SP are used in some clinical measures such as the diagnosis of Meniere’s disease, but the CM currently has no clinical applications. The CM is an indication of electrical current flow through OHCs and has shown potential to be developed into a diagnostic measure (Withnell, 2001; Cheatham et al., 2011). Research by Chertoff and colleagues (2012, 2014, 2015), Kamerer et al. (2016), and Charaziak et al. (2017) has provided evidence in rodent models that CM can be used to assess OHCs in a location-specific manner.
The CM reported in these studies are recorded with the primary electrode resting in the round window (RW) niche of the cochlea. Recording from the RW can pose a problem, as high-frequency stimuli will cause maximal displacement of the basilar membrane (BM) in the base of the cochlea proximal to the electrode, resulting in large phase incoherence and reduction in the response amplitude due to cancellations of the response wave (Dallos, 1973; Whitfield & Ross, 1965). This could lead to false diagnoses of damage. A solution is to lower the stimulus frequency, however, this leads to a second problem: the responses from all the OHCs in the cochlea are inversely weighted by their Euclidean distance to the electrode, meaning OHCs residing in the base will overpower responses from OHCs in the apex. This could confound attempts to diagnose the health of OHCs in the apex (Dallos, 1969; Patuzzi et al., 1989). Several studies have developed methods of resolving this issue, using high-pass noise to suppress responses from OHCs outside a targeted region of the cochlear partition (Chertoff et al., 2012b, 2014; Kamerer et al., 2016; Charaziak et al., 2017). A third inherent issue with RW recording is the addition of AN activity in the response (Patuzzi et al., 1989; Henry, 1995; He et al., 2012; Lichtenhan et al., 2014). Indeed, when the AN of the gerbil is damaged with neurotoxins such as ouabain, tetrodotoxin, or kainic acid, the alternating current (AC) portion of the RW responses to tones with frequencies of 500–800 Hz are significantly reduced (Chertoff et al., 2014; Fontenot et al., 2017). Since this response is not purely CM, we heretofore refer to the electrical response from the cochlea recorded from the RW as the cochlear response (CR).
By serially recording the CR to tones embedded in high-pass noise with varying cutoff frequencies, Chertoff and colleagues (2012, 2014) were able to generate a response function which was used to identify areas of OHC damage (Chertoff et al., 2014, 2012). One issue with this response function, termed the ‘cumulative amplitude function’, is its sigmoidal shape. It is impossible to diagnose damage near the apex because of a “dip” in this function. The impetus for the present study was a prior experiment, in which the CR was recorded to near-infrasonic tones (45–85 Hz) to further reduce the neural contribution to the CR and attempt to generate a response function that increased linearly, such that damage to apical regions of the cochlea could be detected (Kamerer et al., 2016). To such low-frequency tones, however, the response waveform is drastically distorted (Fig. 1). These large deflections in the waveform were found to be consistent across animals. The striking distortion visible in the CR waveform, especially at 45 Hz, naturally raised suspicion of an acoustics issue. Delivering such low-frequency tones with high fidelity required a relatively large speaker (9 cm diameter), which, in order to direct into the gerbil ear canal, had to be funneled into a 7 mm-diameter tube. We knew this funneling would cause some amount of filtering of the acoustic stimulus, but were unsure of how this would affect the response. Our hypothesis was that the amount of harmonic distortion found in the animal CR was greater than the expected response to the levels of distortion present in the acoustic stimulus, meaning the distortions were products of nonlinear mechanisms within the cochlea. Of more interest, though, inner hair cells (IHC) –which also contribute to the CR –are out-of-phase with OHCs at low frequencies, which we hypothesized would cause an increase in distortion of the CR waveform. Thus, parsing and quantifying the sources of the low-frequency CR was the aim of this study.
Figure 1.
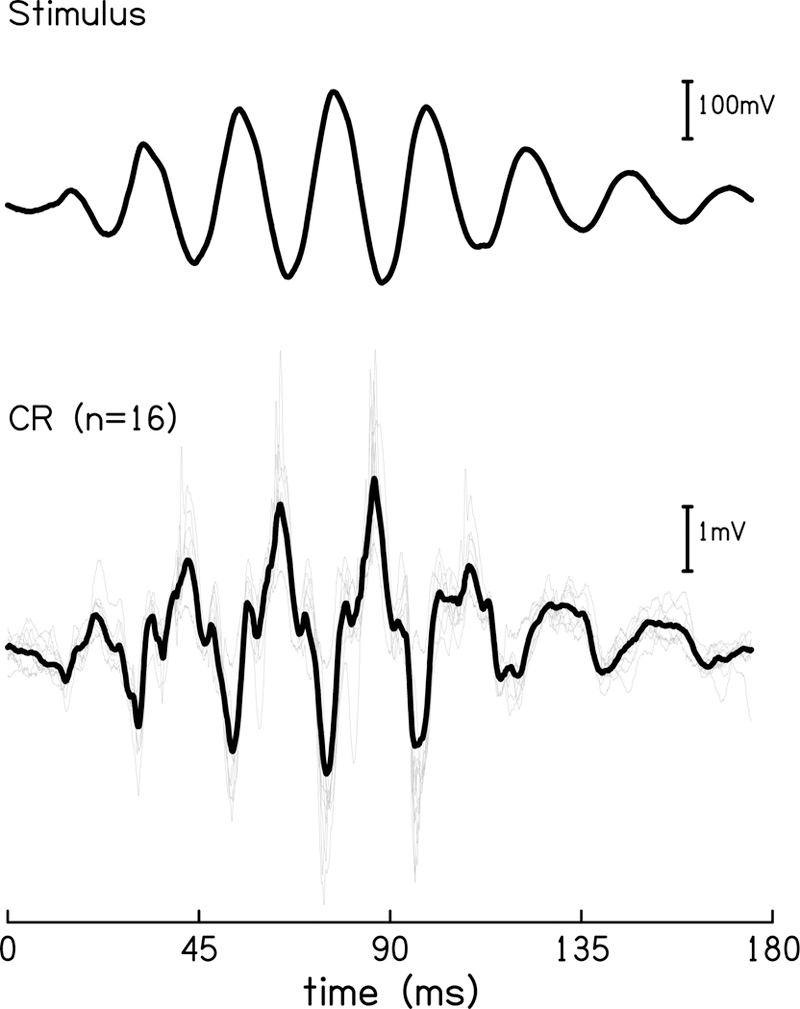
A comparison of the 45 Hz toneburst stimulus recorded at the level of the ear canal (top) and the response in the quiet condition (bottom) from individual animals (grey) and mean response (black).
Location-specificity of these cellular sources is also of interest. In prior experiments high-pass noise was used to mask AN responses and suppress OHC responses to a tone stimulus to target responses from specific regions of the cochlea (Chertoff et al., 2012a, 2014; Kamerer et al., 2016). The cutoff frequency of the noise can be converted to a location on the gerbil cochlear partition, thus providing localized regions of response (Müller, 1996). Cellular structures in the cochlea produce unique patterns of harmonic distortion and phase, depending on location and stimulus conditions. Analysis of both the temporal and spectral components of the low-frequency CR may provide clues as to the cellular sources contributing to response.
The purpose of this study was two-fold. First, to confirm that the rich harmonic distortion in the low-frequency RW response was produced by nonlinear mechanisms in the cochlea, and was not simply due to distortions present in the acoustic stimulus. To test this hypothesis, we employ a strategy identical to what Dallos & Sweetman (1969) used to compare the spatial distribution of harmonics in the CM, in order to show that the generation of the harmonic components were not simply a response to acoustic distortion. Secondly, the sources of the low-frequency CR were estimated with an analytic model. Modeled responses from potential cellular contributors were covariates in a regression model which determined the best fit to the data and quantified each contribution.
2. MATERIALS & METHODS
2.1. Animal Preparation
Sixteen adolescent Mongolian gerbils (Meriones unguiculates) weighing between 40 and 70 g were used for this study. The gerbil model was chosen for its low-frequency hearing sensitivity, allowing for potential translatability of these methods to the human ear. Prior to surgery, animals were sedated with an intraperitoneal injection of pentobarbital (64mg/kg). The animals were laid in a supine position on a stereotactic platform with their front teeth hooked into a head-stabilizing mechanism, and wrapped in a heating blanket (Harvard, Hollistan, MA) to maintain a body temperature of 37° C. Sedation was maintained throughout the experiment with hourly supplemental intramuscular injections of one-third the initial dose and monitored by heart-rate and pulse-oxygen levels every 10–20 minutes (MouseOx, Starr Life Sciences, Oakmont, PA). Following a local injection of lidocaine, the right pinna was removed and a post-auricular incision made to expose the bulla. A pick was used to open a small hole in the bulla over the RW niche, just large enough to insert the electrode and a cotton wick to absorb any condensation and excess fluid. All experiments were acute, in that they were completed on a single animal within several hours followed by sacrifice with three times the initial dose of pentobarbital. All experimental procedures were approved by the University of Kansas Medical Center Institutional Animal Care and Use Committee.
2.2. Generation of Stimuli and Noise
The stimulus used to elicit the CR in this study was a 45 Hz toneburst. The toneburst was generated in BioSig (Tucker-Davis Technologies; TDT) to have a 70 ms duration and 15 ms rise/fall time and was presented at a rate of 5/s to a speaker located outside of a soundproofed chamber. The 9 cm-diameter speaker was coupled to a 7-mm diameter tube which entered the chamber and terminated at the animal’s external auditory meatus. The tube was 1.9 m long to facilitate resonance of the 45 Hz stimulus and reduce acoustic distortion and electrical artifact. A noise paradigm identical to that used in Kamerer et al. (2016) was used to target responses from regions of the cochlea. The noise paradigm was a series of broadband noise filtered with seventeen high-pass cutoff frequencies, generated by a real-time processor (TDT, RZ6). The seventeen noise conditions, from lowest to highest cutoff frequency were as follows: 0.146, 0.378, 0.740, 1.3, 2.2, 3.7, 5.9, 7.5, 9.5, 12, 15, 19, 24, 30, 38, 48, & 60 kHz. The high-pass noise was delivered simultaneous to the stimulus by a separate speaker placed approximately 3 mm from the ear canal (TDT, MF1). The frequency response of the speaker was flattened from 0.1–60 kHz via an FIR filter. A ¼ inch Bruel and Kjaer microphone was suspended within several millimeters of the ear canal and the end the speaker tube. The frequency sensitivity of the B&K microphone is flat (+/− 2 dB) from 0.02–100 kHz when positioned at a 90° azimuth relative to the sound source. The microphone output was routed to an oscilloscope (Tektronix, TDS 2014) to calibrate the peak sound pressure level of the toneburst stimuli.
For the analysis of the response to acoustic distortion in the stimulus the 45 Hz toneburst was recorded at 90 dB SPL (10 dB higher than the level used to elicit responses in this study) at the level of the ear canal –i.e. after passage through the funneling delivery apparatus –with the B&K microphone. The stimulus time-domain signal was converted to the frequency domain using the Fast-Fourier Transform (FFT) and the magnitude of the peaks of the first two harmonics, F2 and F3, were measured. Each of these harmonics found in the 45 Hz stimulus were used to create two individual toneburst stimuli (90 and 135 Hz) that were presented at the corresponding levels measured within the 90 dB SPL original acoustic stimuli (50 and 47 dB SPL, respectively).
2.3. Physiologic Recordings
CAPs were first recorded from all animals to check for hearing loss prior to recording the CR. Compound action potentials were evoked with 1, 2, 4, 8, 16, and 24 kHz alternating-polarity tonebursts with 1 ms rise/fall times and an 8 ms plateau (10 ms duration). Each frequency was presented 50–500 times at 21.1/s starting at 100 dB SPL and descending in 5 dB steps until threshold was reached. The number of presentations varied depending on the stability of the response. Threshold was determined online by agreement of two observers of the CAP waveforms. The CAP tonebursts were presented from the same speaker used to present the noise for the RW response experiments (TDT, MF1) and sound pressure levels were calibrated using the B&K microphone.
The CR and CAPs were recorded via a ~1 mm diameter silver-wire ball electrode, placed with a micromanipulator device into the RW niche of the exposed bulla. A needle electrode placed in the neck muscle served as a ground. The CR was recorded to 45 Hz tonebursts presented at 80 dB SPL, amplified 50x (Stanford), sampled at 200 kHz (TDT, RZ6), filtered from 0.03–30,000 Hz, amplified a second time (100x), and low-pass filtered from 3 kHz (Stewart). The CR was averaged over 50 recordings at each noise condition and each noise condition was recorded three times per animal, for an averaged CR of 150 recordings per noise condition. The CR in quiet was recorded three times throughout the noise paradigm for reliability for a total of 400 recordings in quiet per animal.
2.4. Procedures
Once the animals were sedated and the bulla opened, CAPs were recorded to determine normal hearing sensitivity and the CR was recorded in healthy animals. The noise conditions were recorded in order of lowest cutoff frequency to highest and with three CR recordings in the quiet condition as well. All noise conditions were recorded from each of the sixteen animals. For the analysis of acoustic distortion, the CR to the two harmonic tonebursts at 90 and 135 Hz were recorded in one animal immediately preceding the recording to the 45 Hz stimulus. All three CR recordings were completed for all noise conditions in the same manner as described above.
2.5. Regression Analysis
Four cellular sources were simulated and included as covariates in an additive model of the CR in gerbils. A linear regression model was implemented to determine which covariates were significant to successfully model the measured low-frequency CR data. The final model is shown below,
| (1) |
where CR is the mean cochlear response amplitude (V; n = 16), OHCr and IHCr are simulated outer and inner hair cell response amplitudes (V), ENV is the stimulus envelope (V), and AP is the simulated neural phase-locking action potential amplitude (V), at any given moment in time. There was no significant correlation of the covariates with each other, supporting an assumption of linear independence.
The input to the CR model was the 45 Hz stimulus, recorded at the level of the ear canal at 80 dB SPL (Fig 1). The stimulus waveform (S) was manipulated in order to provide the appropriate stimuli for both inner and outer hair cells. The waveform was differentiated once to simulate the BM response to stapes footplate velocity (S′), which is the input for OHCs (Dallos & Durrant, 1972). Because there is a small amount of distortion in the stimulus itself, the differentiated stimulus was smoothed over a 200 point (1 ms) moving average to eliminate falsely-exaggerated distortion, and rescaled to 0.2 Pa (80 dB SPL). Although not all data can be explained by a direct relationship between BM displacement and IHCs, the traditional and most proven input to IHC is acceleration of the stapes footplate (or velocity of BM displacement; Steele & Puria, 2005; Fridberger et al., 2006; Guinan, 2012). To simulate this, the stimulus was twice differentiated, smoothed, and rescaled to model the input for IHCs (S′′).
2.5.1. OHCr & IHCr –Hair cell responses
The model hair cell responses (OHCr & IHCr) were generated from intracellular recordings of guinea pig hair cells published by several research groups. First-order Boltzmann functions were fit to each data set:
| (2) |
Where x is the input stimulus (Pa) and the coefficients a-d were determined by linear regression (Table 2). Once the real data functions were determined, they were evaluated with the appropriate 45 Hz tone-burst stimulus:
| (3) |
where S is the stimulus recorded at the level of the ear canal. Six hair cells were recreated in total, three IHC and three OHC. Each published data set was different, which is why they were all included in this study. The Boltzmann functions fit all six data sets well (R2 > 0.99, see Table 2). OHC recreations are shown in Fig. 2 (left). One fTr was recorded from an apical OHC with a low characteristic frequency (OHCLF) whose response was elicited by an 800 Hz tone (Fig. 2a; Dallos, 1986). Two fTr were recorded from basal OHCs (OHCHF) elicited by 600 Hz tones (Fig. 2c & e; Russell et al., 1986; Cody & Russell, 1987). IHC recreations are shown in Fig. 3 (left). Two fTr were recorded from apical IHCs (IHCLF) elicited with 800 and 700 Hz tones (Fig. 3a & c; Dallos, 1986; Dallos & Cheatham, 1989). One fTr was recorded from a basal IHC (IHCHF) elicited by a 600 Hz tone (Fig. 3e; Russell et al., 1986). The notable differences in the data between the groups are 1) the residing location of the cells, i.e. HCHF v HCLF; 2) the maximum amplitude of the hair cell outputs, e.g. Fig 2a versus 2c; 3) the slope of the linear portion of the function, which corresponds to varying degrees of compression, e.g. Fig 3a versus 3e; and 4) the symmetry of the functions, e.g. Fig 2c versus 2e.
Table 2.
Coefficients and 95% confidence intervals for parameters of Eq. 2
| a (dimensionless) |
b (Pa/V) |
c (V) |
d (dimensionless) |
R2 | |
|---|---|---|---|---|---|
| OHCLF-800Hz | 0.0445 (0.0207, 0.0682) |
−0.047 (−0.0661, −0.0279) |
0.0152 (0.0127, 0.0176) |
−0.00428 (−0.0058, −0.0029) |
0.995 |
| OHCHF-600Hz* | −0.0202 (−0.0509, 0.0105) |
0.1148 (0.0874, 0.1422) |
−0.00937 (−0.0102, −0.0085) |
0.00424 (0.00368, 0.0048) |
0.995 |
| OHCHF-600Hz** | −0.2786 (−0.3478, −0.2094) |
0.239 (0.1772, 0.3007) |
−0.01071 (−0.0118, −0.0096) |
0.0027 (0.002, 0.0033) |
0.995 |
| IHCLF-800Hz | 0.009 (−0.0003, 0.0183) |
−0.0123 (−0.0206, −0.004) |
0.028 (0.0229, 0.0332) |
−0.009 (−0.0125, −0.0054) |
0.992 |
| IHCLF-700Hz | 0.0825 (0.0661, 0.0988) |
−0.0511 (−0.0642, −0.0381) |
14.61 (13.56, 15.67) |
−2.218 (−2.85, −1.587) |
0.994 |
| IHCHF-600Hz | 0.3654 (0.332, 0.3989) |
0.1881 (0.1604, 0.2159) |
−0.0171 (−0.018, −0.0162) |
0.0151 (0.0143, 0.0158) |
0.999 |
OHCHF-600Hz from Russel, Cody, Richardson (1986)
OHCHF-600Hz from Cody & Russell (1987)
Figure 2.
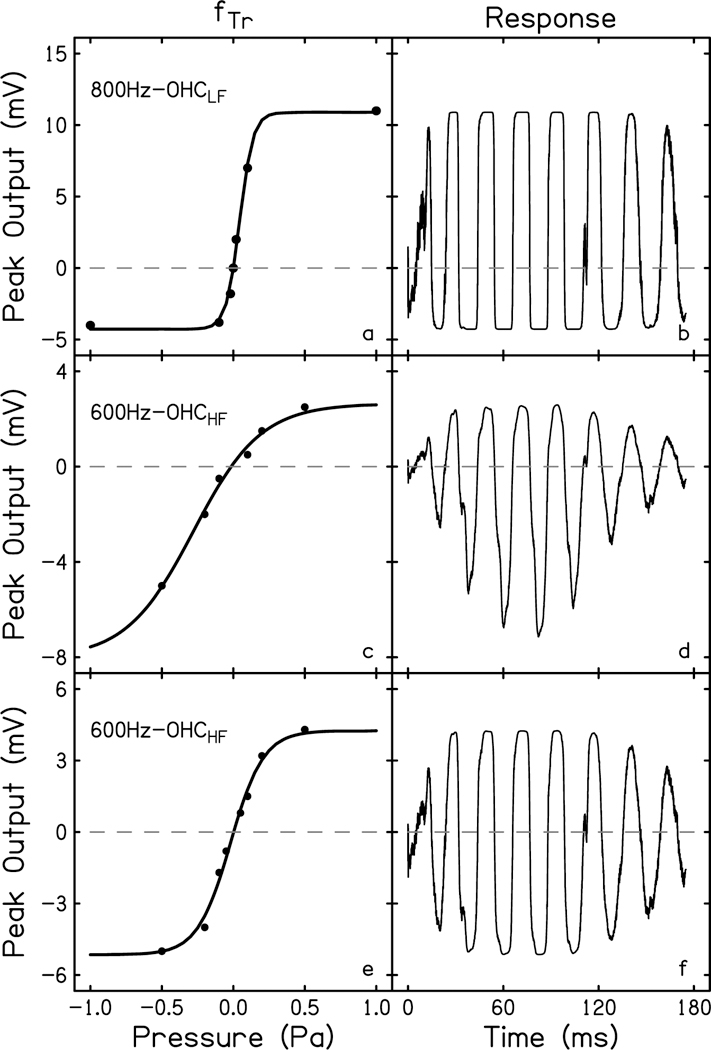
Transducer functions for outer hair cells (a, c, e) recreated from data recorded from an apical OHC stimulated with an 800 Hz tone (800Hz-OHCLF; Dallos, 1986), and two basal OHCs stimulated with an 600 Hz tone (600Hz-OHCHF; Cody & Russell, 1987; Russell et al., 1986). Data points from these publications are represented by filled circles. A first-order Boltzmann equation fit to each transducer function (fTr)was solved using the derivative of the recorded 45 Hz, 80 dB SPL stimulus. The resulting simulated response waveforms for each hair cell are plotted to the right of their respective transducer curve (b, d, f). The dashed line is at amplitude = 0, to illuminate asymmetries in the transducer curves and the resulting DC shift in the response waveform.
Figure 3.
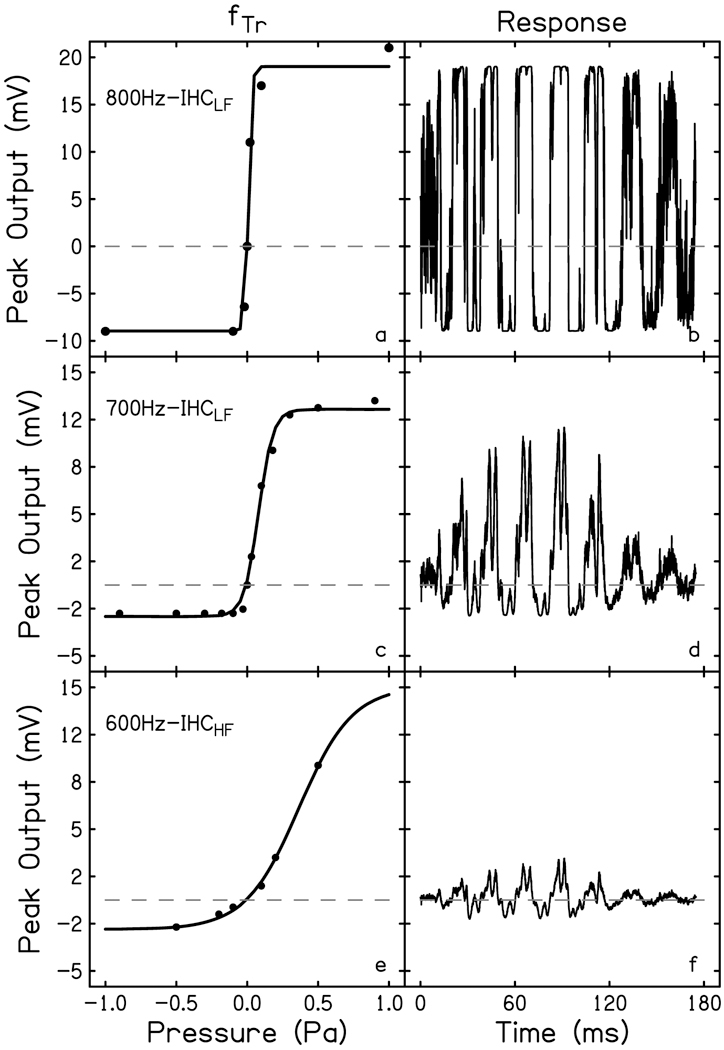
Transducer functions (fTr) for inner hair cells (a, c, e) recreated from data recorded from an apical IHC stimulated with an 800 Hz tone (800Hz-IHCLF; Dallos, 1986), an apical IHC stimulated with a 700 Hz tone (700Hz-IHCLF; Dallos & Cheatham, 1989), and a basal IHC stimulated with a 600 Hz tone (600Hz-IHCHF; Russell et al., 1986). Data points from these publications are represented by filled circles. A first order Boltzmann equation fit to each transducer curve was solved using the second derivative of the recorded 45 Hz, 80 dB SPL stimulus. The resulting simulated response waveforms for each hair cell are plotted to the right of their respective transducer curve (b, d, f). The dashed line is at amplitude = 0, to illuminate asymmetries in the transducer curves and the resulting DC shift in the response waveform.
Figure 4.
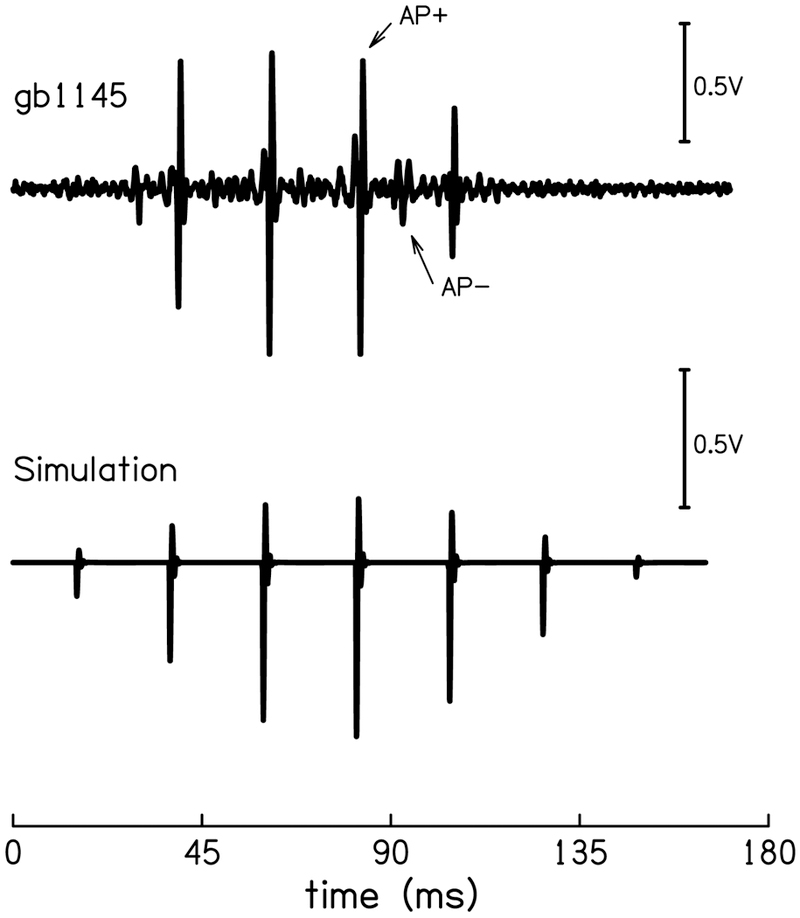
The CR waveform of one animal high-pass filtered at 300 Hz (top). The most prominent APs are located at ± 0.707(peak) for each cycle of the waveform (AP+ & AP−). AP+ was simulated (bottom) to include in the regression model.
To generate the simulated hair cell time-waveform responses, Eq. 3 was evaluated using derived stimuli (S′ & S′′) for each hair cell. The results are shown in Figs. 2 & 3 (right). Here, one can see the relationship between the symmetry of the transducer functions and the direct current (DC) shift in the resulting response waveform. The greater the asymmetry between depolarization and hyperpolarization of the hair cell, the greater the DC shift, e.g. the negative peaks have a greater absolute amplitude than the positive peaks, exemplified by the OHC in Fig. 2d. The other two OHC transducer functions that are more symmetric yield response waveforms whose positive and negative peaks are more or less equal in amplitude. The slope of the transducer function will determine the steepness of the compressive, or saturating, portion of the curve; a steeper function will saturate more sharply whereas a shallow slope may also have a shallower compression. The differences in the positive peaks of the OHC response waveforms in Fig. 2 (right) exemplify how a hair cell response will change morphologically and distort depending on the portion of the fTr excited by the stimulus. In Fig. 2e the 0.2 Pa (80 dB SPL) stimulus elicits a response from the linear portion of the transducer curve. This results in a response waveform (Fig. 2f) that does not show peak clipping, compared to the peaks of Fig. 2b which show a significant amount of clipping due to the stimulus eliciting a response from the saturated portion of the transducer curve (Fig. 2a).
2.5.2. ENV –Envelope-Following Response.
In the mid-cutoff frequency conditions (2.2–24 kHz) of the high-pass noise there is a large low-frequency bias to the CR waveform, calculated to be ~3 Hz, which effectively follows the envelope of the toneburst stimulus. The envelope-following response (ENV) for the regression model was simulated by calculating the absolute values of the Hilbert transform of the derivative of the stimulus (S). The possible origins of this envelope-following response will be discussed later.
2.5.3. AP –Phase-locked Auditory Nerve Response.
A unique feature of the low-frequency CR distinguishable from higher-frequency (>150 Hz) CR, are the visually-apparent action potentials (AP) that ride consistent phase-locations of the response waveform. These APs are likely from small populations of nerve fibers and are therefore technically compound action potentials, but we will refer to them as APs to avoid confusion with the large CAP seen in higher frequency ECochG measures. These APs can be isolated by high-pass filtering the CR waveform at 300 Hz. Figure 4 (top) is an example of this filtered waveform from one animal. The APs consistently appear in the noise conditions as well. The AP wavelets were visually identified and agreed upon by three independent observers, using the following characteristics as guidelines: a wavelet 1) is biphasic as characterized by recording with extracellular electrodes, 2) has a frequency of ~1 kHz, 3) is periodic, in that it occurs regularly along the CR wave cycle (e.g. every ~22 ms) and 4) is maintained across high-pass noise conditions, i.e. once above threshold, remains in the same time location without jitter.
Although most animals showed numerous phase-locking AP wavelets, there were two regular AP wavelets that were identified across all animals: One wavelet occurred at a 90° phase lag (AP+) and one at a 90° phase lead (AP-) on the CR waveform, i.e. on the positive and negative slopes of the waveform at ~|.707| peak amplitude (Fig. 4 arrows). The AP+ created a neural spike train, which heretofore we consider a ‘pulse-train’, which contains energy at the fundamental frequency (45 Hz) and all harmonics. The combination of AP+ and AP− created a pulse-train with energy at two times the stimulus frequency (90 Hz) and all its harmonics (180, 270 Hz, etc.). These pulse-trains were simulated to make the AP covariate for the model. The AP pulse-trains were created by exponentially filtering a 1 kHz sine wave to make a wavelet and repeating that wavelet at the appropriate frequencies for AP+ or AP +/− combined, beginning with a time delay such that the first pulse initiated at a 90° phase lag to the CR waveform. The pulse-train was then filtered with a Hann window to mimic the measured AP pulse-train. The finalized covariate for AP including only AP+ is shown in Fig. 4 (bottom).
3. RESULTS
3.1. Acoustic analysis
The FFTs of the animal’s CR to 45 Hz were compared to the spectrum of the stimulus (Fig. 5). The amplitude of the F2 and F3 harmonics present in the CR (Fig. 5 bottom, dashed lines) were measured for each noise cutoff frequency and compared to the amplitude of the response to the two tonal stimuli of the same frequency presented at the peak sound pressure levels within the 45 Hz acoustic stimuli (Fig. 5 top). The amplitudes of all responses from this animal are plotted in Figure 6 as a function of cutoff frequency of the high-pass noise. The functions show the growth of the measured harmonics as more of the cochlea becomes available to respond with increasing cutoff frequency. The blue and red lines in Figure 6 represent the harmonics found within the CR to a 45 Hz 80 dB SPL stimulus. The grey lines represent the response to those frequencies played at levels found in the 45 Hz 90 dB SPL acoustic stimulus. It is clear that harmonic distortion found within the 80 dB SPL 45 Hz cochlear response is much greater than the responses to the tones of the same frequency, even when presented at levels higher than those found in the stimulus used in the regression model.
Figure 5.
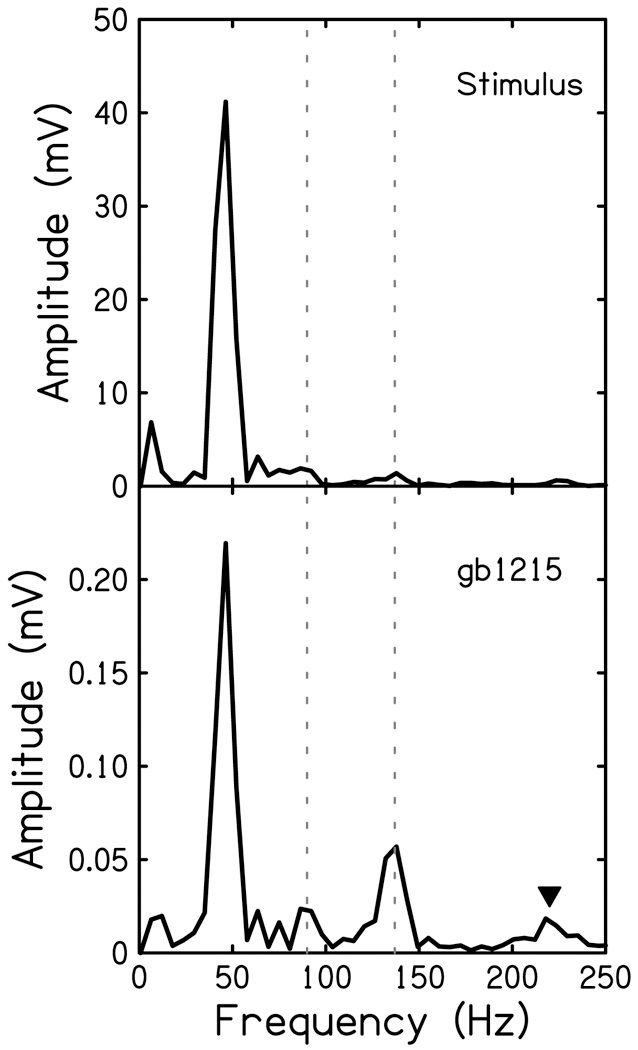
FFTs of the stimulus recorded at the level of the ear canal (top) and CR of one animal (bottom). The second and third harmonics were measured as the magnitude of the peak at 90 and 135 Hz (dashed lines). Triangle indicated 225 Hz.
Figure 6.
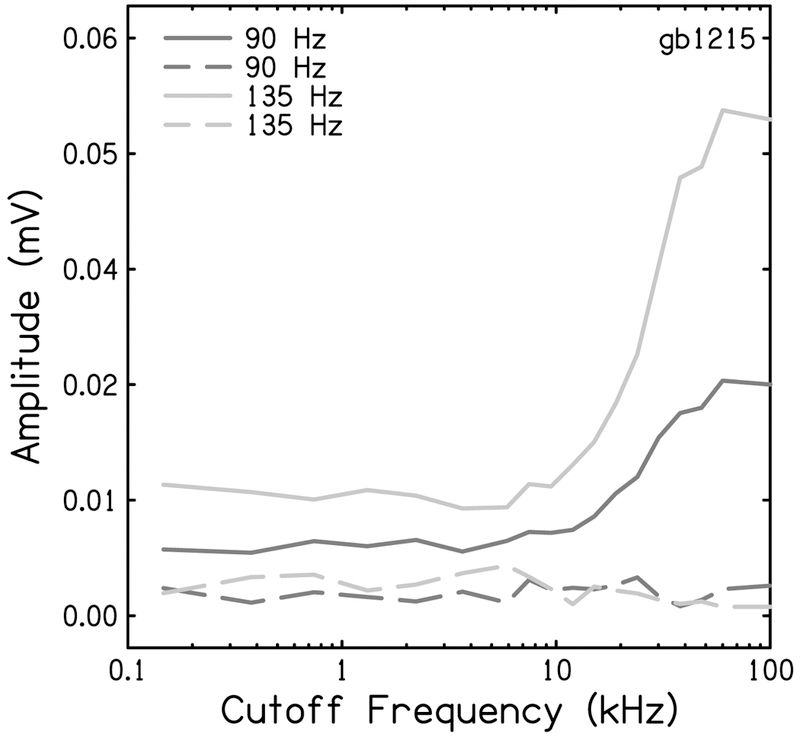
Magnitudes of 90 Hz (blue) and 135 Hz (red) peaks in the FFT of the CR to 45 Hz, 80 dB SPL toneburst as a function of high-pass noise cutoff frequency. These ampltidues were compared to the magnitudes of peak responses at 90 Hz to a 90 Hz, 50 dB SPL toneburst (dark grey) and 135 Hz to a 135 Hz, 47 dB SPL (light grey) toneburst.
3.2. Model
The regression model in Eq. 1 was implemented to estimate the coefficients of the model covariates and determine their significance to the model, with the intent of identifying the contribution of each cellular response to the 45 Hz CR.
3.2.1. Comparison of hair cell data sets
There were three simulated hair cell responses each for inner and outer hair cells. The R2 values of model fit using each possible pair of IHCr and OHCr are displayed in Table 1. Two R2 values are reported for each pair: one for the CR in the quiet condition and the second for the high-pass noise condition with the cutoff frequency of 3700 Hz. This noise condition was chosen for its large morphological deviation from the waveform in quiet: features which include a large positive low-frequency bias and distortions equal to that of the fundamental frequency component (Fig. 7). The best pair to use in the final model was determined via R2, or model fit to the real data. The model that best fit the CR for both the quiet and noise conditions included 800Hz-OHCLF from Dallos (1986) and the 600Hz-IHCHF from Russell, Cody, and Richardson (1986; R2 = 0.81 & 0.70 for quiet and high-pass noise, respectively).
Table 1.
The R2 values of the regression model fit to the real 45 Hz, 80 dB SPL cochlear response using each combination of possible simulated inner (IHCr) and outer hair cells (OHCr). The bolded values indicate the best fit and two hair cells used in the final model.
| OHC | |||||||
|---|---|---|---|---|---|---|---|
| 800-OHCLF |
600-OHCHF |
600-OHCHF |
|||||
| quiet | noise | quiet | noise | quiet | noise | ||
| 800-IHCLF | 0.68 | 0.70 | 0.65 | 0.63 | 0.67 | 0.65 | |
| IHC | 700-IHCLF | 0.76 | 0.70 | 0.76 | 0.63 | 0.77 | 0.65 |
| 600-IHCHF | 0.81 | 0.70 | 0.79 | 0.63 | 0.80 | 0.65 | |
Figure 7.
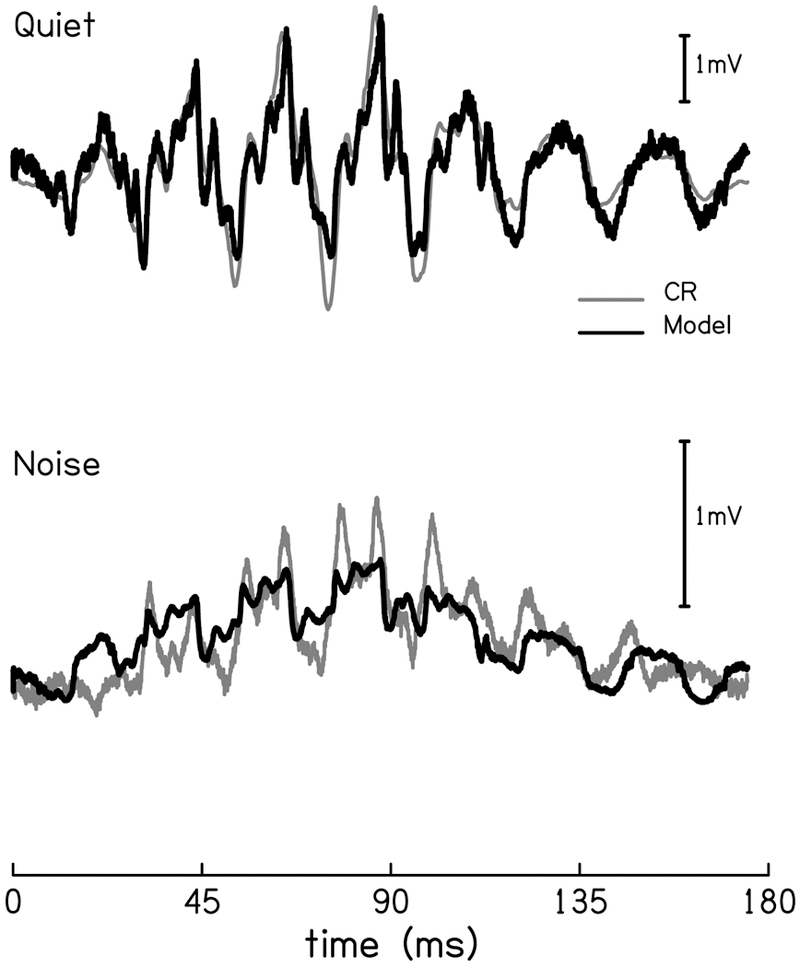
The mean CR waveform (black) compared to the model waveform (red) in both quiet (top) and high-pass noise with a cutoff frequency of 3700 Hz (bottom).
Using these two hair cells, all covariates (OHCr, IHCr, ENV, & AP) were significant across all noise conditions (p < 0.001). Figure 7 compares the mean CR (black) and model waveforms (red) for the quiet condition (top) and the 3700 Hz high-pass noise condition (bottom). Morphologically the fitted function did an excellent job of modeling the real data, including the distortions. In the noise condition the model fit the data well, with the exception of several peak amplitudes that were not fulfilled by the model.
3.2.2. Effects of noise
To examine the effect of noise on the model covariates, the initial peak amplitude of each covariate was multiplied by the estimated coefficient at each noise cutoff frequency (Fig. 8). The initial peak amplitudes were 10.9 mV for the OHCr, 3 mV for the IHCr, and 1 V for the ENV. It is important to note that there were positive DC shifts in the hair cell responses and a negative DC shift in the AP pulsetrain. The peak-to-peak amplitudes, therefore, were 15.2 and 4.3 mV for the OHCr and IHCr, respectively, and 872 mV for AP. The negative peak amplitude of AP was - 637 mV.
Figure 8.
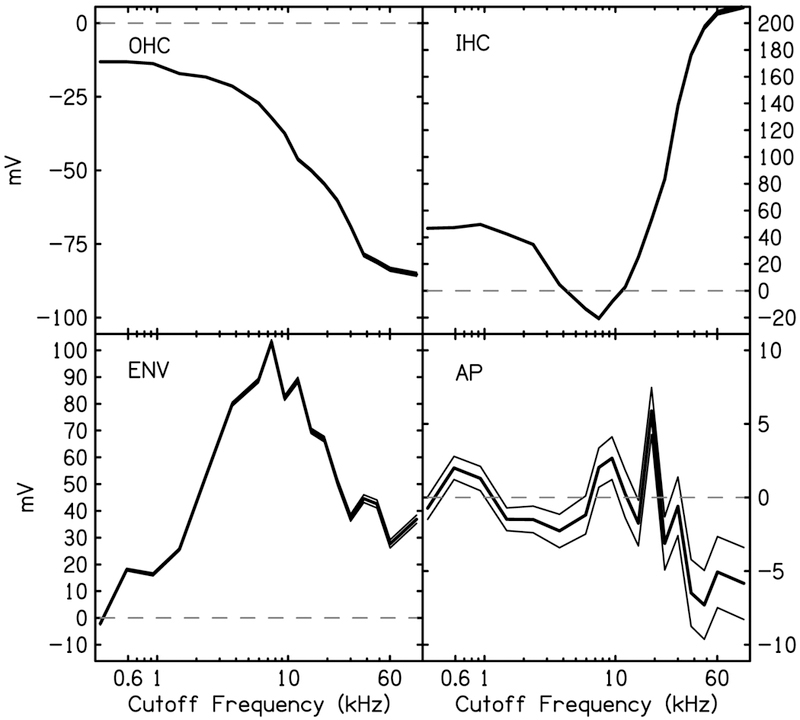
Estimated contributions (thick solid line) and 95% CI (thin solid lines) of the four model covariates as a function of high-pass noise cutoff frequency. Contributions are the product of the initial peak amplitude (V) and the estimated coefficients (β). Dashed lines indicate zero line.
It is interesting to compare the shape of the growth functions of the two hair cell covariates, as well as the sign and sign changes of covariate value within a hair cell. The coefficients for OHCr were negative, resulting in a negative peak value of the covariate. We interpret this as requiring a 180° phase shift to the OHCr in order to fit the data. The growth function for IHCr is sigmoidal in shape, suggesting the contribution of this covariate as a function of noise cutoff frequency is nonlinear. Furthermore, unlike the OHCr function, the IHCr function changes sign twice, which, if sign can indeed be interpreted as phase, would indicate two phase reversals in the IHCr as the cutoff frequency of the noise increases. The amount of each hair cell needed for a model of the CR changes with noise cutoff frequency. At low cutoff frequencies, where the apex of the cochlea is hypothesized to dominate the CR, the inner and outer hair cell covariates are out-of-phase and IHCr is > 2 times the amount of OHCr. Around a noise cutoff frequency of 4 kHz, the IHC covariate contribution is negligible and the OHCr coupled with a large envelope-following response (ENV) dominates the CR.
The ENV growth function remains positive in value and follows a linear upward trend, peaking at the 6000 Hz cutoff frequency, then sloping downward. The relation between this covariate and the data can be seen by comparing this growth function to how much this positive bias can be seen in the CR waveforms in several noise conditions (compare the quiet and noise waveforms in Fig. 7). It is interesting to note that the maximum peak value of ENV coincides with the minimum peak amplitude of IHCr. The phase-locked action potentials (AP) have a peak amplitude of approximately 5 mV.
3.2.3. Generating a cumulative amplitude function
The purpose of the noise paradigm is to localize responses to target regions of the cochlea. The high-pass cutoff frequency of the noise in each of the eighteen conditions can be converted to distance from the apex on the gerbil cochlear partition (Müller, 1996). Plotting the magnitude of the fundamental frequency component of the CR as a function of distance from the apex, results in an increasing response amplitude culminating at a maximum when all of the cochlea is available to respond, i.e. the quiet condition. The magnitude of the 45 Hz peak at each noise condition is normalized to the magnitude in the quiet condition. The normalized values plotted as a function of distance from the apex is called the cumulative amplitude function (CAF). Chertoff and colleagues (2014) used the CAF to predict location of OHC loss in gerbil ears damaged with noise or laser light. The CAF was able to predict the onset of OHC damage down to the millimeter (r = 0.7). The CAF may therefore be a measure of cochlear health. The CR model created in this study was also used to generate a model CAF. Only the IHCr and OHCr covariates were included because they are the only significant sources that contain the fundamental frequency (inclusion of the AP did not add anything to the model). The 45 Hz component of each covariate was considered as the complex number of the 45 Hz peak in the FFT. The complex number, containing both magnitude and phase, was multiplied by the covariates’ corresponding regression coefficient at each noise cutoff frequency. The magnitude and phase of IHCr and OHCr at each noise condition was summed. The magnitude is plotted as a function of distance from the apex (corresponding to each noise condition), resulting in a model CAF (Fig. 9 top, solid line). The phase was also extracted from the model and fit to the measured CAF phase data (Fig 9 bottom). The model visually captured the sigmoidal shape of the data of the eighteen animals (Fig. 9 dots), however there is discrepancy in the location of the ‘dip’ in the function.
Figure 9.
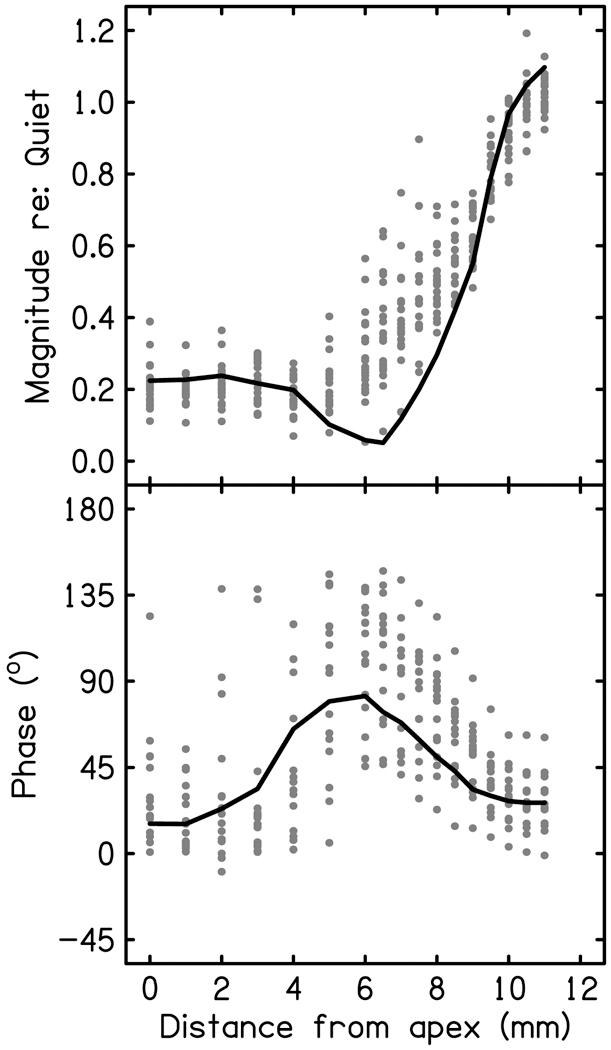
The estimated 45 Hz, 80 dB SPL CAF using the magnitude and phase of the 45 Hz component from the OHCr and IHCr covariates (solid line) plotted alongside the real data from all animals (n=16).
4. DISCUSSION
The purpose of this study was to model the low-frequency CR with the intent of identifying and quantifying probable cellular sources. The linear regression model fitted simulated cellular sources to the mean gerbil CR waveform to a 45 Hz tone presented at 80 dB SPL. This included responses from hair cells, a stimulus envelope following response, and phase-locked apical AN responses. Linear regression analysis found all of these sources to be significant contributions to the model of the 45 Hz CR and these four sources were able to explain many features of the real data. Additionally, the IHCr and OHCr covariates modeled the 45 Hz CAF fairly well in both magnitude and phase.
4.1. Acoustic analysis
The acoustic analysis suggests the large harmonic distortions seen in the 45 Hz CR are generated by nonlinear mechanisms within the cochlea, as expected, and not simply responses to distortion in the acoustic stimulus. This experiment was originally performed by Dallos & Sweetman (1969) where input-output functions of OHCs with various characteristic frequencies were probed with pure tones and their harmonic components in order to prove nonlinearity of the hair cell response.
4.2. Sources of the low-frequency cochlear response
The evidence, per the results of the regression analysis, suggests that the sources of the 45 Hz CR in the gerbil include OHC, IHC, and the AN. An OHC response was a significant covariate in the model of both the waveform and the CAF. This comes as no surprise as it aligns with the majority of the literature suggesting that the response to a tone recorded at the RW is comprised primarily of the CM (Patuzzi et al., 1989). In the 1970’s, Dallos and colleagues compared CM recordings from inner and outer hair cells and determined that OHCs are the dominating contributor to the CM (Dallos et al., 1972; Dallos, 1973; Dallos & Cheatham, 1976). While IHC do contribute to the CM, they are typically in-phase with OHCs and therefore are indistinguishable from each other. However, under the right conditions the IHC response can be well-represented.
The low-frequency CR at 45 Hz contains phase-locked action potentials on both positive and negative slopes of the waveform. This phenomenon has also been shown by Ruggero, Robles, & Rich (1986) in the chinchilla. When recording the RW potentials to stimulus frequencies < 100 Hz, they noticed APs superimposed at phase-locked locations on the positive and negative cycles of the CM. Based on synchrony and single-unit responses, they were determined to originate from two populations of AN fibers: with AP+ the massed responses of apical AN, and AP− the massed responses of basal AN. High-pass filtering of the waveform revealed that there may be even more action potentials at other phases of the waveform as well, though much smaller and wider, indicative of summed responses from smaller neural populations and/or populations with poorer phase-locking ability. Ruggero and colleagues also noted these smaller potentials in the chinchilla, but did not directly analyze them. We referred to these APs earlier as a pulse-train. A pulse-train will generate spectral energy at 1/T, or the period between pulses, equal to either the fundamental frequency if the APs follow one phase of the waveform (such as AP+) or twice the fundamental when following two phases of the waveform (AP+ and AP-); and equal energy at the intervals n/T, or all harmonics. In the case of 45 Hz, a pulse-train locked to one phase of each cycle results in equal energy at 45, 90, 135 Hz, and all higher-order harmonics. In the model of a pulse-train with APs on both the positive and negative slopes of the CR waveform, an FFT showed energy at 90, 180, 270 Hz, and higher order harmonics. However, no feasible amplitude of this pulse-train could equal the amount of second harmonic seen in the CR waveform. This is interesting because to higher frequencies in the phase-locking range the second harmonic is largely dominated by neural, not hair cell, potentials (Forgues et al., 2014; Lichtenhan et al., 2014).
Another significant covariate in the model was the envelope-following response. In response to tonal stimuli, hair cells produce an AC response that reflect the displacement pattern of the BM; this is the CM. They also produce a DC response which follows the stimulus envelope (Tasaki et al., 1954). Since this is a DC product of an AC stimulus, it is inherently a distortion product due to nonlinearities in the hair cells, and thought to be a distortion-product of the CM response itself (Whitfield & Ross, 1965; Johnstone et al., 1966; Davis, 1968; Engebretson & Eldredge, 1968; Honrubia & Ward, 1969). While the AC response from IHCs has not been well-recorded in extracellular potentials like the CR, the DC response of IHCs is largely attributed to the SP recorded in electrocochleography (Zheng et al., 1997). At low stimulus levels and frequencies, the IHC produces a large depolarizing bias relative to hyperpolarization, resulting in a positive DC component, while OHCs produce a larger hyperpolarizing bias resulting in a negative DC component (Dallos, 1985a). The ENV covariate that simulates a large positive shift in the CR data in noise at mid-cutoff frequencies would align with an IHC source.
The morphology of the CR comes from frequency components (i.e. distortions) not in the acoustic stimulus. Outer hair cells driven to saturation by high stimulus levels will produce odd harmonics if their transducer curve is symmetric. Indeed, there was significant amount of F3 and F5 (Fig. 5 triangle) in the low-frequency CR (Fig. 5 dashed line at 135 Hz). Spectral analysis of the response also reveals a significant even harmonic contribution to the low-frequency CR (Fig. 5, dashed line at 90 Hz), not seen at stimulus frequencies > 150 Hz (data not shown). There are several possible sources of the even-order harmonics in the CR: OHCs, IHCs, and the apical AN. The linear regression model provided the evidence for this source to be IHC. The possibility of the low-frequency CR to be comprised entirely of OHC or AN can be ruled out for several reasons:
Outer hair cells can produce even-order harmonic distortion when they have asymmetric transducer curves. This can occur when there is a shift in the operating point (or the output of the cell at rest, i.e. when there is 0 Pa input) of the fTr, which is known to happen when the endocochlear potential is altered, for example, in the case of endolymphatic hydrops (Salt et al., 2009; Brown et al., 2009). Endolymphatic hydrops can be induced by invasive surgeries involving opening the bony portion of the cochlea and even by low-frequency tone exposure (Kirk & Patuzzi, 1997; Salt, 2004). The present study recorded the CR from only the RW niche, therefore, we do not expect to have surgically caused endolymphatic hydrops, however, the studies from which the hair cells were simulated did use invasive techniques as would any in vivo intracellular experiment. It is possible that the use of such low-frequency stimuli may have produced a shift in the OHC operating point. In spite of potentially altering OHC transduction, there is also a phase difference between the OHCr and IHCr covariates that is necessary for the model. Inclusion of an IHC response explains this portion of the 45 Hz CR waveform in a way that altered OHC transduction alone does not. A comparison of the responses in Fig. 2b and 3d illustrate a crucial difference between the response from an asymmetric OHC and an IHC. While the two hair cells’ fTr look arguably similar (Fig 2a and Fig 3c), their responses are substantially different due to the driving mechanisms of each cell. Inner hair cells are primarily driven at low frequencies by drag of the viscous fluid in the gap between the reticular lamina and tectorial membrane forcing a response to the velocity of the tectorial membrane relative to the reticular lamina (Steele & Puria, 2005). Outer hair cells are mechanically coupled to the tectorial membrane and therefore respond to its displacement (Sellick & Russell, 1980; Nuttall et al., 1981; Russell & Sellick, 1983; Russell et al., 1986; Patuzzi & Yates, 1987; Freeman & Weiss, 1990a, 1990b; Cheatham & Dallos, 1999; Jia et al., 2007). These drives are accounted for by a derivative relationship in the stimuli “presented” to each simulated hair cell. This results in a 90° phase difference between the two hair cell responses that precedes the generation of the receptor potential that is then modulated by each cell’s fTr, and this phase difference is important to the model. Another potential source of this phase difference could actually be a second population of OHCs. For higher-frequency stimuli without the use of a noise masker/suppressor it is assumed there is no group delay to the CM, hence we would expect all OHCs to be in-phase (He et al., 2012). However, if we are indeed recording responses from the apex as well as the base, there would be a phase-shift in the responses from hair cells in the stimulus frequency region where the traveling wave slows down, producing two out-of-phase populations of OHCs (Olson, 1998, 1999; Robles & Ruggero, 2001). Therefore, it is possible that the IHCr covariate could actually be a population of apical OHCs with altered transduction mechanisms. therefore, multiple OHC populations cannot explain the phase difference needed for the model (He et al., 2012). However,
Interestingly, many of the same studies found that the IHC response for high-frequency stimuli (>300 Hz) was in-phase with the OHC response, or sensitive to BM displacement, which may explain why these distortions in the CR waveforms are not seen at frequencies higher than 150 Hz (Sellick & Russell, 1980; Nuttall et al., 1981; Russell & Sellick, 1983; Patuzzi & Yates, 1987). Another difference between an IHC and OHC response in addition to a 90° phase lead (as shown by comparing Fig 2b and Fig 3c) is the peak-splitting in the IHC response. Guinan (2012) modeled how a non-perfect sine wave stimulus and the combination excitatory/inhibitory mechanisms of the IHC could result in peak-splitting of the response at low-frequencies. As shown in the acoustic analysis, the toneburst stimulus is not perfect and a response to acceleration would exaggerate even small distortions, resulting in the split-peak response waveform of the IHCr covariate (Fig. 3). As it turns out, these extra deflections in the IHCr are important to modeling all the deflections in the 45 Hz CR waveform, providing evidence for a significant source to be IHC.
4.3. Localization of response sources
It is thought that the majority of the BM moves in-phase in response to low-frequency stimuli, (He et al., 2012). This produces stimulation of basal hair cells even to low frequencies. Thus, it is the low-frequency tails of the tuning curves of basal OHCs that are thought to be dominating the response (Patuzzi et al., 1989). In 1992, Ponton and colleagues proposed the use of a high-pass noise to ‘mask’ the CM and obtain location-specific responses. While masking has been used to target localized responses in other auditory-evoked potentials such as the CAP (Teas et al., 1962; Eggermont, 1976; Elberling, 1974; Naunton & Zerlin, 1976; Spoor et al., 1976; Evans & Elberling, 1982; Shore & Nuttall, 1985; Earl & Chertoff, 2012) and ABR (Conijn et al., 1992; Boettcher et al., 1995; Klein, 1986; Oates & Stapells, 1997), the term ‘masking’ has traditionally been used to refer only to the suppression of neural responses. However, OHC responses can also be suppressed, though the mechanism is different than that of the auditory nerve (Ruggero et al., 1992). It is thought that a suppressing sound near the probe tone frequency will change the operating point of the transducer curve of the hair cell by keeping the stereocilia constantly deflected such that any addition deflection due to stimulus tone will be one-directional and small relative to the response from unsuppressed hair cells (Ponton et al., 1992). In the present study, noise was used to mask AN responses and suppress OHC responses from non-target regions of the cochlear partition, with the intent of identifying location-specific contributions to the CR. As noise cutoff frequency increased, increasing regions of the partition became “available” to respond. To map the response, the noise cutoff frequency was converted to location, which was quantified as distance from the apex.
If we make the assumption that the noise suppresses non-target hair cell responses and the BM is moving in-phase basal to the stimulus frequency, the relationship between cutoff frequency of the noise and covariate coefficient may provide additional hints as to the origins of the low-frequency CR. The electrical activity recorded at the RW is a vector sum of extracellular currents generated across the entire cochlear partition. If contributing sources move in- and out-of-phase with each other as the targeted region increases, there will be summing and cancelling of spectral elements of the response. If the source of the CR was entirely OHC, it is hypothesized that the CR would grow linearly with cutoff frequency of the noise (Kamerer et al., 2016). The absolute value of the coefficient for the simulated OHC grows linearly with increasing cutoff frequency (Fig. 8), therefore the model agrees with this hypothesis. The CAF in Fig. 9 is a map of the growth of CR fundamental frequency as a function of location (mm) determined by cutoff frequency. If CAF was made of entirely OHC, it would be linear. The drastic change in phase and the negative slope of the function starting at 4 mm from the apex indicate that two out-of-phase sources are contributing to the CR at this location, but then become in-phase at 7 mm from the apex. The linear regression model shows that the IHCr covariate grows nonlinearly as a function of noise condition, and its peak negative amplitude aligns fairly well with location of CAF reduction. In fact, summing the OHCr and IHCr fundamental frequency components results in a sigmoidal CAF similar to that of the measured CAF data, with a reduction in amplitude at certain noise conditions and matching of the large phase changes as a function of distance. The nonlinear growth of the IHCr coefficient including sign-changes, which could be considered phase-reversals, have been shown in chinchilla AN responses to low-frequencies, which Guinan (2012) argues is an indication of phase-reversals in the IHC receptor potential. Guinan presents a model in which the dominating excitatory mechanism of apical IHCs to low-frequency tones is the typical shearing motion of the reticular lamina and tectorial membrane, while basal IHC responses to low-frequencies at high levels (such as those used in this study) may be dominated by a cilia-slant mechanism resulting in phase variances between populations of IHCs. It is possible that apical IHCs may be out-of-phase with OHCs and reduce or halt growth of the CAF but basal IHCs respond in-phase with OHCs, contributing to the growth of the CAF curve closer to the base.
The relationship between characteristic frequency of a given hair cell and stimulus frequency is complicated. Three simulated OHCs were tried in the model from data published by three groups who reported transducer functions for guinea pig OHCs (Fig. 2). While these data may differ due to inconsistencies in recording methods, they also represent multiple characteristic frequency-stimulus frequency relationships, resulting in three transducer curves with different features such as symmetry, steepness, and sharpness of saturation. The simulated OHCr that best fit the measured CR was recorded from a third turn OHC stimulated with an 800 Hz tone (Dallos, 1986). This may be evidence for a response from apical OHCs and confirmation that the noise is suppressing basal OHC responses. However, the OHCr recorded from a basal OHCs stimulated with a 600 Hz tones also fit the data well. Additionally, the estimated coefficients for the OHCr were negative, meaning that the simulated OHC was best fit to the model when the waveform was flipped 180°. This would also reverse the DC response from this cell from positive to negative, such that the hyperpolarization was larger than the depolarization. The outer hair cell DC response to frequencies below the characteristic frequency of the cell at moderate sound levels is dominated by a hyperpolarizing phase (or negative DC) which could explain the negative coefficients, however, at high stimulus levels the OHC is shown to have a positive DC. Due to all these possibilities, it may be overzealous to draw conclusions regarding the location of the OHCs responding to the 45 Hz tone.
4.4. Future Directions
This study provides evidence that supports several cellular sources of the low-frequency cochlear response and evidence that these sources are likely to be outer and inner hair cells and the apical auditory nerve; however, physiologic experiments must be performed to prove the contributions of specific cell types. Fontenot and colleague (2017) applied kainic acid, tetrodotoxin, and ouabain to the RW of the gerbil and observed effects on a 500 Hz CM. On the 45 Hz CR we would expect a loss of all phase-locked APs and some effect on the higher-order harmonics. Once the contribution of the AN is quantified and successfully modeled, another experiment would be to damage inner hair cells. The systematic and specific damage to IHCs without affecting OHCs is more difficult, as much of their anatomy is shared, however, there have been several successful methods of eliminating the IHC response without affecting OHCs. Carboplatin-treated chinchillas have been used to damage IHCs and study auditory neuropathy (Cowper-Smith et al., 2010). A mouse model has also been used to knock-out IHCs; slc19a2-null mice lose inner hair cells when feed a thiamine-poor diet (Fleming et al., 1999, 2001; Liberman et al., 2006). A study which compares of the CR and the simulated source components of mice with and without IHC damage could prove that 1) IHCs are a significant source of the low-frequency CR and 2) the potential of the low-frequency CR to assess the health of IHCs.
5. CONCLUSIONS
Distortions in the 45 Hz CR are products of nonlinear mechanisms in the gerbil cochlea.
Linear regression analysis suggests that responses from outer hair cells, inner hair cells, and auditory nerve significantly contribute to a model of the 45 Hz CR in the gerbil.
An electrical response that captures both AC and DC responses of both OHC and IHC, as well as phase-locking ability of the auditory nerve, may be useful to both physiological hearing research and clinical audiology.
HIGHLIGHTS.
Distortions in the 45 Hz cochlear response are products of nonlinear mechanisms in the gerbil cochlea.
Linear regression analysis suggests that responses from outer hair cells, inner hair cells, and auditory nerve significantly contribute to a model of the 45 Hz cochlear response in the gerbil.
An electrical response that captures both alternate and direct current responses of outer and inner hair cells, as well as phase-locking ability of the auditory nerve, may be useful to both physiological hearing research and clinical audiology.
Acknowledgments
Financial Disclosures/Conflicts of Interest:
This research was funded by NIH R33DC011096 and the University of Kansas Office of Graduate Studies
Footnotes
Publisher's Disclaimer: This is a PDF file of an unedited manuscript that has been accepted for publication. As a service to our customers we are providing this early version of the manuscript. The manuscript will undergo copyediting, typesetting, and review of the resulting proof before it is published in its final citable form. Please note that during the production process errors may be discovered which could affect the content, and all legal disclaimers that apply to the journal pertain.
7. REFERENCES
- Boettcher FA, Mills JH, Dubno JR, & Schmiedt RA (1995). Masking of auditory brainstem responses in young and aged gerbils. Hearing Research, 89(1–2), 1–13. Retrieved from http://www.ncbi.nlm.nih.gov/pubmed/8600113 [DOI] [PubMed] [Google Scholar]
- Brown DJ, Hartsock JJ, Gill RM, Fitzgerald HE, & Salt AN (2009). Estimating the operating point of the cochlear transducer using low-frequency biased distortion products. The Journal of the Acoustical Society of America, 125(4), 2129–2145. 10.1121/1.3083228 [DOI] [PMC free article] [PubMed] [Google Scholar]
- Charaziak KK, Shera CA, & Siegel JH (2017). Using cochlear microphonic potentials to localize peripheral hearing loss. Frontiers in Neuroscience, 11(April). 10.3389/fnins.2017.00169 [DOI] [PMC free article] [PubMed] [Google Scholar]
- Cheatham MA, & Dallos P (1999). Response phase: a view from the inner hair cell. The Journal of the Acoustical Society of America, 105(February 1999), 799–810. 10.1121/1.426269 [DOI] [PubMed] [Google Scholar]
- Cheatham MA, Naik K, & Dallos P (2011). Using the cochlear microphonic as a tool to evaluate cochlear function in mouse models of hearing. Journal of the Association for Research in Otolaryngology : JARO, 12(1), 113–125. 10.1007/s10162-010-0240-5 [DOI] [PMC free article] [PubMed] [Google Scholar]
- Chertoff ME, Earl BR, Diaz FJ, & Sorensen JL (2012). Analysis of the cochlear microphonic to a low-frequency tone embedded in filtered noise. The Journal of the Acoustical Society of America, 132(5), 3351–3362. 10.1121/1.4757746 [DOI] [PMC free article] [PubMed] [Google Scholar]
- Chertoff ME, Earl BR, Diaz FJ, Sorensen JL, Thomas M. L. a, Kamerer AM, & Peppi M (2014). Predicting the location of missing outer hair cells using the electrical signal recorded at the round window. The Journal of the Acoustical Society of America, 136(3), 1212 10.1121/1.4890641 [DOI] [PMC free article] [PubMed] [Google Scholar]
- Chertoff ME, Kamerer AM, Peppi M, & Lichtenhan JT (2015). An analysis of cochlear response harmonics: Contribution of neural excitation. The Journal of the Acoustical Society of America, 138(5), 2957–2963. 10.1121/1.4934556 [DOI] [PMC free article] [PubMed] [Google Scholar]
- Cody AR, & Russell IJ (1987). The response of hair cells in the basal turn of the guinea-pig cochlea to tones. The Journal of Physiology, 383, 551–569. Retrieved from http://www.pubmedcentral.nih.gov/articlerender.fcgi?artid=1183089&tool=pmcentrez&rendertype=abstract%5Cnhttps://www.dropbox.com/s/tq4fdaed0wt33zd/1987 - Cody, Russell - The response of hair cells in the basal turn of the guinea-pig cochlea to tones.pdf?dl [DOI] [PMC free article] [PubMed] [Google Scholar]
- Conijn EA, Brocaar MP, van Zanten GA, & van der Drift JF (1992). Comparison between the frequency specificities of auditory brainstem response thresholds to clicks with and without high-pass masking noise. Audiology : Official Organ of the International Society of Audiology, 31(5), 284–292. Retrieved from http://www.ncbi.nlm.nih.gov/pubmed/1449431 [DOI] [PubMed] [Google Scholar]
- Cowper-Smith CD, Dingle RN, Guo Y, Burkard R, & Phillips DP (2010). Synchronous auditory nerve activity in the carboplatin-chinchilla model of auditory neuropathy. The Journal of the Acoustical Society of America, 128(1), EL56–62. 10.1121/1.3453764 [DOI] [PMC free article] [PubMed] [Google Scholar]
- Dallos P (1969). Comments on the Differential-Electrode HE content of this paper is probably well known. J. Acoust. Soc. Am, 45(June), 999–1007. [Google Scholar]
- Dallos P (1973). Basic Mechanisms in Hearing. In Møller A (Ed.), Basic Mechanisms in Hearing (pp. 335–372). New York: Academic Press. [Google Scholar]
- Dallos P (1985). Response characteristics of mammalian cochlear hair cells. Journal of Neuroscience, 5(6), 1591–1608. [DOI] [PMC free article] [PubMed] [Google Scholar]
- Dallos P (1986). Neurobiology of cochlear inner and outer hair cells: intracellular recordings. Hearing Research, 22, 185–198. Retrieved from http://www.ncbi.nlm.nih.gov/pubmed/3733539 [DOI] [PubMed] [Google Scholar]
- Dallos P, Billone MC, Durrant JD, Wang CY, & Raynor S (1972). Cochlear inner and outer hair cells: functional differences. Science (New York, N.Y.), 177(4046), 356–358. Retrieved from http://www.ncbi.nlm.nih.gov/pubmed/5035486 [DOI] [PubMed] [Google Scholar]
- Dallos P, & Cheatham MA (1976). Production of cochlear potentials by inner and outer hair cells. The Journal of the Acoustical Society of America, 60(2), 510–512. Retrieved from http://www.ncbi.nlm.nih.gov/pubmed/993471 [DOI] [PubMed] [Google Scholar]
- Dallos P, & Cheatham MA (1989). Nonlinearities in cochlear receptor potentials and their origins. The Journal of the Acoustical Society of America, 86(5), 1790–1796. Retrieved from http://www.ncbi.nlm.nih.gov/pubmed/2808928 [DOI] [PubMed] [Google Scholar]
- Dallos P, & Durrant JD (1972). On the derivative relationship between stapes movement and cochlear microphonic. The Journal of the Acoustical Society of America, 52(4), 1263–1265. 10.1121/1.1913241 [DOI] [PubMed] [Google Scholar]
- Dallos P, & Sweetman RH (1969). Distribution pattern of cochlear harmonics. The Journal of the Acoustical Society of America, 45(1), 37–46. Retrieved from http://www.ncbi.nlm.nih.gov/pubmed/5797145 [DOI] [PubMed] [Google Scholar]
- Davis H (1968). Mechanisms of the Inner Ear. Annals of Otology, Rhinology & Laryngology, 77(4), 644–655. 10.1177/000348946807700405 [DOI] [PubMed] [Google Scholar]
- Earl BR, & Chertoff ME (2012). Mapping auditory nerve firing density using high-level compound action potentials and high-pass noise masking. The Journal of the Acoustical Society of America, 131(1), 337–352. 10.1121/1.3664052 [DOI] [PMC free article] [PubMed] [Google Scholar]
- Eggermont JJ (1976). Analysis of compound action potential responses to tone bursts in the human and guinea pig cochlea. The Journal of the Acoustical Society of America, 60(5), 1132–1139. 10.1121/1.381214 [DOI] [PubMed] [Google Scholar]
- Elberling C (1974). Action Potentirals Along the Cochlear Partition Recorded from the ear Canal in Man. Scandinavian Audiology, 3(1), 13–19. 10.3109/01050397409044959 [DOI] [Google Scholar]
- Engebretson AM, & Eldredge DH (1968). Model for the Nonlinear Characteristics of Cochlear Potentials. The Journal of the Acoustical Society of America, 44(2), 548–554. 10.1121/1.1911119 [DOI] [PubMed] [Google Scholar]
- Evans EF, & Elberling C (1982). Location-specific components of the gross cochlear action potential: an assessment of the validity of the high-pass masking technique by cochlear nerve fibre recording in the cat. Audiology : Official Organ of the International Society of Audiology, 21(3), 204–227. 10.3109/00206098209072740 [DOI] [PubMed] [Google Scholar]
- Fleming JC, Steinkamp MP, Kawatsuji R, Tartaglini E, Pinkus JL, Pinkus GS, … Neufeld EJ (2001). Characterization of a murine high-affinity thiamine transporter, Slc19a2. Molecular Genetics and Metabolism, 74(1–2), 273–280. 10.1006/mgme.2001.3241 [DOI] [PubMed] [Google Scholar]
- Fleming JC, Tartaglini E, Steinkamp MP, Schorderet DF, Cohen N, & Neufeld EJ (1999). The gene mutated in thiamine-responsive anaemia with diabetes and deafness ( TRMA ) encodes a functional thiamine transporter, 22(July), 305–308. [DOI] [PubMed] [Google Scholar]
- Fontenot TE, Giardina CK, & Fitzpatrick DC (2017). A model-based approach for separating the cochlear microphonic from the auditory nerve neurophonic in the ongoing response using electrocochleography. Frontiers in Neuroscience, 11(OCT), 1–18. 10.3389/fnins.2017.00592 [DOI] [PMC free article] [PubMed] [Google Scholar]
- Forgues M, Koehn HA, Dunnon AK, Pulver SH, Buchman CA, Adunka OF, & Fitzpatrick DC (2014). Distinguishing hair cell from neural potentials recorded at the round window. Journal of Neurophysiology, 111(3), 580–593. 10.1152/jn.00446.2013 [DOI] [PMC free article] [PubMed] [Google Scholar]
- Freeman DM, & Weiss TF (1990a). Hydrodynamic forces on hair bundles at high frequencies. Hearing Research, 48(1–2), 31–36. 10.1016/0378-5955(90)90197-W [DOI] [PubMed] [Google Scholar]
- Freeman DM, & Weiss TF (1990b). Superposition of hydrodynamic forces on a hair bundle. Hearing Research, 48(1–2), 1–15. 10.1016/0378-5955(90)90195-U [DOI] [PubMed] [Google Scholar]
- Fridberger A, Tomo I, Ulfendahl M, & Boutet de Monvel J (2006). Imaging hair cell transduction at the speed of sound: dynamic behavior of mammalian stereocilia. Proceedings of the National Academy of Sciences of the United States of America, 103(6), 1918–1923. 10.1073/pnas.0507231103 [DOI] [PMC free article] [PubMed] [Google Scholar]
- Guinan JJ (2012). How are inner hair cells stimulated ? Evidence for multiple mechanical drives. Hearing Research, 292(1–2), 35–50. 10.1016/j.heares.2012.08.005 [DOI] [PMC free article] [PubMed] [Google Scholar]
- He W, Porsov E, Kemp DT, Nuttall AL, & Ren T (2012). The group delay and suppression pattern of the cochlear microphonic potential recorded at the round window. PloS One, 7(3), e34356 10.1371/journal.pone.0034356 [DOI] [PMC free article] [PubMed] [Google Scholar]
- Henry KS (1995). HSIRIrlG RES [ ARCH Auditory nerve neurophonic recorded from the round window of the Mongolian gerbil, 90, 176–184. [DOI] [PubMed] [Google Scholar]
- Honrubia V, & Ward PH (1969). Dependence of the cochlear microphonics and the summating potential on the endocochlear potential. The Journal of the Acoustical Society of America Retrieved from http://www.ncbi.nlm.nih.gov/pubmed/5804109 [DOI] [PubMed]
- Jia S, Dallos P, & He DZZ (2007). Mechanoelectric transduction of adult inner hair cells. The Journal of Neuroscience : The Official Journal of the Society for Neuroscience, 27(5), 1006–1014. 10.1523/JNEUROSCI.5452-06.2007 [DOI] [PMC free article] [PubMed] [Google Scholar]
- Johnstone BM, Johnstone JR, & Pugsley ID (1966). Membrane Resistance in Endolymphatic Walls of the First Turn of the Guinea‐Pig Cochlea. The Journal of the Acoustical Society of America, 40(6), 1398–1404. 10.1121/1.1910239 [DOI] [PubMed] [Google Scholar]
- Kamerer AM, Diaz FJ, Peppi M, & Chertoff ME (2016). The potential use of low-frequency tones to locate regions of outer hair cell loss. Hearing Research, 342, 39–47. 10.1016/j.heares.2016.09.006 [DOI] [PMC free article] [PubMed] [Google Scholar]
- Kirk DL, & Patuzzi RB (1997). Transient changes in cochlear potentials and DPOAEs after low-frequency tones: the ‘two-minute bounce’revisited. Hearing Research, 112, 49–68. Retrieved from http://www.sciencedirect.com/science/article/pii/S0378595597001056 [DOI] [PubMed] [Google Scholar]
- Klein AJ (1986). Masking effects on ABR waves I and V in infants and adults. The Journal of the Acoustical Society of America, 79(3), 755–759. Retrieved from http://www.ncbi.nlm.nih.gov/pubmed/3958315 [DOI] [PubMed] [Google Scholar]
- Landegger LD, Psaltis D, & Stankovic KM (2016). Human audiometric thresholds do not predict specific cellular damage in the inner ear. Hearing Research, 335, 83–93. 10.1016/j.heares.2016.02.018 [DOI] [PMC free article] [PubMed] [Google Scholar]
- Liberman MC, Tartaglini E, Fleming JC, & Neufeld EJ (2006). Deletion of SLC19A2, the high affinity thiamine transporter, causes selective inner hair cell loss and an auditory neuropathy phenotype. JARO - Journal of the Association for Research in Otolaryngology, 7(3), 211–217. 10.1007/s10162-006-0035-x [DOI] [PMC free article] [PubMed] [Google Scholar]
- Lichtenhan JT, Hartsock JJ, Gill RM, Guinan JJ, & Salt AN (2014). The auditory nerve overlapped waveform (ANOW) originates in the cochlear apex. Journal of the Association for Research in Otolaryngology : JARO, 15(3), 395–411. 10.1007/s10162-014-0447-y [DOI] [PMC free article] [PubMed] [Google Scholar]
- Müller M (1996). The cochlear place-frequency map of the adult and developing mongolian gerbil. Hearing Research, 94(1–2), 148–156. 10.1016/0378-5955(95)00230-8 [DOI] [PubMed] [Google Scholar]
- Naunton RF, & Zerlin S (1976). Human whole-nerve responses to clicks of various frequency. Audiology, 15, 1–9. [DOI] [PubMed] [Google Scholar]
- Nuttall AL, Brown MC, Masta RI, & Lawrence M (1981). Inner hair cell responses to the velocity of basilar membrane motion in the guinea pig. Brain Research, 211(1), 171–174. 10.1016/0378-5955(80)90080-5 [DOI] [PubMed] [Google Scholar]
- Oates P, & Stapells DR (1997). Frequency specificity of the human auditory brainstem and middle latency responses to brief tones. I. High-pass noise masking. The Journal of the Acoustical Society of America, 102(6), 3597–3608. 10.1121/1.420148 [DOI] [PubMed] [Google Scholar]
- Olson ES (1998). Observing middle and inner ear mechanics with novel intracochlear pressure sensors. The Journal of the Acoustical Society of America, 103(6), 3445–3463. 10.1121/1.423083 [DOI] [PubMed] [Google Scholar]
- Olson ES (1999). Direct measurement of intra-cochlear pressure waves. Nature, 402(6761), 526–529. 10.1038/990092 [DOI] [PubMed] [Google Scholar]
- Patuzzi RB, & Yates GK (1987). The low-frequency response of inner hair cells in the guinea pig cochlea: implications for fluid coupling and resonance of the stereocilia. Hearing Research, 30(1), 83–98. 10.1016/0378-5955(87)90186-9 [DOI] [PubMed] [Google Scholar]
- Patuzzi RB, Yates GK, & Johnstone BM (1989). The origin of the low-frequency microphonic in the first cochlear turn of guinea-pig. Hearing Research, 39(1–2), 177–188. 10.1016/0378-5955(89)90089-0 [DOI] [PubMed] [Google Scholar]
- Ponton CW, Don M, & Eggermont JJ (1992). Place-specific derived cochlear microphonics from human ears. Scandinavian Audiology, 21(3), 131–141. [DOI] [PubMed] [Google Scholar]
- Robles L, & Ruggero MA (2001). Mechanics of the Mammalian Cochlea. Physiological Reviews, 81(3), 1305–1352. 10.1152/physrev.2001.81.3.1305 [DOI] [PMC free article] [PubMed] [Google Scholar]
- Ruggero MA, Robles L, & Rich NC (1992). Two-tone suppression in the basilar membrane of the cochlea: mechanical basis of auditory-nerve rate suppression. Journal of Neurophysiology, 68(4), 1087–1099. Retrieved from http://www.ncbi.nlm.nih.gov/pubmed/1432070 [DOI] [PubMed] [Google Scholar]
- Ruggero M. a, Robles L, & Rich NC (1986). Cochlear microphonics and the initiation of spikes in the auditory nerve: correlation of single-unit data with neural and receptor potentials recorded from the round window. The Journal of the Acoustical Society of America, 79(5), 1491–1498. Retrieved from http://www.ncbi.nlm.nih.gov/pubmed/3711448 [DOI] [PubMed] [Google Scholar]
- Russell IJ, Cody AR, & Richardson GP (1986). The responses of inner and outer hair cells in the basal turn of the guinea-pig cochlea and in the mouse cochlea grown in vitro. Hearing Research, 22, 199–216. Retrieved from http://www.ncbi.nlm.nih.gov/pubmed/3733540 [DOI] [PubMed] [Google Scholar]
- Russell IJ, & Sellick PM (1983). Low-frequency characteristics of intracellularly recorded receptor potentials in guinea-pig cochlear hair cells. The Journal of Physiology, 338, 179–206. [DOI] [PMC free article] [PubMed] [Google Scholar]
- Salt AN (2004). Acute endolymphatic hydrops generated by exposure of the ear to nontraumatic low-frequency tones. Journal of the Association for Research in Otolaryngology : JARO, 5(2), 203–214. 10.1007/s10162-003-4032-z [DOI] [PMC free article] [PubMed] [Google Scholar]
- Salt AN, Brown DJ, Hartsock JJ, & Plontke SK (2009). Displacements of the organ of Corti by gel injections into the cochlear apex. Hearing Research, 250(314), 63–75. 10.1016/j.heares.2009.02.001.Displacements [DOI] [PMC free article] [PubMed] [Google Scholar]
- Sellick PM, & Russell IJ (1980). The responses of inner hair cells to basilar membrane velocity during low frequency auditory stimulation in the guinea pig cochlea. Hearing Research, 2(3–4), 439–445. 10.1016/0378-5955(80)90080-5 [DOI] [PubMed] [Google Scholar]
- Shore SE, & Nuttall AL (1985). High-synchrony cochlear compound action potentials evoked by rising frequency-swept tone bursts. The Journal of the Acoustical Society of America, 78(4), 1286–1295. Retrieved from http://www.ncbi.nlm.nih.gov/pubmed/3840500 [DOI] [PubMed] [Google Scholar]
- Steele CR, & Puria S (2005). Force on inner hair cell cilia. International Journal of Solids and Structures, 42(21–22), 5887–5904. 10.1016/J.IJSOLSTR.2005.03.056 [DOI] [Google Scholar]
- Tasaki I, Davis H, & Eldredge DH (1954). Exploration of Cochlear Potentials in Guinea Pig with a Microelectrode. The Journal of the Acoustical Society of America, 26(5), 765–773. 10.1121/1.1907415 [DOI] [Google Scholar]
- Teas DC, Eldredge DH, & Davis H (1962). Cochlear responses to acoustic transients: An interpretation of whole-nerve action potentials. Journal of the Acoustical Society of America, 34(9), 1438–1459. 10.1121/1.1918366 [DOI] [Google Scholar]
- Whitfield IC, & Ross HF (1965). Cochlear-microphonic and summating potentials and the outputs of individual hair-cell generators. The Journal of the Acoustical Society of America, 38, 126–131. Retrieved from http://www.ncbi.nlm.nih.gov/pubmed/14347603 [DOI] [PubMed] [Google Scholar]
- Withnell RH (2001). Brief report: the cochlear microphonic as an indication of outer hair cell function. Ear and Hearing, 22(1), 75–77. Retrieved from http://www.ncbi.nlm.nih.gov/pubmed/11271978 [DOI] [PubMed] [Google Scholar]
- Zheng XY, Ding D, McFadden SL, & Henderson D (1997). Evidence that inner hair cells are the major source of cochlear summating potentials. Hearing Research, 113(1–2), 76–88. 10.1016/S0378-5955(97)00127-5 [DOI] [PubMed] [Google Scholar]