

Abstract
Protein sequences of members of the plasminogen activation system are present throughout the entire vertebrate phylum. This important and well-described proteolytic cascade is governed by numerous protease–substrate and protease–inhibitor interactions whose conservation is crucial to maintaining unchanged protein function throughout evolution. The pressure to preserve protein–protein interactions may lead to either co-conservation or covariation of binding interfaces. Here, we combined covariation analysis and structure-based prediction to analyze the binding interfaces of urokinase (uPA):plasminogen activator inhibitor-1 (PAI-1) and uPA:plasminogen complexes. We detected correlated variation between the S3-pocket–lining residues of uPA and the P3 residue of both PAI-1 and plasminogen. These residues are known to form numerous polar interactions in the human uPA:PAI-1 Michaelis complex. To test the effect of mutations that correlate with each other and have occurred during mammalian diversification on protein–protein interactions, we produced uPA, PAI-1, and plasminogen from human and zebrafish to represent mammalian and nonmammalian orthologs. Using single amino acid point substitutions in these proteins, we found that the binding interfaces of uPA:plasminogen and uPA:PAI-1 may have coevolved to maintain tight interactions. Moreover, we conclude that although the interaction areas between protease–substrate and protease–inhibitor are shared, the two interactions are mechanistically different. Compared with a protease cleaving its natural substrate, the interaction between a protease and its inhibitor is more complex and involves a more fine-tuned mechanism. Understanding the effects of evolution on specific protein interactions may help further pharmacological interventions of the plasminogen activation system and other proteolytic systems.
Keywords: serine protease, serpin, substrate specificity, protein evolution, surface plasmon resonance (SPR)
Introduction
Protein–protein interactions, which generally involve contact between specific amino acids from each protein, are involved in the majority of cellular functions. Understanding protein–protein interactions and their evolution is important not only for understanding human physiology but also for rationally influencing signaling, regulatory pathways, and enzyme systems for a therapeutic outcome.
Evolution of protein–protein interfaces may have one of three results: 1) the affinity of interaction may be unchanged, even if there are alterations of key residues; 2) new high affinity interactions may be generated between previously noninteracting proteins; and finally 3) interactions may decrease in affinity, potentially to the point that they no longer form. In all three cases, the effect of residue changes in one of the interacting surfaces will depend on the properties of complementing residues on the other interacting surface. In addition, amino acids present at other positions on the same surface may affect the functional consequences of a residue exchange. The affinity between two proteins may also depend on residues distant from the interfaces, in view of conformational effects (1).
Due to their high structural similarities yet diverse and highly specific functions, extracellular trypsin-like serine proteases offer an opportunity to study the above-mentioned evolutionary scenarios. Moreover, serine protease systems have been widely studied, leading to a greater understanding of catalytic and regulatory mechanisms. The functions of serine proteases depend on numerous protein–protein interactions including internal interdomain interactions, those between the enzymes and their protein substrates, the enzymes, and their protein cofactors, and the enzymes and their inhibitors (2).
The plasminogen activation system includes the serine proteases uPA,2 tissue-type plasminogen activator (tPA), and their common substrate plasminogen (3). Both enzymes uPA and tPA catalyze the conversion of the zymogen plasminogen to the active serine protease plasmin by hydrolysis of a single peptide bond, the RV bond in a short, disulfide-bridged constrained sequence (CPGRVVGGC in humans) (4, 5). This proteolytic reaction is initiated by formation of a noncovalent “Michaelis” complex in which residues of the substrate interact with the binding pockets of the active site of the chymotrypsin-like serine protease. The immediate N-terminal and C-terminal residues adjacent to the bond being cleaved, named P1 and P1′, respectively, insert into the S1– and S1′–pockets and vice versa. The final binding interface between the substrate and serine protease constitutes the P2-Pn/S2-Sn and P2′-Pn′/S2′-Sn′ interactions as well as additional main chain and side pocket interactions (2).
Besides the knowledge about the scissile bond, virtually nothing is known about the recognition of plasminogen by uPA or tPA, despite decades of research on plasminogen activation. It is likely that plasminogen makes exosite contacts to uPA or tPA, defined as interactions between a substrate or an inhibitor with parts of the enzyme outside of the active site, that contribute to the rate of cleavage. This presumption is based on a previous observation that linear or cyclic peptides containing only the CPGRVVGGC sequence are poor substrates for uPA and tPA (6–8).
The primary physiological, highly specific and fast-acting inhibitor of the plasminogen activators is the serpin PAI-1 (9). Serpins, like PAI-1, are synthesized and secreted in a metastable (“stressed”) state, which can convert to a stable (“relaxed”) state by insertion of the reactive center loop (RCL) into the central β-sheet A. The existence of these two conformational states is the basis for the protease inhibitory mechanism of serpins (10–13). Serpins are recognized by their target proteases as a substrate. Through an initial reversible Michaelis (encounter) complex, the target protease attacks the reactive center peptide bond in the RCL like a substrate. However, in the following steps, the RCL is inserted into β-sheet A and the serpin converts to the relaxed state. This conformational change of the serpin deforms the catalytic domain of the protease. As a consequence, peptide bond hydrolysis is halted, and a stable, covalent complex with a permanently inactivated protease is formed. The high specificity of most serpins for specific proteases is a result of the RCL–active site interaction as well as exosite interactions. In the case of PAI-1, highly specific and efficient inhibition of its target proteases present at low concentration is achieved by formation of a tight Michaelis complex with low nanomolar affinity. However, other serpins may accomplish this through cofactors or where a lower affinity is compensated by higher in vivo concentrations (14, 15).
In the present study, we have mapped the occurrence of the plasminogen activation system in the vertebrate subphylum using previously published sequences. Plasminogen, uPA, tPA, and PAI-1 were identified in all vertebrates, from cartilaginous fishes to mammals, although PAI-1 appears to have been lost in a vast majority of birds and uPA was not found in amphibians. Using protein structure prediction and multiple sequence alignment, we investigated the evolution of the interaction surfaces between uPA and its primary substrate and inhibitor, plasminogen and PAI-1, respectively. Within the vertebrate subphylum, we found evidence for correlated amino acid changes in the enzyme, substrate, and inhibitor. To investigate the role of these amino acids in the interaction interface, we switched single species-specific amino acids in uPA, plasminogen, and PAI-1 proteins and analyzed the functional consequences. Despite the fact that the chosen species belong to evolutionary distant lineages of teleosts and mammals, it was possible to switch species specificity by a single mutation in the inhibitor. Mutations introduced in the specificity pocket of the protease resulted in altered specificity of mammalian, but not teleost protein. The combination of correlated variation, specificity switching due to alteration of the same residues and tight interactions indicated that coevolution may have occurred in the uPA:PAI-1 protease:inhibitor complex. Interestingly, our analysis of the protease:substrate interface, including rational mutations of the substrate plasminogen, did not reveal strong coevolution; we conclude that controlling unwanted and potentially detrimental unattested protease activity is evolutionary more important than securing the specificity of a substrate cleavage reaction as long as it takes place at a sufficient rate.
Results
Structural analysis of the interface in the plasminogen activator:PAI-1 Michaelis complex
X-ray crystal structures of the Michaelis complexes between human PAI-1 and human uPA (16) and between human PAI-1 and human tPA (17) were previously determined. In both cases, the active site of the protease interacts with the RCL of PAI-1 and numerous exosite interactions are formed. Using the consensus sequences of uPA, tPA, and PAI-1 from vertebrate classes, we compared amino acids present at the positions corresponding to the interacting residues in human complexes. The analyzed residues were either highly conserved (i.e. exosites within 37-loop, S1-pocket, and P1 residue), varied or displayed correlated amino acid replacements in the pair of interacting proteins. The latter may in some cases be a sign of coevolution (18).
RCL residues P4 to P3′ are involved in extensive interactions with the uPA catalytic site, particularly the P1–P3 residues of PAI-1 align into the active site of the protease in a substrate-like manner, i.e. the main chain of these residues in the uPA:PAI-1 complex coincided completely with the P1, P2, and P3 residues of the H-Glu-Gly-Arg-chloromethylketone (EGR-cmk):uPA complex (19) (Fig. 1, A and B). The P3 residue inserts into the so-called S3-pocket of uPA lined by the residues 97b, 99 (97-loop), 215, 216, and 217 (216-loop) and forms polar interactions with the residues His-99, Leu-97b, and Gly-216 (Fig. 1C). The P3 residue in PAI-1 is consistently a bulky residue in nonmammalian vertebrates, Tyr, Phe, Leu, or Val, whereas it is a Ser in mammals. uPA residues 97b, 99, and 217 are consistently Gly, Tyr/Phe, and Glu/Asp/Ile in nonmammalian vertebrates and Leu, His, and Arg in mammals (Fig. 2). Residues 215 and 216, lying in the bottom of the S3-pocket, are conserved through the vertebrates (Fig. 2). Structural modeling of nonmammalian uPA:PAI-1 Michaelis complex suggested that mutations within the 97- and 216-loops of uPA may result in S3-pocket enlargement and charge reversal on the lip of the pocket (Fig. 1, D and E). Teleosts possess two uPA variants, uPAa and uPAb (20). For the majority of teleosts the uPAa 97-loop is two amino acids shorter than the vertebrate consensus, thus we excluded uPAa from further analysis. There is a consistent covariation in the P3 residues of PAI-1 and the residues lining the S3-pocket of uPA, with a difference between mammals and other vertebrates. Similar correlations were not observed on the P′ side, as the P1′–P3′ PAI-1 residues are almost completely conserved.
Figure 1.

Michaelis complex between uPA and PAI-1. A, structure of Michaelis complex between human PAI-1 (yellow) and uPA (white) (PDB ID 3PB1). B, in complexes with uPA, main chains of the P1 to P3 residues of PAI-1 (yellow) align with the P1–P3 residues of EGR-cmk (green) (PDB ID 1LMW). C, P3 Ser of hPAI-1 forms polar interactions with the S3-pocket forming residues of huPA (Leu-97b, His-99, Gly-216). Hydrogen bonds are shown as dashed lines. D and E, charge and size of the S3-pocket in huPA and zfuPA are different. Enlarged S3-pocket of zfuPA can accommodate bulky P3 residues of zfPAI-1 (cyan). Structure of the zfuPA:zfPAI-1 Michaelis complex was modeled in SwissModel using a human uPA:PAI-1 Michaelis complex structure as the template (PDB ID 3PB1). The RCL of zfPAI-1 is shown in cyan, with P1 to P3 residues shown as sticks.
Figure 2.

Multiple sequence alignment of the PAI-1 RCL (A), plasminogen activation loop (C), and residues forming 97b- and 217-loops in uPA (B) and tPA (D). To compare uPA, tPA, plasminogen, and PAI-1 from various vertebrates, sequences of each monophyletic group were aligned in ClustalOmega and a consensus was determined. Numbers in the brackets refer to the number of sequences used for consensus determination. Ambiguous resides are shown as X.
For the PAI-1 complex with tPA, the active site interactions are limited to the P1 residue of PAI-1 inserting into the S1 specificity pocket of tPA (17). The 97-loop of tPA is consistently 2 residues shorter than that of uPA (Fig. 2) and the RCL adopts the kinked conformation, which results in the lack of the polar interactions between the P2 and P3 residues of PAI-1 and the residues lining the S3-pocket of tPA.
The plasminogen activator-plasminogen interface
There is no existing structural data for the Michaelis complex between plasminogen and uPA, but because PAI-1 behaves like a substrate for uPA, we assumed that the sequence around the scissile bond in plasminogen encounters uPA in largely the same conformation as the sequence around the scissile bond in PAI-1. We therefore aligned this sequence from plasminogen among representative vertebrate species (Fig. 2). We noticed similar, although weaker, covariation in the residue present in the P3 position in plasminogen and PAI-1. In the majority of lower vertebrates, there is consistently a large aromatic or aliphatic residue in the P3 position of plasminogen and PAI-1, with the exception of turtles, alligators, and birds having Pro or Ala at this position. In mammals, the P3 in plasminogen is consistently a Pro.
Correlated evolutionary changes
As correlated evolutionary changes in binding interfaces can arise from intermolecular coevolution (18), we identified site-specific correlated substitutions between the components of the Michaelis complexes using mutual information (MI). Although recently developed methods for identifying correlated changes are more sensitive than MI (21, 22), they require a very large number of aligned sequences, and therefore cannot be applied in this case. MI scores are shown in Table 1. Several of the interacting sites are completely conserved, so their MI scores are uninformative. It is possible that conservation at one site constrains the set of accepted replacements at the second site, and so co-constraint could be a sign of coevolution (18). However, a number of other evolutionary mechanisms can give rise to similar patterns of conservation. At a number of other sites in the interface between PAI-1 and uPA, correlated changes are observed, as indicated by large positive MI scores. In particular, changes in the P3 site of PAI-1 correlate with changes in the 99 and 216 loops of uPA. Equivalent high MI scores are not observed between PAI-1 and tPA. Positive MI scores are also observed between residues of the plasminogen activation loop and uPA residues interacting with the RCL of PAI-1 in those sites where there is variation. In summary, MI scores corroborate the correlations identified by inspection of the sequence alignments shown in Fig. 2.
Table 1.
MI scores are shown calculated for uPA:PAI-1 and uPA:plasminogen pairs
| uPA | PAI-1 |
Plasminogen |
||
|---|---|---|---|---|
| Residue | MI score | Residue | MI score | |
| S3 pocket | ||||
| Leu-97b | S P3 | 1.988 | P P3 | 3.133 |
| His-99 | S P3 | 2.300 | P P3 | 12.602 |
| Trp-215 | S P3 | Consa | P P3 | Cons |
| Gly-216 | S P3 | Cons | P P3 | Cons |
| Arg-217 | S P3 | 5.428 | P P3 | −0.582 |
| S2 pocket | ||||
| Gln-192 | A P2 | −0.193 | G P2 | Cons |
| Gln-192 | P P3′ | −2.681 | G P3′ | Cons |
| S1 pocket | ||||
| His-57 | R P1 | Cons | R P1 | Cons |
| Asp-189 | R P1 | Cons | R P1 | Cons |
| Ser-190 | R P1 | Cons | R P1 | Cons |
| Gly-193 | R P1 | Cons | R P1 | Cons |
| Asp-194 | R P1 | Cons | R P1 | Cons |
| Ser-195 | R P1 | Cons | R P1 | Cons |
| Ser-214 | R P1 | Cons | R P1 | Cons |
| Ser-219 | R P1 | Cons | R P1 | Cons |
| His-57 | M P1′ | Cons | V P1′ | Cons |
| Gly-193 | M P1′ | Cons | V P1′ | 6.536 |
| Exosite loops | ||||
| Val-41 | A P2′ | Cons | V P2′ | Cons |
| Tyr-151 | A P2′ | Cons | V P2′ | Cons |
| Arg-35 | E P4′ | 0.987 | G P4′ | Cons |
| Tyr-60b | E P4′ | Cons | G P4′ | Cons |
| Tyr-149 | E P5′ | Cons | ||
a Cons refers to conserved residues for which calculated MI values are irrelevant.
On the basis of the above analysis of the Michaelis complexes, we hypothesized that uPA and plasminogen/PAI-1 have coevolved, ensuring a functional S3–P3 interaction at all times, whereas this interaction has not played any role in the evolution of the interaction between tPA and plasminogen/PAI-1.
We tested this hypothesis by characterizing the interactions of microplasminogen (μPlg) (truncated variant of plasminogen, Fig. S1) and PAI-1 from human (hμPlg, hPAI-1) and zebrafish (zfμPlg, zfPAI-1) with human uPA (huPA) and zebrafish uPAb (zfuPA), which serve as representatives for mammalian and nonmammalian proteins (Fig. 3). If the hypothesis is correct, we would predict poor reactivity of uPA from one species with plasminogen/PAI-1 from the other species. Moreover, we would expect to be able to improve the interspecies reactivity by mutating the residues in the polymorphic positions to those present in the other species. We chose to mutate individually and simultaneously the uPA S3-pocket residues displaying large differences in the physicochemical properties between mammals and nonmammalian species, i.e. positions 97b and 217 (Fig. 3) (varying in size and charge). Additionally, a triple mutant of uPA was created (97b, 99, and 217), with the S3-pocket residues fully exchanged between human and zebrafish (Fig. 3).
Figure 3.

Strategy for mutagenesis of uPA, PAI-1, and μPlg from zebrafish and human. Based on multiple sequence alignment and MI calculations, correlated mutations between the S3-pocket–lining residues of uPA and the P3 residue of PAI-1 and S3-pocket residues of uPA and P3 residue of plasminogen were detected. The uPA S3 specificity pocket is composed of residues 97b, 99, 215, 216, and 217 of which residues Trp-215 and Gly-216 (marked in gray) are conserved through the vertebrate phylum. Residues 97b, 99, and 217 are Leu, His, and Arg in mammalian uPA (pink) and Gly, Phe, and Glu in uPA from nonmammalian species (blue). The P3 residue of PAI-1 inserts into the S3 specificity pocket of uPA and forms polar contacts with the S3-pocket–lining residues (16). The P3 residue is either Ser in mammalian PAI-1 (dark pink) or Tyr in nonmammalian PAI-1 (dark blue). The P3 residue of plasminogen is either Pro (dark pink) or Phe (dark blue) in mammalian and nonmammalian proteins, respectively. As correlated mutations occurred after diversification of mammals, we produced human (pink) and zebrafish (blue) uPA, PAI-1, and plasminogen, representing mammalian and nonmammalian orthologues, respectively. We then exchanged the residues of interest alone or in combination and tested if interactions between uPA:PAI-1 and uPA:plasminogen were affected.
Species specificity of the reaction of PAI-1 and uPA, formation of the Michaelis complex
We analyzed the initial step of the interaction between PAI-1 and uPA, i.e. the formation of the Michaelis complex. To do so, we immobilized variants of uPA S195A on the surface of plasmon resonance (SPR) chips via an antibody and determined the rate constants and the KD values for the binding. As specific anti-huPA and anti-zfuPA antibodies were immobilized on the chip surface, uPA S195A variants were not purified but captured directly from the conditioned media. Such a setup enabled fast screening of a number huPA and zfuPA mutants. The use of uPA S195A, with the active site Ser mutated to an Ala, ensures that the reaction stops at the Michaelis complex and does not proceed to the stable complex. In general, we consider a change in affinity constant caused by the mutation within the same protein, to be considered of functional significance, to be in the order of magnitude of at least 5–10-fold. The results are shown in Table 2, and Figs. 4 and 5. Representative sensorgrams for all tested uPA:PAI-1 pairs are shown in Fig. S2.
Table 2.
KD (nm) for interactions between PAI-1 and uPA variants
| uPA | Mammalian P3 |
Non-mammalian P3 |
||
|---|---|---|---|---|
| hPAI-1 WT | zfPAI-1 Y(P3)S | hPAI-1 S(P3)Y | zfPAI-1 WT | |
| huPA S195A | 0.58 ± 0.04 (3) | 1.04 ± 0.08 (3) | 17.1 ± 0.69 (3) | 5.39 ± 0.51 (3) |
| huPA L97bG/S195A | 22.8 ± 2.98 (3) | 15.7 ± 0.58 (3) | 8.83 ± 1.28 (3) | 8.29 ± 0.36 (3) |
| huPA S195A/R217E | 0.06 ± 0.01 (3) | 1.47 ± 0.37 (3) | 1.52 ± 0.16 (3) | 2.03 ± 0.15 (3) |
| huPA L97bG/S195A/R217E | 2.85 ± 0.78 (3) | 21.4 ± 5.57 (3) | 0.46 ± 0.15 (3) | 0.35 ± 0.12 (3) |
| huPA L97bG/H99Y/S195A/R217E | 26.1 (1) | 30.93 (1) | 2.96 (1) | 20.98 (1) |
| zfuPA S195A | 2.21 ± 0.24 (3) | 5.96 ± 1.25 (3) | 0.05 ± 0.01 (3) | 0.11 ± 0.01 (3) |
| zfuPA G97bL/S195A | 2.70 ± 0.43 (3) | 6.76 ± 1.79 (2) | 0.05 ± 0.01 (3) | 0.17 ± 0.01 (3) |
| zfuPA S195A/E217R | 18.6 ± 5.14 (3) | 34.2 ± 5.54 (3) | 1.32 ± 0.15 (3) | 1.27 ± 0.08 (3) |
| zfuPA G97bL/S195A/E217R | 17.0 ± 3.12 (3) | 28.5 ± 4.35 (3) | 1.04 ± 0.22 (3) | 1.40 ± 0.21 (3) |
| zfuPA G97bL Y99H S195A E217R | 21.89 (1) | 37.06 (1) | 5.66 (1) | 5.49 (1) |
Figure 4.
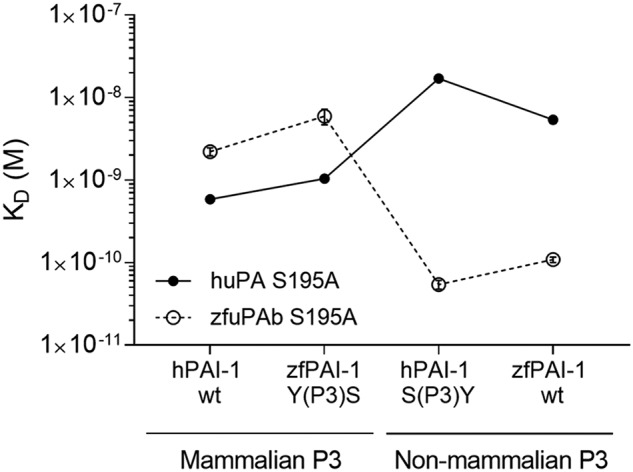
SPR analysis of uPA:PAI-1 Michaelis complex formation. To test the importance of the P3 residue of PAI-1 on species specificity in reaction with uPA, the P3 residues were exchanged between hPAI-1 and zfPAI-1. hPAI-1 WT, zfPAI-1 WT, hPAI-1 S(P3)Y, and zfPAI-1 Y(P3)S variants were tested for binding to huPA S195A (closed symbols) and zfuPA S195A (open symbols) captured on the surface of the SPR chip via specific antibody. The S195A mutation in the protease enabled the inhibitory reaction to stop at the Michaelis complex formation step. Each point represents the mean value for three individual KD determinations with standard deviation. Helper lines interconnecting the individual data point are given as visual trend guides. Representative sensorgrams with the fit are shown in Fig. S2.
Figure 5.

SPR-based screening of uPA mutants. Importance of the S3-pocket–lining residues of uPA on species specificity was tested by exchanging the residues alone or simultaneously between huPA S195A and zfuPA S195A. Created huPA variants: (A) huPA L97bG/S195A, huPA S195A/R217E, huPA L97bG/S195A/R217E, huPA L97bG/H99F/S195A/R217E, and zfuPA variants: (B) zfuPA G97bL/S195A, zfuPA S195A/E217R, zfuPA G97bL/S195A/E217R, and zfuPA G97bL/F99H/S195A/E217R were captured on the surface of the SPR chip via a specific antibody and tested for binding to hPAI-1 WT, hPAI-1 S(P3)Y, zfPAI-1 WT and zfPAI-1 Y(P3)S. Each point represents the mean of three independent KD determinations with standard deviation. Helper lines interconnecting the individual data point are given as visual trend guides. Representative sensorgrams with the fit are shown in Fig. S2.
It is seen that with all PAI-1 variants with P3 = Ser, the affinity is highest with huPA, whereas with P3 = Tyr, the affinity is highest with zfuPA. In general, substitution of the P3 residue of zfPAI-1 (Fig. 4, Table 2) with Ser conferred them with the same or almost the same affinity to huPA as hPAI-1 WT, whereas substitution of the P3 residue of hPAI-1 conferred it with the same affinity to zfuPA as zfPAI-1 WT. This observation is in full agreement with the hypothesis that the different reactivities of zfPAI-1 with huPA and zfuPA and the different reactivity of mammalian PAI-1 with huPA and zfuPA are due to the P3 residues.
On the uPA side, it is seen that mutating huPA residue 97b from Leu to Gly decreases the affinities to PAI-1 variants with P3 = Ser and in fact brings it to the same level as the affinity of zfuPA to these PAI-1 variants; the affinities to the PAI-1 variants with P3 = Tyr are only slightly affected. If we make the residue at position 217 similar to that in zebrafish, i.e. by introducing an R217E mutation into huPA S195A, it resulted in an increase in the affinity to PAI-1, independently of which residue was present in the P3 position; only with zfPAI-1 Y(P3)S did the affinity remain unchanged (Fig. 5, Table 2). When combined with the L97bG mutation, the affinity to PAI-1 variants with P3 = Tyr is strongly increased, whereas the affinity to PAI-1 variants with P3 = Ser decreased (Fig. 5, Table 2). The affinity of the L97bG R217E mutant to PAI-1 variants with P3 = Ser was at the same level as that of zfuPA, but the affinity to the PAI-1 variants with P3 = Tyr was still lower than the affinity to these variants of zfuPA S195A. Mutating an additional residue in the S3-pocket of huPA, i.e. H99F, did not improve the affinity further. We conclude that the residues present in the S3-pocket at positions 97b and 217 of huPA are major determinants of the species specificity with respect to recognition of the PAI-1 P3 residue, but that other sites may also contribute.
Mutating residues in zfuPA, we found that the affinities to the various PAI-1 variants were not at all affected by changing the 97b position of zfuPA from Gly to Leu (Fig. 5, Table 2). An E217R mutation caused an ∼10-fold decrease in affinity toward all PAI-1 variants. Humanizing position 99 did not lead to any major changes in affinity toward various PAI-1 variants (Fig. 5, Table 2). Thus, in the case of zfuPA, the lack of reactivity with human PAI-1 seems mainly to be determined by exosites, either by direct interactions or because they affect the conformation of the S3-pocket.
Species specificity of plasminogen activation by uPA
We tested the ability of human uPA to activate hμPlg and of zfuPA to activate zfμPlg. The activation process was first verified by incubation of the μPlgs and uPAs at concentrations of 2 μm and 200 nm, respectively, in the presence of 20 mm aprotinin, followed by analysis of the reaction products by SDS-PAGE under reducing conditions. As expected, incubation with uPA converted the molecular mass 29-kDa single chain μPlg to microplasmin (μPlasmin) migrating at 25 kDa molecular mass (Fig. S3). This pattern was the same with all combinations of human and zebrafish plasminogen and uPA (Fig. S3), however, the activation rate varied.
To obtain a comparable quantitative estimate of the rates of plasminogen activation, we determined the Km and kcat values for plasminogen activation, testing all combinations of uPA and μPlgs from human and zebrafish. The rate of plasminogen activation was estimated by a coupled assay, in which uPA and plasminogen were incubated with a plasmin substrate. As reflected in the kcat/Km values, a commonly used measure of the catalytic efficiency of a specific protease–substrate pair, our data reveal a strong species specificity in the recognition between uPA and plasminogen. With uPA and μPlg from the same species, the kcat/Km values are around 400 mm−1 s−1, whereas the kcat/Km values with uPA and μPlg from different species are down to roughly 1 mm−1 s−1 (Fig. 6, Table 3).
Figure 6.

Activation of μPlg by WT (A) and 97b/217 mutants (B) of huPA and zfuPA measured by coupled assay. A, importance of the P3 residue of plasminogen on species specificity was tested by exchanging the P3 residues between hμPlg and zfμPlg followed by determination of activation rates of hμPlg WT, hμPlg P(P3)F, zfμPlg WT, and zfμPlg F(P3)P by huPA WT (closed symbols) and zfuPA WT (open symbols). B, because the huPA L97bG/S195A/R217E showed reversed specificity toward the P3 residue of PAI-1 compared with huPA S195A, we have chosen huPA L97bG/R217E (closed symbols) and zfuPA G97bL/E217R (open symbols) and tested for activation of hμPlg and zfμPlg variants. The activation rate of zfμPlg F(P3)P by zfuPA G97bL/E217R (marked with *) was too slow to be measured by this method. To eliminate the effect of the plasminogen conformational state on activation rate and to focus on the active site interactions, μPlg was used instead of full-length plasminogen. Each point represents the mean value calculated from three individual kcat/Km determinations with standard deviation. Helper lines interconnecting the individual data point are given as visual trend guides.
Table 3.
kcat/Km (nm−1 s−1) of the μPlg activation by uPA
| uPA | Mammalian P3 |
Non-mammalian P3 |
||
|---|---|---|---|---|
| hμPlg WT | zfμPlg F(P3)P | hμPlg P(P3)F | zfμPlg WT | |
| huPA WT | 344.0 ± 80.0 (3) | 5.0 ± 1.1 (3) | 24.0 ± 5.0 (3) | 1.5 ± 0.2 (3) |
| huPA L97bG/R217E | 4.0 ± 0.3 (3) | 0.3 ± 0.09 (3) | 253.0 ± 9.0 (3) | 0.09 ± 0.03 (3) |
| zfuPAb WT | 1.2 ± 0.3 (3) | 25.9 ± 3.7 (3) | 16.0 ± 3.0 (3) | 468.0 ± 15.0 (3) |
| zfuPAb G97bL/E217R | 0.3 ± 0.02 (3) | 0.3 ± 0.1 (3) | NDa | 0.02 ± 0.02 (3) |
a ND, reaction rate too slow to be determined in this setup.
Substituting the P3 Pro of human μPlg with Phe, as in the P3 of zebrafish plasminogen, reduced the kcat/Km value for its activation by huPA, although not down to the same level as the kcat/Km value for activation of zfμPlg by huPA. On the other hand, the mutation enhanced its rate of activation by zfuPA. Likewise, substituting the P3 Phe of zfμPlg with a Pro, like the P3 of human plasminogen, reduced the kcat/Km value for its activation by zfuPA, although not down to the same level as the kcat/Km value for activation of zfμPlg by huPA. The mutation enhanced its rate of activation by human uPA (Table 3, Fig. 6). On this basis, we concluded that the P3 residue plays a substantial role in the species specificity in recognition of plasminogen by uPA, but that exosites also play a role.
To evaluate the effect of the residues lining the S3-pocket, we combined the substitutions at positions 97b and 217. Double mutants were chosen on the basis of the SPR experiment in which simultaneous mutation of 97b and 217 in huPA switched the specificity toward P3 residues of PAI-1 (Fig. 5). The double substitution L97bG/R217E in huPA resulted in a 100-fold reduction in the kcat/Km value activation of hμPlg WT. Interestingly, this reduction was fully compensated for by a P(P3)F substitution of hμPlg. On the other hand, the kcat/Km value for the activation of zebrafish zfμPlg remained very low, indicating that exosites are of decisive importance for the species specificity of plasminogen activation by uPA. The counterpart to the double mutant of huPA is zfuPA G97bL/E217R. This variant has lost any measurable activity toward hμPlg P(P3)F and the activity toward zfμPlg WT was 15-fold lower than the reactivity toward zfμPlg F(P3)P (Table 3, Fig. 6). The latter finding can be explained by either of two assumptions: 1) the G97bL/E217R mutation is not enough to make a Pro fit into the S3-pocket; or 2) exosite interactions dominate the inability of zfuPA to activate hμPlg. These results agreed with the relative rates of plasminogen activation, which were estimated from the gel assays (Fig. S3).
Discussion
In this report we studied the interactions between protease and its protein inhibitor uPA:PAI-1 and protease and its natural substrate uPA:plasminogen. Comparison of predicted binding interfaces from various classes of vertebrates allowed us to pinpoint co-varying positions, which may suggest coevolution of interacting proteins. The plasminogen activation system is an excellent model system to test such questions because no cofactors are known to be involved and thus the observed high affinities are attributed to direct intermolecular interactions. To test this coevolution hypothesis we produced proteins from evolutionary distant species, i.e. human and zebrafish, exchanged covarying residues between the orthologues and biochemically tested the effects of such substitutions on protein–protein interactions. Apart from answering the question about how the pairs of proteins evolved maintaining the interactions, we would like to address whether knowledge about coevolution of interacting partners could provide an insight into the fundamentals of protease–substrate and protease–inhibitor interactions. Stated simply, coevolution could be driven by what is important for these two types of interactions, i.e. resulting in co-conservation or covariation of the residues important for the interactions. Moreover, we wanted to uncover potential differences between the interaction of the classical substrate plasminogen and the substrate-mimicking inhibitor PAI-1 with the targeting proteases uPA and tPA.
Here we have demonstrated that there is a strong species specificity in the recognition of plasminogen and PAI-1 by uPA among vertebrates. For the recognition between the proteases and PAI-1, detailed molecular information is available from the known crystal structure of the human uPA:PAI-1 Michaelis complex (16) and the human tPA:PAI-1 complex (17). The structures show involvement of RCL-active site interactions as well as exosite interactions in the recognition between the proteases and the serpin. Although no consistent patterns in the variation of the residues in the positions implicated in exosite recognition between uPA and PAI-1 could be identified among different vertebrate classes, there was a clear correlation between the residues present in the P3 position of PAI-1 and the residues lining the S3-pocket of uPA supported by mutual information calculations. We therefore formed the hypothesis that at least part of the poor reactivity of huPA with zfPAI-1 and zfuPA with hPAI-1 is due to a poor fit of the P3 position of the inhibitor into the S3-pocket of the protease. For plasminogen recognition by uPA, there is no structural information available. Mutual information data suggests a similar correlation between the S3-pocket residues of uPA and the P3 residue of plasminogen compared with corresponding residues of uPA and PAI-1. Based on this information, we therefore extend our hypothesis that a mismatch between the S3-pocket of the protease and the P3 residue of the substrate is responsible for the poor reactivity of huPA toward zfμPlg and the corresponding zfuPA toward hμPlg, in a manner analogous to that of the uPA:PAI-1 interaction.
PAI-1 belongs to the serpin superfamily and is a fast and specific inhibitor of uPA and tPA. Its mechanism of action is initiated with the formation of a reversible Michaelis complex in which the RCL binds to the protease active site in a substrate-like manner, a prerequisite for the serpin's subsequent conformational change triggered by a proteolytic cleavage of the scissile bond within the RCL (23). The result of this transition is a protease covalently linked to the inhibitor with its active site irreversibly distorted and inactive. For most serpins, the initial formation of the Michaelis complex through RCL and exosite interactions is important for obtaining the specificity and the affinity needed for the proper regulation of the target proteases (24). In the regulation of the plasminogen activators by PAI-1, a tight Michaelis complex in the nanomolar range is formed. This tight interaction is protected through evolution either by conservation or coevolution of interacting residues as in the case of the P3 of PAI-1 and the S3 of uPA. Mutation of the PAI-1 P3 residue alone was enough to fully switch species specificity. In the case of uPA, mutations introduced on the human background switched the specificity toward the P3 residue of PAI-1. These observations also highlight the difference in the interaction of PAI-1 with uPA and tPA. The P3–S3 interaction does not have the same importance in the interaction with tPA, which is in agreement with the crystal structure of the Michaelis complex of PAI-1:tPA (16) and biochemical data showing that exosite interactions play a more pivotal role than in the interaction with uPA (15).
Plasminogen activation by uPA is a typical case of a rather specific protease cleaving its primary substrate. It requires efficient formation of a plasminogen:protease Michaelis complex, and an efficient catalysis reaction rate followed by a rapid dissociation of the cleavage products from the uPA active site. This, together with the fact that plasminogen can be activated by a range of proteases (24), can explain the lower impact of activation-loop composition in the reaction with uPA as compared with the serpin inhibitor. Additionally, plasminogen activation is strongly dependent on its conformational state. Full-length plasminogen adopts a so-called closed conformation, in which the N-terminal Pan-apple domain interacts with kringle 4 and 5 (25) and the activation loop is not exposed for cleavage. To expose the activation loop and thus increase the plasminogen activation rate, plasminogen has to undergo a closed to open transition. Plasminogen opening is promoted either by proteolytic removal of the Pan-apple domain or via interactions between the plasminogen kringle domains and internal lysines on target surfaces (25). In the open conformation, the activation loop is more accessible, increasing the overall rate of plasminogen activation. To eliminate the effect of plasminogen conformational states on the activation rate, we used truncated versions of plasminogen (μPlg) in which Pan-apple and all kringle domains were deleted, leaving only the linker connecting kringle 5 with the catalytic domain, the activation loop, and the catalytic domain itself (Fig. S1). This allowed us to focus on the active site interactions. Compared with the PAI-1 mutations, the μPlg P3 residue and S3–lining residues of uPA had a lower impact on the activation rate and were never sufficient to completely switch the specificity.
Taken together, our data from studying key proteins of the plasminogen activation systems clearly demonstrates that the nature of interactions between a protease and its inhibitor and the same protease and its substrate can be different. Our hypothesis is that for the inhibitor, the proteolytic cleavage of the substrate-like RCL is followed by a highly timed inhibitory mechanism that depends on a release of the protease that is slow enough for an efficient inhibitory reaction to occur (26). Cleavage of a real substrate is followed only by release of the products, making timing less crucial. Instead, it is more critical to generate enough product, in the right spatial location and when needed. All these parameters are controlled by external factors such as protein levels, expression patterns, tissue- or cell-specific localization, receptors, cofactors, stimulating signals (proteolytic cascades), etc., although this does not indicate that such parameters do not also influence the control of protease activity by designated inhibitors.
Moreover, results with plasminogen and PAI-1, respectively, show that the P3 residue of either substrate or inhibitor has changed from a large aromatic residue to a small aliphatic, hydrophilic residue. Corresponding mutations have occurred in the protease, potentially compensating for this change, but these are only to a limited extent localized in the positions making direct contact to the P3 residue, i.e. the S3-pocket. Rather, they are localized at exosites making direct contacts to substrate/inhibitor or affecting the conformation of the S3-pocket.
Experimental procedures
Database search, sequence alignment, and structural modeling
Sequences of PAI-1, uPA, tPA, and plasminogen were retrieved from the NCBI database using tBLASTn (https://blast.ncbi.nlm.nih.gov/Blast.cgi)3 (27) with human protein sequences as a query. For lungfish, the sequences were analogically identified in the de novo assembled transcriptome (28). At least one sequence of tPA, PAI-1, and plasminogen were found in each monophyletic group of vertebrates, whereas uPA was found in all groups except amphibians. To compare uPA, tPA, PAI-1, and plasminogen between vertebrate classes we first aligned protein sequences from each class separately using Clustal Omega (http://www.ebi.ac.uk/Tools/msa/clustalo/) (41) and generated consensus sequences of uPA, tPA, PAI-1, and plasminogen for each vertebrate class. Consensus sequences were then aligned (in Clustal Omega) and compared. By using consensus sequences, we compensated for the number of sequences differing among vertebrate classes.
Numbering of uPA and tPA residues was according to the standard chymotrypsin numbering scheme. Residues of the RCL of PAI-1 and plasminogen activation loops were numbered P1-Pn when located on the N-terminal and P1′–Pn′ when on the C-terminal side of the scissile bond (between the P1 and P1′). Numbers increased the further from the scissile bond residue was located. Correlated patterns of evolutionary change at specific sites were initially identified by visual inspection and confirmed by calculating mutual information, as calculated by the MISTIC server (29). Intermolecular mutual information scores were calculated pairwise between all sites between PAI-1 and uPA, plasminogen and uPA, and PAI-1 and tPA.
The homology models of zfuPA and zfPAI-1 structures were constructed using the Swiss-model platform (https://swissmodel.expasy.org/) on the template of crystal structure of human proteins (PDB ID 3PB1). All structures were visualized by the PyMol Molecular Graphics System, version 1.0r2, Schrödinger, LLC.
DNA manipulations
DNA vectors for the expression of WT hPAI-1, zfPAI-1, huPA, and zfuPA were kindly provided as described in Refs. 30 and 31. DNA vectors containing cDNA encoding WT μPlg (Fig. S1) from human and zebrafish (hμPlg and zfμPlg, respectively) were codon-optimized for expression in Escherichia coli and purchased from MWG Eurofins (Operon). For protein production, the cDNA was amplified and cloned into the pET21a E. coli expression vector (Novagen). PAI-1, uPA, and μPlg mutants were made using the QuikChange Site-directed Mutagenesis Kit (Stratagene) as described by the manufacturer, with a slight modification. For the PCR, Pfusion DNA polymerase was used (ThermoScientific). Final DNA products were amplified by transformation into E. coli DH5α cells. Mutations were verified by DNA sequencing (MWG Eurofins, Operon).
Protein production and purification
PAI-1 purification
Variants of hPAI-1 were produced and purified from E. coli BL21(DE3) pLysS (Novagen) according to a previously described protocol (30). Use of nonglycosylated hPAI-1 variants was justified as the presence of glycans does not affect the biochemical properties of hPAI-1 (23). Protein production was induced at A600 = 0.6–0.8 by addition of 1 mm isopropyl β-d-thiogalactoside. Culture was continued for 3 h at 28 °C, 200 rpm, and cells were harvested by centrifugation (30 min, 4,000 × g, 4 °C). The resulting cell pellet was resuspended in 50 mm Na2HPO4, pH 7.4, 2 m NaCl, 20 mm imidazole, frozen and thawed to facilitate cell lysis, and disrupted by sonication. The cell lysate was centrifuged (30 min at 11,000 × g, 4 °C), filtered through a nitrocellulose filter (0.45 μm; Millipore), and subjected to a two-step purification including affinity chromatography on Ni-Sepharose (GE Healthcare) followed by size exclusion chromatography using a Superdex 75 (GE Healthcare) equilibrated in 5 mm MES-HCl, pH 6.1, 1 m NaCl. This protocol resulted in high yield of hPAI-1 of at least 95% purity in a predominantly active conformation, as confirmed by SDS-PAGE and Coomassie staining.
Due to the high rate of latency transition of nonglycosylated zfPAI-1 (31), zfPAI-1 variants were produced in a suspension of HEK293-6E cells (32, 33). Purification of zfPAI-1 from the culture medium was performed according to the protocol described in Ref. 31 and included two-steps: cation exchange on SP-Sepharose (GE Healthcare) with gradient elution from 50 mm to 2 m NaCl, followed by size exclusion chromatography using a Superdex 75 equilibrated in 5 mm MES-HCl, pH 6.1, 1 m NaCl. This procedure resulted in zfPAI-1 of at least 95% purity in a predominantly latent form, as confirmed by SDS-PAGE and Coomassie staining. zfPAI-1 was activated by denaturation with 4 m guanidinium chloride supplemented with 0.1% (v/v) β-mercaptoethanol (βME) followed by extensive dialysis at 4 °C against PBS containing 0.1% (v/v) βME and final dialysis against storage buffer composed of 5 m MES, pH 6.1, 1 m NaCl.
The activity of PAI-1 variants was determined in the reaction with huPA followed by a chromogenic assay (30) and was equal to 50–80% depending on the batch. In addition to the chromogenic assays, formation of SDS-stable PAI-1:uPA complexes was tested by SDS-PAGE. To isolate active inhibitor, PAI-1 in 30 mm Hepes, pH 7.4, 135 mm NaCl, 1 mm EDTA was loaded on a anhydrotrypsin-agarose column (Molecular Innovations) equilibrated with the same buffer. PAI-1 was eluted from the column with a low pH buffer composed of 10 mm citric acid, pH 2.5, 120 mm NaCl, 1 mm EDTA. Fractions were immediately neutralized with 0.2 fraction volume of 0.5 m Na2HPO4, pH 6.6, 1 m NaCl. PAI-1 activity was confirmed in the reaction with uPA monitored by a chromogenic assay and estimated to be at least 85%.
uPA purification and activation
Variants of huPA and zfuPA were expressed in a suspension of human embryonic kidney 293-6E (HEK293-6E) cells (32, 33). The cell culture and transfection were as described for zfPAI-1. Prior uPA purification cell media was clarified by centrifugation (30 min, room temperature, 4,000 × g) followed by filtration through a nitrocellulose filter (0.22 μm, Millipore). Variants of huPA (WT and L97bG/R217E) were purified on the anti-huPA mAb clone 6 (34, 35) Sepharose column prepared by immobilization of the monoclonal antibodies on the CNBr-activated Sepharose (GE Healthcare) according to the manufacturer's protocol. huPA-containing cell medium was slowly loaded on the antibody column equilibrated with 0.1 m Tris-HCl, pH 8.1, and huPA eluted with the low pH buffer containing 0.1 m CH3COOH, pH 2.9, 1 m NaCl. Immediately after elution fractions were neutralized with 0.1 fraction volume of 1 m Tris-HCl, pH 9.0. Purification of zfuPA (WT and G97bL/E217R) was conducted according to the two-step purification protocol described in Ref. 20. In brief, cell medium was loaded on the nickel-Sepharose column equilibrated with 20 mm Na2HPO4, pH 7.5, 0.5 m NaCl, 20 mm imidazole. Variants of zfuPA eluted with 200 mm imidazole were further purified on the Superdex 75 column equilibrated with 10 mm citrate, pH 5.0, 300 mm NaCl. The SDS-PAGE of huPA and zfuPA variants confirmed homogeneity and more than 95% purity of the samples.
Purified uPA variants were predominantly in the inactive zymogen form. Prior to further analysis, uPA was activated with human plasmin. Briefly, 1 μm uPA in PBS was incubated overnight at room temperature with 4 nm human plasmin. Activation was stopped by the addition of 200 nm bovine lung aprotinin (Sigma). Enzymatically inactive uPA variants carrying the S195A mutation were not purified but activated directly in the conditioned media using the analogues protocol. Complete activation of all uPA variants was confirmed by reducing SDS-PAGE.
μPlg refolding and purification
All μPlg variants used contained an 18-amino acid N-terminal synthetic peptide facilitating expression in inclusion bodies (36), a linker connecting kringle 5 with the serine protease domain and the serine protease domain (Fig. S1). The expression, refolding, and purification protocol was according to Refs. 36 and 37 with modifications. Briefly, hμPlg variants were produced and purified in BL21(DE3) pLysS E. coli cells and zfμPlg in RosettaTM(DE3)pLysS E. coli cells. The protein production was induced with 1 mm isopropyl β-d-thiogalactoside at A600 0.6–0.8. Post-induction cell culture was continued for an additional 3 h at 37 °C, 200 rpm, and cells were harvested by centrifugation (4,500 rpm, 4 °C, for 20 min). The cell pellet was re-suspended in 50 mm Tris-HCl, pH 8.0, 0.5 m NaCl, 10% (v/v) glycerol, 1 mm EDTA, 1 mm βME and sonicated on ice for 20 min. To isolate the insoluble fraction containing inclusion bodes, the cell lysate was spun down (15,000 × g, 4 °C for 30 min) and the pellet was washed with 1) wash buffer containing 50 mm Tris-HCl, pH 8.0, 0.5 m NaCl, 10% (v/v) glycerol, 1 mm βME, 1 mm EDTA; 2) wash buffer + 1% Triton X-100; and 3) wash buffer + 0.25% Triton X-100; and 4) wash buffer. The steps after each wash included resuspension of the insoluble fraction in the buffer (50 ml/each 1 liter of bacteria culture), 30 min of gentle stirring at 4 °C, and removal of the buffer by centrifugation (15,000 × g, 4 °C, for 30 min). For solubilization, inclusion bodies were resuspended in denaturation buffer containing 50 mm Tris-HCl, pH 8.0, 100 mm NaCl, 6 mm urea, 1 mm EDTA, 10 mm βME and gently stirred overnight at 4 °C. The solubilized inclusion bodies were clarified by centrifugation (15,000 × g, 4 °C, for 30 min), diluted to a final protein concentration of 0.1–0.2 mg/ml in denaturation buffer containing 1 mm βME and refolded by stepwise removal of denaturing agents by 1) overnight dialysis at 4 °C against 50 mm Tris-HCl, pH 8.0, 3 m urea, 10% (v/v) glycerol, 1 mm βME; 2) ∼8 h dialysis at 4 °C against 50 mm Tris-HCl, pH 8.0, 10% (v/v) glycerol; and 3) overnight dialysis at 4 °C against a fresh portion of 50 mm Tris-HCl pH 8.0, 10% (v/v) glycerol. Prior to purification, refolded μPlg variants were dialyzed overnight at 4 °C against 20 mm MES, pH 6.5, and the protein solution was clarified by centrifugation (15,000 × g, 4 °C, 30 min) and filtrated through a nitrocellulose filter (0.22 μm, Millipore). The μPlg variants were purified in two steps including ion-exchange on the SP Sepharose column equilibrated with 20 mm MES, pH 6.5, and eluted with 20 mm Tris-HCl, pH 6.5, 1 m NaCl, followed by size exclusion on Superdex 75 column equilibrated with 20 mm citrate, pH 3.1, 300 mm NaCl. This procedure resulted in μPlg of more than 95% purity as confirmed by SDS-PAGE and Coomassie Blue staining.
To remove any remaining plasmin activity from the μPlg stocks, μPlg was incubated in PBS containing 1 μm diisopropylfluorophosphate (DFP) for 2 h at room temperature. After 2 h, a fresh DFP was added to final concentration 2 μm and incubated for an additional 2 h. The excess of inhibitor was removed by overnight dialysis at 4 °C against 10 mm citrate, pH 4.5, 50 mm NaCl.
Michaelis complex formation analysis using SPR
For all SPR analysis, a Biacore T200 instrument (GE Healthcare) was used. CM5 chip (GE Healthcare) was prepared as follows: mAb anti-huPA clone 6 or polyclonal antibodies anti-zfuPA (in-house)4 were immobilized in both flow cells to the level of 5000 response units at pH 4.5 using the manufacturer's protocol for amine coupling. The anti-huPA mAb recognizes an epitope outside the serine protease domain and does not affect the protease activity (35, 38). All experiments were performed in PBS, pH 7.4, supplemented with 0.1% bovine serum albumin (BSA) and 0.05% Tween 20 at 25 °C with the flow rate 30 μl/min. Between the runs the chip was fully regenerated with injections of low pH buffer composed of 10 mm glycine, 0.5 m NaCl, pH 2.4.
To determine kinetics constants of the Michaelis complex formation, 50 response units of an inactive protease mutant carrying the S195A mutation was captured on a single flow cell and one PAI-1 concentration from 2-fold dilution series (0.2 to 100 nm) was injected to both flow cells. Nonspecific binding was removed from the raw binding curves by subtraction of signal from the reference cell of the parallel experiment performed without protease. Buffer injection was also subtracted from all binding curves. Association was monitored for 90 s of constant inhibitor injection, and dissociation for 300 s of constant buffer injection. For determination of kinetic parameters, a 1:1 binding model was used to fit the binding curves in the Biacore T200 Evaluation Software (GE Healthcare).
The μPlg activation gel assay
To confirm that the reaction between μPlg and plasminogen activators results in μPlasmin generation and to compare the ability of the different proteases to activate μPlgs, the reaction products were analyzed by SDS-PAGE. For the assay, 2 μm μPlg was incubated with 200 nm activator in the presence of 20 μm bovine lung aprotinin at 37 °C, pH 7.4. At each time point (0, 5, 10, 20, 30, 60, and 120 min) the reaction was stopped by transferring a 30-μl aliquot of the reaction mixture to the tube containing hot reducing SDS-PAGE sample buffer. Samples were analyzed by SDS-PAGE with Coomassie Blue staining. Intensities of the bands referring to μPlg and μPlasmin were measured in GelAnalyzer software. The fraction of μPlg at each time point was calculated from the total intensity of the bands referring to μPlg and μPlasmin.
Km and kcat determination of μPlg
All of the experiments were carried out in 10 mm Hepes, pH 7.4, 140 mm NaCl supplemented with 0.1% BSA and performed at 37 °C, in the Multiskan GO (ThermoScientific) ELISA plate reader. The determination of kinetic constants for μPlg activation was performed according to the protocol described in Refs. 39 and 40, with slight modifications. Briefly, a 2-fold serial dilution of the DFP-treated μPlg was made in the 96-well plate. The H-d-Val-Leu-Lys-pNA·2HCl (S-2251TM) plasmin substrate (Chromogenix) was then added to each well to a final concentration 50 μm and the reaction was started by the addition of uPA to a final concentration of 0.1 nm. For each μPlg variant, a control without uPA was made by combining μPlg with S-2551TM only in the same volume and concentration as for the assay with the uPA. The reaction was followed by absorbance measurements at 405 nm in real time. The initial velocities (Vi) were determined by fitting the parabolic equation, A405 = (Vi × t2) + b, where t refers to time and b is a constant value, to the initial measurements for A405 < 0.3 × Amax. The kinetic constants were determined by constructing a Michaelis-Menten plot.
Author contributions
A. J., J. B. M., A. C.-M., D. M. D., A. C., and S. C. L. data curation; A. J., S. C. L., and J. K. J. formal analysis; A. J. and F. P. investigation; A. J., J. B. M., and S. C. L. methodology; A. J., S. C. L., and J. K. J. writing-original draft; E.-M. F. writing-review and editing; S. C. L. software; S. C. L. validation; J. K. J. supervision; J. K. J. project administration.
Supplementary Material
Acknowledgments
Christine R. Schar is thanked for comments and careful editing of the manuscript. We are sorry to report that our dear colleague and friend, Prof. Peter A. Andreasen, passed away during this project. We honor his memory.
This work was supported by The Danish Research Council. The authors declare that they have no conflicts of interest with the contents of this article.
This article contains Figs. S1–S3.
Please note that the JBC is not responsible for the long-term archiving and maintenance of this site or any other third party hosted site.
A. Jendroszek, J. B. Madsen, A. Chana-Munoz, D. M. Dupont, A. Christensen, F. Panitz, E-M. Fuchtbauer, S. C. Lovell, and J. K. Jensen, unpublished data.
- uPA
- urokinase
- PAI-1
- plasminogen activator inhibitor-1
- tPA
- tissue-type plasminogen activator
- RCL
- reactive center loop
- EGR-cmk
- H-Glu-Gly-Arg-chloromethylketone
- MI
- mutual information
- μPlg
- microplasminogen
- huPA
- human uPA
- hPAI-1
- human PAI-1
- hμPlg
- human μPlg
- zfuPA
- zebrafish uPA
- zfPAI-1
- zebrafish PAI-1
- zfμPlg
- zebrafish μPlg
- SPR
- surface plasmon resonance
- μPlasmin
- microplasmin
- βME
- β-mercaptoethanol
- SPD
- serine protease domain
- HEK293-6E
- human embryonic kidney 293-6E cells
- DFP
- diisopropylfluorophosphate
- PDB
- Protein Data Bank.
References
- 1. Harms M. J., and Thornton J. W. (2013) Evolutionary biochemistry: revealing the historical and physical causes of protein properties. Nat. Rev. Genet. 14, 559–571 10.1038/nrg3540 [DOI] [PMC free article] [PubMed] [Google Scholar]
- 2. Hedstrom L. (2002) Serine protease mechanism and specificity. Chem. Rev. 102, 4501–4524 10.1021/cr000033x [DOI] [PubMed] [Google Scholar]
- 3. Andreasen P. A., Kjøller L., Christensen L., and Duffy M. J. (1997) The urokinase-type plasminogen activator system in cancer metastasis: a review. Int. J. Cancer 72, 1–22 [DOI] [PubMed] [Google Scholar]
- 4. Robbins K. C., Summaria L., Hsieh B., and Shah R. J. (1967) The peptide chains of human plasmin: mechanism of activation of human plasminogen to plasmin. J. Biol. Chem. 242, 2333–2342 [PubMed] [Google Scholar]
- 5. Robbins K. C., Bernabe P., Arzadon L., and Summaria L. (1973) NH2-terminal sequences of mammalian plasminogens and plasmin S-carboxymethyl heavy (A) and light (B) chain derivatives: a re-evaluation of the mechanism of activation of plasminogen. J. Biol. Chem. 248, 7242–7246 [PubMed] [Google Scholar]
- 6. Ding L., Coombs G. S., Strandberg L., Navre M., Corey D. R., and Madison E. L. (1995) Origins of the specificity of tissue-type plasminogen activator. Proc. Natl. Acad. Sci. U.S.A. 92, 7627–7631 10.1073/pnas.92.17.7627 [DOI] [PMC free article] [PubMed] [Google Scholar]
- 7. Madison E. L., Coombs G. S., and Corey D. R. (1995) Substrate specificity of tissue type plasminogen activator: characterization of the fibrin independent specificity of t-PA for plasminogen. J. Biol. Chem. 270, 7558–7562 10.1074/jbc.270.13.7558 [DOI] [PubMed] [Google Scholar]
- 8. Coombs G. S., Dang A. T., Madison E. L., and Corey D. R. (1996) Distinct mechanisms contribute to stringent substrate specificity of tissue-type plasminogen activator. J. Biol. Chem. 271, 4461–4467 10.1074/jbc.271.8.4461 [DOI] [PubMed] [Google Scholar]
- 9. Andreasen P. A., Georg B., Lund L. R., Riccio A., and Stacey S. N. (1990) Plasminogen activator inhibitors: hormonally regulated serpins. Mol. Cell. Endocrinol. 68, 1–19 10.1016/0303-7207(90)90164-4 [DOI] [PubMed] [Google Scholar]
- 10. Stein P., and Chothia C. (1991) Serpin tertiary structure transformation. J. Mol. Biol. 221, 615–621 10.1016/0022-2836(91)80076-7 [DOI] [PubMed] [Google Scholar]
- 11. Kaslik G., Kardos J., Szabó E., Szilágyi L., Závodszky P., Westler W. M., Markley J. L., and Gráf L. (1997) Effects of serpin binding on the target proteinase: global stabilization, localized increased structural flexibility, and conserved hydrogen bonding at the active site. Biochemistry 36, 5455–5464 10.1021/bi962931m [DOI] [PubMed] [Google Scholar]
- 12. Im H., and Yu M. H. (2000) Role of Lys335 in the metastability and function of inhibitory serpins. Protein Sci. 9, 934–941 10.1110/ps.9.5.934 [DOI] [PMC free article] [PubMed] [Google Scholar]
- 13. Lee C., Park S. H., Lee M. Y., and Yu M. H. (2000) Regulation of protein function by native metastability. Proc. Natl. Acad. Sci. U.S.A. 97, 7727–7731 10.1073/pnas.97.14.7727 [DOI] [PMC free article] [PubMed] [Google Scholar]
- 14. Huntington J. A. (2011) Serpin structure, function and dysfunction. J. Thromb. Haemost. 9, 26–34 10.1111/j.1538-7836.2011.04360.x [DOI] [PubMed] [Google Scholar]
- 15. Ibarra C. A., Blouse G. E., Christian T. D., and Shore J. D. (2004) The contribution of the exosite residues of plasminogen activator inhibitor-1 to proteinase inhibition. J. Biol. Chem. 279, 3643–3650 10.1074/jbc.M310601200 [DOI] [PubMed] [Google Scholar]
- 16. Lin Z., Jiang L., Yuan C., Jensen J. K., Zhang X., Luo Z., Furie B. C., Furie B., Andreasen P. A., and Huang M. (2011) Structural basis for recognition of urokinase-type plasminogen activator by plasminogen activator inhibitor-1. J. Biol. Chem. 286, 7027–7032 10.1074/jbc.M110.204537 [DOI] [PMC free article] [PubMed] [Google Scholar]
- 17. Gong L., Liu M., Zeng T., Shi X., Yuan C., Andreasen P. A., and Huang M. (2015) Crystal structure of the Michaelis complex between tissue-type plasminogen activator and plasminogen activators inhibitor-1. J. Biol. Chem. 290, 25795–25804 10.1074/jbc.M115.677567 [DOI] [PMC free article] [PubMed] [Google Scholar]
- 18. Lovell S. C., and Robertson D. L. (2010) An integrated view of molecular coevolution in protein-protein interactions. Mol. Biol. Evol. 27, 2567–2575 10.1093/molbev/msq144 [DOI] [PubMed] [Google Scholar]
- 19. Spraggon G., Phillips C., Nowak U. K., Ponting C. P., Saunders D., Dobson C. M., Stuart D. I., and Jones E. Y. (1995) The crystal structure of the catalytic domain of human urokinase-type plasminogen activator. Structure 3, 681–691 10.1016/S0969-2126(01)00203-9 [DOI] [PubMed] [Google Scholar]
- 20. Bager R., Kristensen T. K., Jensen J. K., Szczur A., Christensen A., Andersen L. M., Johansen J. S., Larsen N., Baatrup E., Huang M., Ploug M., and Andreasen P. A. (2012) Urokinase-type plasminogen activator-like proteases in teleosts lack genuine receptor-binding epidermal growth factor-like domains. J. Biol. Chem. 287, 27526–27536 10.1074/jbc.M112.369207 [DOI] [PMC free article] [PubMed] [Google Scholar]
- 21. Jones D. T., Buchan D. W., Cozzetto D., and Pontil M. (2012) PSICOV: precise structural contact prediction using sparse inverse covariance estimation on large multiple sequence alignments. Bioinformatics 28, 184–190 10.1093/bioinformatics/btr638 [DOI] [PubMed] [Google Scholar]
- 22. Hopf T. A., Scharfe C. P., Rodrigues J. P., Green A. G., Kohlbacher O., Sander C., Bonvin A. M., and Marks D. S. (2014) Sequence co-evolution gives 3D contacts and structures of protein complexes. Elife 3, e03430 10.7554/eLife.03430 [DOI] [PMC free article] [PubMed] [Google Scholar]
- 23. Dupont D. M., Madsen J. B., Kristensen T., Bodker J. S., Blouse G. E., Wind T., and Andreasen P. A. (2009) Biochemical properties of plasminogen activator inhibitor-1. Front. Biosci. (Landmark Ed) 14, 1337–1361 [DOI] [PubMed] [Google Scholar]
- 24. Miles L. A., Greengard J. S., and Griffin J. H. (1983) A comparison of the abilities of plasma kallikrein, β-factor XIIa, factor XIa and urokinase to activate plasminogen. Thromb. Res. 29, 407–417 10.1016/0049-3848(83)90244-X [DOI] [PubMed] [Google Scholar]
- 25. Law R. H., Abu-Ssaydeh D., and Whisstock J. C. (2013) New insights into the structure and function of the plasminogen/plasmin system. Curr. Opin. Struct. Biol. 23, 836–841 10.1016/j.sbi.2013.10.006 [DOI] [PubMed] [Google Scholar]
- 26. Blouse G. E., Perron M. J., Kvassman J. O., Yunus S., Thompson J. H., Betts R. L., Lutter L. C., and Shore J. D. (2003) Mutation of the highly conserved tryptophan in the serpin breach region alters the inhibitory mechanism of plasminogen activator inhibitor-1. Biochemistry 42, 12260–12272 10.1021/bi034737n [DOI] [PubMed] [Google Scholar]
- 27. Altschul S. F., Gish W., Miller W., Myers E. W., and Lipman D. J. (1990) Basic local alignment search tool. J. Mol. Biol. 215, 403–410 10.1016/S0022-2836(05)80360-2 [DOI] [PubMed] [Google Scholar]
- 28. Jendroszek A., Søonnichsen M. S., Muñoz A. C., Leyman K., Christensen A., Petersen S. V., Wang T., Bendixen C., Panitz F., Andreasen P. A., and Jensen J. K. (2017) Latency transition of plasminogen activator inhibitor type 1 is evolutionarily conserved. Thromb. Haemost. 117, 1688–1699 10.1160/TH17-02-0102 [DOI] [PubMed] [Google Scholar]
- 29. Simonetti F. L., Teppa E., Chernomoretz A., Nielsen M., and Marino Buslje C. (2013) MISTIC: mutual information server to infer coevolution. Nucleic Acids Res. 41, W8–W14 10.1093/nar/gkt427 [DOI] [PMC free article] [PubMed] [Google Scholar]
- 30. Jensen J. K., Wind T., and Andreasen P. A. (2002) The vitronectin binding area of plasminogen activator inhibitor-1, mapped by mutagenesis and protection against an inactivating organochemical ligand. FEBS Lett. 521, 91–94 10.1016/S0014-5793(02)02830-2 [DOI] [PubMed] [Google Scholar]
- 31. Bager R., Johansen J. S., Jensen J. K., Stensballe A., Jendroszek A., Buxbom L., Sørensen H. P., and Andreasen P. A. (2013) Protein conformational change delayed by steric hindrance from an N-linked glycan. J. Mol. Biol. 425, 2867–2877 10.1016/j.jmb.2013.05.007 [DOI] [PubMed] [Google Scholar]
- 32. Tom R., Bisson L., and Durocher Y. (2008) Transfection of HEK293-EBNA1 cells in suspension with linear PEI for production of recombinant proteins. CSH Protoc. 2008, pdb prot4977 [DOI] [PubMed] [Google Scholar]
- 33. Tom R., Bisson L., and Durocher Y. (2008) Culture of HEK293-EBNA1 cells for production of recombinant proteins. CSH Protoc. 2008, pdb prot4976 [DOI] [PubMed] [Google Scholar]
- 34. Grøndahl-Hansen J., Ralfkiaer E., Nielsen L. S., Kristensen P., Frentz G., and Danø K. (1987) Immunohistochemical localization of urokinase- and tissue-type plasminogen activators in psoriatic skin. J. Invest. Dermatol. 88, 28–32 10.1111/1523-1747.ep12464827 [DOI] [PubMed] [Google Scholar]
- 35. Petersen H. H., Hansen M., Schousboe S. L., and Andreasen P. A. (2001) Localization of epitopes for monoclonal antibodies to urokinase-type plasminogen activator: relationship between epitope localization and effects of antibodies on molecular interactions of the enzyme. Eur. J. Biochem. 268, 4430–4439 10.1046/j.1432-1327.2001.02365.x [DOI] [PubMed] [Google Scholar]
- 36. Medynski D., Tuan M., Liu W., Wu S., and Lin X. (2007) Refolding, purification, and activation of miniplasminogen and microplasminogen isolated from E. coli inclusion bodies. Protein Expr. Purif. 52, 395–402 10.1016/j.pep.2006.10.012 [DOI] [PubMed] [Google Scholar]
- 37. Hong Z., De Meulemeester L., Jacobi A., Pedersen J. S., Morth J. P., Andreasen P. A., and Jensen J. K. (2016) Crystal structure of a two-domain fragment of hepatocyte growth factor activator inhibitor-1: functional interactions between the Kunitz-type inhibitor domain-1 and the neighboring polycystic kidney disease-like domain. J. Biol. Chem. 291, 14340–14355 10.1074/jbc.M115.707240 [DOI] [PMC free article] [PubMed] [Google Scholar]
- 38. Christensen L., Wiborg Simonsen A. C., Heegaard C. W., Moestrup S. K., Andersen J. A., and Andreasen P. A. (1996) Immunohistochemical localization of urokinase-type plasminogen activator, type-1 plasminogen-activator inhibitor, urokinase receptor and α2-macroglobulin receptor in human breast carcinomas. Int. J. Cancer 66, 441–452 [DOI] [PubMed] [Google Scholar]
- 39. Chibber B. A., Morris J. P., and Castellino F. J. (1985) Effects of human fibrinogen and its cleavage products on activation of human plasminogen by streptokinase. Biochemistry 24, 3429–3434 10.1021/bi00335a006 [DOI] [PubMed] [Google Scholar]
- 40. Ellis V., Scully M. F., and Kakkar V. V. (1987) Plasminogen activation by single-chain urokinase in functional isolation: a kinetic study. J. Biol. Chem. 262, 14998–15003 [PubMed] [Google Scholar]
- 41. Li W., Cowley A., Uludag M., Gur T., McWilliam H., Squizzato S., Park Y. M., Buso N., and Lopez R. (2015) The EMBL-EBI bioinformatics web and programmatic tools framework. Nucleic Acids Res. 43, W58–W584 [DOI] [PMC free article] [PubMed] [Google Scholar]
Associated Data
This section collects any data citations, data availability statements, or supplementary materials included in this article.