Abstract
In the multimodal lateral cortex of the inferior colliculus (LCIC) there are two neurochemically and connectionally distinct compartments, termed modular and extra modular zones. Modular fields span LCIC layer 2 and are recipients of somatosensory afferents, while encompassing extra modular domains receive auditory inputs. Recently in developing mice we identified several markers (among them glutamic acid decarboxylase, GAD) that consistently label the same modular set, as well as a reliable extra modular marker, calretinin, (CR). Previous reports from our lab show similar modular-extra modular patterns for certain Eph-ephrin guidance members, although their precise alignment with the developing LCIC neurochemical framework has yet to be addressed. Here we confirm in the nascent LCIC complementary GAD/CR-positive compartments, and characterize the registry of EphA4 and ephrin-B2 expression patterns with respect to its emerging modular-extra modular organization. Immunocytochemical approaches in GAD67-GFP knock-in mice reveal patchy EphA4 and ephrin-B2 domains that precisely align with GAD-positive LCIC modules, and are complementary to CR-defined extra modular zones. Such patterning was detectable neonatally, yielding discrete compartments prior to hearing onset. A dense plexus of EphA4-positive fibers filled modules, surrounding labeled ephrin-B2 and GAD cell populations. The majority of observed GABAergic neurons within modular boundaries were also positive for ephrin-B2. These results suggest an early compartmentalization of the LCIC that is likely instructed in part through Eph-ephrin guidance mechanisms. The overlap of developing LCIC neurochemical and guidance patterns is discussed in the context of its seemingly segregated multimodal input-output streams.
Keywords: inferior colliculus, Eph, ephrin, guidance, modularity, multimodal, patch-matrix, immunocytochemistry, RRID: AB_2619710, RRID:AB_2099371, RRID:AB_2095679, RRID:AB_2095700, RRID:AB_2278725
1. INTRODUCTION
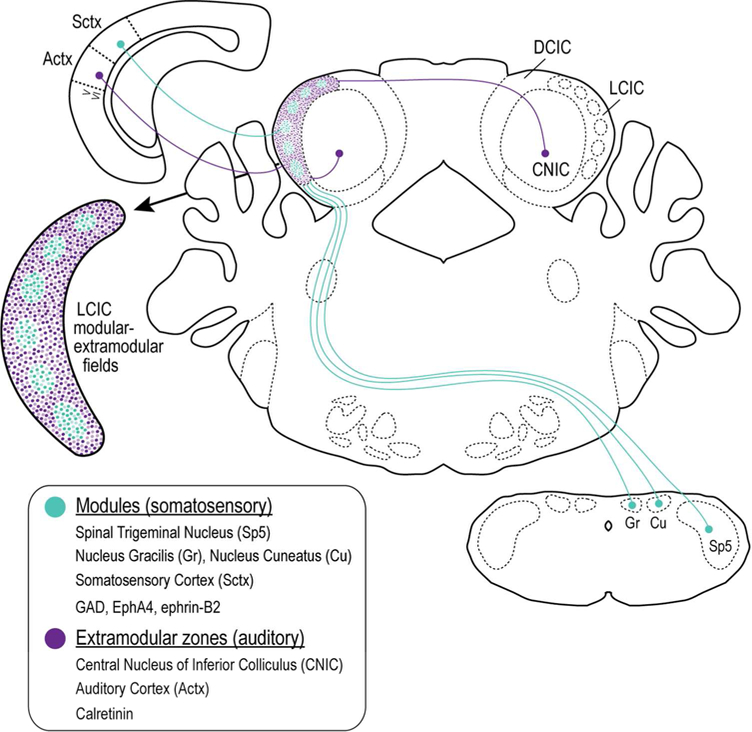
The midbrain inferior colliculus (IC) is a major relay hub, receiving a rich array of ascending and descending connections. Its central nucleus (CNIC) is the recipient of tonotopic inputs of ascending lemniscal origin, whereas source and input type to surrounding shell regions are highly varied, converging from multiple levels and systems (Chen et al., 2018). Afferents to its lateral cortex (LCIC) are multimodal in nature (Tokunaga et al., 1984; Coleman and Clerici, 1987; Saldaña and Merchán, 1992; Saldaña et al., 1996; Winer et al., 1998; Loftus et al., 2008; Stebbings et al., 2014; Lesicko et al., 2016), suggesting an integrative role for this particular IC subdivision (Aitkin et al., 1978; Casseday and Covey, 1996; Jain and Shore, 2006; Gruters and Groh, 2012; Chen et al., 2018). Fundamental to understanding its functionality is an appreciation for the orderly arrangement of its multisensory inputs, such that modality-specific projections target distinct aspects of its segregated modular-extra modular framework (Lesicko et al., 2016; Chen et al., 2018). Somatosensory inputs arising from cortex and major brainstem nuclei exhibit a series of discontinuous patchy or modular terminal fields that span LCIC layer 2 (Wiberg and Blomqvist, 1984; Zhou and Shore, 2006). In contrast, cortical afferents of auditory origin, aswell as projections from the IC itself, appear complementary, targeting surrounding extra modular domains that dominate LCIC layers 1 and 3 (Winer et al., 1998; Stebbings et al., 2014; Lesicko et al., 2016).
Details concerning how LCIC compartments are organized and the manner in which they develop into their adult configuration have received little attention to date. LCIC modular fields are readily identifiable in the adult with a host of neurochemical stains, including acetylcholinesterase (AChE), cytochrome oxidase (CO), glutamic acid decarboxylase (GAD), and nicotinamide adenine dinucleotide phosphate-diaphorase (NADPH-d), and appear highly conserved across species (Chernock et al., 2004). These markers have similar patterns and are largely overlapping, highlighting a singular modular set throughout the LCIC. Modular confines are also present in adult mouse (Stebbings et al., 2014; Lesicko et al., 2016), despite initial reports to the contrary (Chernock et al., 2004), and exhibit precise marker alignment early in development (Dillingham et al., 2017). Modular compartments, while not readily identifiable at birth, become discernible by postnatal day 4 and increasingly apparent in the LCIC with age. Furthermore, in contrast to the host of modular markers, calretinin (CR) staining is conspicuously absent from developing modules, specifically labeling surrounding extra modular zones (Dillingham et al., 2017). These complementary modular-extra modular patterns in neonatal mice suggest an early LCIC compartmentalization, and likely compartment-specific projections that are established over a similar developmental period.
Although the mechanisms that instruct the segregation of LCIC neurons and their connections into discrete modular-extra modular compartments have yet to be established, studies from our laboratory implicate certain members of the Eph-ephrin guidance family as playing a potential role. In particular, EphA4 and ephrin-B2 are transiently expressed in the developing LCIC during the period that its micro-organization is seemingly shaped. These two guidance molecules, while belonging to different subfamilies, are known to exhibit strong binding affinities for each other (Gale et al., 1996; Bergemann et al., 1998). Their expression patterns, unlike their characteristic gradients in the neighboring CNIC, are discrete and consist of a discontinuous series of concentrated patches (Gabriele et al., 2011; Cramer and Gabriele, 2014; Wallace et al., 2016), reminiscent of the emerging LCIC neurochemical modularity. Despite temporal and spatial similarities in these patterns, it remains unknown how these guidance patterns interface with its developing modular-extra modular framework. The present study utilizes a GAD67-GFP knock-in mouse line to enable easy visualization of developing LCIC modules and shows a precise overlap with EphA4 and ephrin-B2 expression patterns. As anticipated, their alignment with modular compartments is complementary to CR-defined extra modular zones. Specific neuronal populations with distinct neurochemical and guidance signatures are identified within modules and discussed with respect to developing LCIC compartments and its multimodal afferent-efferent systems.
2. MATERIALS AND METHODS
2.1. Animals
Experiments were performed on approximately equal numbers of male and female C57BL/6J (n=11, Jackson laboratories, Bar Harbor, ME) and GAD67-GFP transgenic mice (n=49). C57BL/6J control mice were used in pilot single-labeling experiments to verify antibody specificity and to determine optimal dilutions in neonatal tissue (data not shown) that then informed the design of the presented multiple-labeling studies. Knock-in GAD67-GFP (Δ neo) mice (C57BL/6J background) with cDNA encoding enhanced GFP inserted into the GAD67 promoter were utilized to enable easy visualization of inhibitory, GABAergic neurons. Generation of this strain is described elsewhere (Tamamaki et al., 2003; permission granted by Dr. Yuchio Yanagawa, Gunma University Graduate School of Medicine, Gunma, Japan; breeding pairs kindly provided by Dr. Peter Brunjes, University of Virginia, Charlottesville, VA, USA). Equally spaced developmental stages beginning at birth (postnatal day 0, 4, 8, 12) were examined leading up to hearing onset (P12). For initial experimentation, a few mice were also examined post-hearing (P14) to confirm clearly segregated and complementary modular (GAD) and extra modular (CR) patterns, similar to that previously described for other marker combinations (e.g. NADPH-d and CR, Dillingham et al., 2017). A minimum of four mice were used at each age for each experimental group. Procedures were performed in accordance with National Institutes of Health Guide for Care and Use of Laboratory Animals (NIH Publication No.80–23, revised 1996). All protocols also received prior approval by the Institutional Animal Care and Use Committe (Protocol No. A14–15 and A18–15).
2.2. Perfusion and tissue sectioning
Mice were administered a lethal dose of ketamine (200 mg/kg) and xylazine (20 mg/kg) and transcardially perfused with a physiological rinse (0.9% NaCl, 0.5% NaNO2 in dH2O), followed by 4% paraformaldehyde (pH 7.4) alone, and then in solution with 10% sucrose. Brains were removed and post-fixed overnight at 4°C (4% paraformaldehyde / 10% sucrose). Finally, tissue was allowed to equilibrate in a final cryoprotective solution of 4% paraformaldehyde with 30% sucrose. Brains were blocked coronally, keeping tissue from the caudal extreme of the IC to rostral extent of the midbrain. Sections were cut at 50µm with a sliding freezing microtome and collected in 0.1M phosphate buffered saline (PBS, pH 7.4).
2.3. Fluorescence immunohistochemistry
Free-floating sections were rinsed three times in PBS for 10 min, blocked in either 5% normal donkey serum (NDS) or normal horse serum (NHS) for 30 min (serum determined by species of secondary antibody), and then incubated in primary antibody solution (anti-CR, made in rabbit, 1:250, CR 7697, Swant, RRID:AB_2619710; anti-EphA4, made in goat, 1:40, AF641, R&D Systems, RRID:AB_2099371; anti-ephrin-B2, made in goat, 1:30, AF496, R&D Systems, RRID:AB_2095679; anti-ephrin-B2, made in rabbit, 1:200, sc-15397, Santa Cruz Biotechnology, RRID:AB_2095700) for 40 min at room temperature. Sections were then placed at 4°C and agitated overnight.
For double-labeling combinations (CR & EphA4, CR & ephrin-B2, ephrin-B2 & EphA4), a directly conjugated secondary antibody was utilized for visualization of the first primary (either CR or ephrin-B2; made in rabbit), in concert with a biotinylated-streptavidin detection system for the second primary (EphA4 or ephrin-B2; made in goat; refer to Table 1). Following the initial antibody incubation, tissue was allowed to equilibrate to room temperature for 20 min and then rinsed three times with PBS. A secondary antibody with an Alexa Fluor 350 conjugate (anti-rabbit, made in donkey, 1:25, A10039, Thermo Fisher Scientific, RRID:AB_2534015) was applied for 1.5 hours, rinsed three times in PBS and blocked with NHS for 30 min. The next primary antibody was then added and shaken at room temperature for 40 min prior to being placed at 4°C overnight. On the final day of processing, tissue was again allowed to equilibrate to room temperature and rinsed three times in PBS prior to application of a species-specific biotinylated secondary antibody (biotinylated anti-goat, made in horse, 1:600, BA-9500, Vector Laboratories, RRID:AB_2336123; biotinylated anti-rabbit, made in horse, 1:600, BA-1100, Vector Laboratories, RRID:AB_2336201) for 1 hour. Next the tissue was rinsed with PBS three times, incubated with a streptavidin fluorescent conjugate (DyLight 549 streptavidin, 1:200, SA-5549, Vector Laboratories) for 2 hours and rinsed three final times. For single-labeling cases in GAD67-GFP mice, only biotinylated-streptavidin signal amplification was employed using either a streptavidin Alexa Fluor 350 conjugate (1:200, S11249, Thermo Fisher Scientific) for CR cases, or the previously mentioned DyLight 549 streptavidin for EphA4 or ephrin-B2 cases. Following processing, sections were mounted on charged slides and coverslipped with ProLong Diamond anti-fade mountant (P-36970, Thermo Fisher Scientific).
TABLE 1. Antibody Information.
| Antibody name | Structure of immunogen | Manufacturer info. | Concentration used |
|---|---|---|---|
| Anti-calretinin | Recombinant human calretinin containing a 6-his tag at the N-terminal |
Swant, CR 7697, RRID: AB_2619710, rabbit, polyclonal |
1:250 |
| Anti-EphA4 | Mouse myeloma cell line NS0-derived recombinant mouse EphA4 Val20-Thr547 |
R&D Systems, AF641, RRID:AB_2099371, goat, polyclonal |
1:40 |
| Anti-ephrin-B2 | Mouse myeloma cell line NS0-derived recombinant mouse ephrin-B2 Arg27-Ala227 |
R&D Systems, AF496, RRID:AB_2095679, goat, polyclonal |
1:30 |
| Anti-ephrin-B2 | Ephrin-B2 (H-83) is raised against amino acids 168- 235 of ephrin-B2 of human origin |
Santa Cruz, sc-15397, RRID:AB_2095700, rabbit, polyclonal |
1:200 for double-labeling cases with EphA4 |
| Anti-GAD67 | Clone 1G10.2, Recombinant GAD67 protein, reacts with the 67kDa isoform |
MilliporeSigma, MAB5406, RRID:AB_2278725, mouse, monoclonal |
1:100 |
| Alexa Fluor 350 donkey anti- rabbit IgG |
IgG recognizes both heavy and light chains from rabbit |
Thermo Fisher Scientific, A10039, RRID:AB_2534015, donkey |
1:25 |
| Biotinylated horse anti-goat IgG |
IgG recognizes both heavy and light chains from goat |
Vector Laboratories, BA-9500, RRID:AB_2336123, horse |
1:600 |
| Biotinylated horse anti-rabbit IgG |
IgG recognizes both heavy and light chains from rabbit |
Vector Laboratories, BA-1100, RRID:AB_2336201, horse |
1:600 |
| Biotinylated Mouse on Mouse (M.O.M.) Anti- Mouse IgG |
IgG designed specifically to localize mouse primary antibodies on mouse tissue |
Vector Laboratories, BMK-2202, RRID:AB_2336833, mouse |
1:250 as per M.O.M. kit staining protocol |
Multiple-labeling immunocytochemical experiments in the lateral cortex of the inferior colliculus in GAD67-GFP mice reveal patchy EphA4 and ephrin-B2 expression that overlaps with its modular-extra modular neurochemical compartments. This registry is apparent at birth and and throughout the early postnatal period, providing a framework for its multimodal input-output arrays.
Control GAD67 immunocytochemistry experiments in GAD67-GFP mice used a monoclonal mouse anti-GAD67 antibody (clone 1G10.2, 1:100, MAB5406, MilliporeSigma, RRID:AB_2278725) and necessarily employed a Species-On-Species Detection Kit (Mouse on Mouse [M.O.M.] Basic Kit, BMK-2202, Vector Laboratories, RRID:AB_2336833) to distinguish between the primary antibody made in mouse and endogenous mouse IgGs present in the tissue. The Vector M.O.M. immunodetection kit staining procedures were followed closely, including recommended decreases in primary and secondary antibody incubation times as well as abbreviated PBS rinses.
2.4. Image acquisition, sampling, and quantification
Widefield image capturing was performed on a Nikon TE2000 microscope (Nikon, Melville, NY) equipped with a Hamamatsu ORCA-Flash 4.0 V3 sCMOS monochrome camera for fluorescence imaging of separate channels (Hamamatsu, Bridgewater, NJ) using PlanApo 10x, 20x, and 40x objectives (NA = 0.45, 0.75, and 0.95 respectively). Filter sets (Chroma Technology, Bellows Falls, VT) were designed with careful attention to the spectra of the various fluorophores to ensure no bleed through between channels. An extended depth of field (EDF) algorithm was used to generate two-dimensional images from acquired Z-stacks (Elements Software; Nikon). The Nikon Elements EDF module facilitates merging captured Z-stack images together into one, using only the focused regions for each frame.
Confocal images were acquired on a Nikon C2si laser scanning microscope, using a PlanApo 60x (1.40NA) objective. Fluorophores in the blue, green, and red channels were excited with a 405 nm diode laser, the 488 nm line of an Argon Ion laser, and a 561 nm solid-state laser, respectively; they were detected on separate PMTs with 447/60, 525/50, and 561LP filters, respectively. The blue channel was imaged separately from the other channels to minimize spectral bleed-through; green and red channels showed no spectral cross-talk and were thus imaged simultaneously. A digital scanning zoom was performed to achieve a resolution of 0.10 µm/pixel and images were acquired with 2x averaging to reduce noise. Confocal images are presented as maximum intensity Z-projections of selected slices from acquired Z-stacks. The maximum projection algorithm picks, for each pixel, the greatest value across the entire stack.
ImageJ software (NIH, Bethesda, MD) was used to sample LCIC labeling in raw, uncompressed images. Only the mid-rostrocaudal third of the LCIC was analyzed where modular-extra modular organization was most readily apparent. Channels of merged images were separated and converted to grayscale in ImageJ. A freehand tool with specified line thicknesses (set to optimize modular sampling, normally an ImageJ line thickness around 100, or approximately 75–100 µm, but varied with age) was used to sample from ventral-to-dorsal along LCIC layer 2 contours, bisecting GAD-positive modules. A region of interest (ROI) function was utilized to duplicate the exact sampling contour in each of the separated channels. Sampling data for multiple channels was compiled to generate plot profiles illustrating brightness patterns of various labels with respect to each other. Alignment of periodic EphA4 and ephrin-B2 with GAD-positive modular fields was motivation for running double-labeling experiments for these two guidance molecules simultaneously in these mice.
Auto- and cross-correlation functions were performed as previously described (Fathke and Gabriele, 2009). Autocorrelation analysis of each profile revealed signal periodicities. Abscissa locations of salient off-origin autocorrelation function peaks suggested possible profile periods. The off-origin maxima of individual channel autocorrelation functions assess the strength of periodicity for each channel (1.0 ⇒ perfect periodic signal matching, 0 ⇒ no detectable periodic signal matching, −1.0 ⇒ perfect inverted periodic signal matching). Locations of peak values >0.5 were considered as candidate signal component periods. The biological significance of each candidate period was then validated by direct inspection of the original labeled distribution pattern; confirming that observed discontinuous staining patterns agreed with calculated profile periodicities. Autocorrelation analyses revealed average periods at each of the examined ages (n ≥ 4 sections from multiple mice per grouping).
Cross-correlation analysis of brightness profile pairs investigated their relative spatial alignment. The maxima of cross-correlation functions between two channel signals assess the degree to which those two signals overlap and with what relative shift that overlap occurs. Prominent cross-correlation maxima were consistently observed at the origin, indicating significant profile pattern alignment with no spatial shift relative to each other. This y-intercept value served as a metric for comparing at various developmental stages the degree of signal overlap. Again, an n ≥ 4 sections from multiple mice was used for each analysis. Similar to autocorrelation analysis, values near 1.0 indicate precise signal matching; those > 0.5 indicate strong signal matching. Statistical comparisons of autocorrelation maxima and period length, as well as cross-correlation y-intercept values were made using independent, two-tailed Student’s t-tests assuming unequal variance (type 3) with statistical significance (p < 0.05).
3. RESULTS
3.1. Confirmation that GAD-GFP neurons are GAD-positive in the IC
To validate that GAD67-GFP neurons are indeed GAD-positive in the neonatal IC, knock-in mice at two weeks postnatal were immunostained for GAD67. GAD-GFP and GAD labeling were abundant throughout the IC with overlapping expression patterns (Figure 1a-c). In contrast to rather homogeneous CNIC GAD distributions, discrete modular cell clusters were evident dominating LCIC layer 2 (Figure 1c, dashed contours). Although low magnification widefield images (Figure 1a-c) give the appearance that certain cells may be single-labeled, higher resolution confocal imaging confirms neuronal colocalization of GAD67-GFP and GAD67 immunostaining throughout the IC as anticipated (Figure 1a-c insets i, ii, iii).
Figure 1.

Colocalization of GAD67-GFP (green) and GAD67 immunostaining (red) in IC neurons in a P14 knock-in mouse. Separate channels (a, b) and corresponding digital merge (c) of a mid-rostrocaudal IC section at low magnification reveal overlapping patterns. CNIC patterns appear homogeneous, unlike observed modular clustering in the LCIC (c, dashed contours). High magnification confocal images show representative double-labeled IC neurons (a-c insets, i, ii, iii). Arrowheads in (c) highlight the position of depicted neurons: (i) in a dorsal LCIC module, (ii) in a ventral LCIC module, and (iii) in the CNIC. Scale bars in (a-c) = 200µm, (i-iii) = 10µm.
3.2. Complementary modular and extramodular neurochemical marker patterns in pre- and post-hearing mice
GAD67-GFP mice at birth (P0) and postnatal day 14 (P14) were stained for calretinin to assess the organization of developing modular-extra modular LCIC zones in pre- and post-hearing mice. Previous reports from our lab in C57BL/6J mice using brightfield approaches (Dillingham et al., 2017) identified GAD (modular) and CR (extra modular) as reliable developmental markers of the emerging LCIC microarchitecture. GABAergic cells are present throughout the newborn LCIC, including substantial labeling throughout layer 2 (Figure 2a). In comparison, CR-positive extra modular fields are more readily discernable at birth, surrounding presumptive layer 2 modules devoid of labeling (Figure 2b, dashed contours). At two weeks postnatal, clustering of GAD-positive neurons into distinct modules is evident (Figure 2d), with CR-extra modular zones even more defined due to clear intermodular bridges linking layer 1 and 3 labeling (Figure 2e, brackets). Digital merges at the two stages show primitive LCIC compartments at birth that become increasingly demarcated with age (Figure 2c, f, dashed contours). This early postnatal progression of complementary GAD-CR staining is in keeping with that previously described for another modular marker, NADPH-d, and its immature arrangement at birth that sharpened with CR-defined extra modular zones with age (Dillingham et al., 2017).
Figure 2.
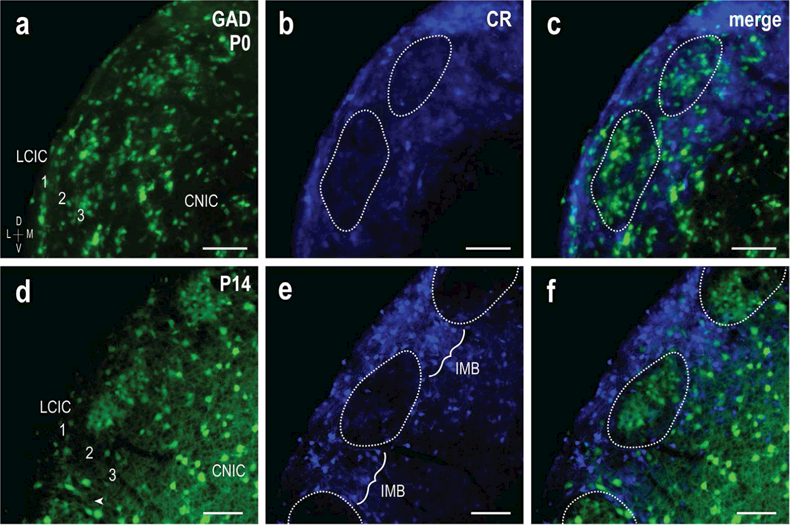
Complementary GAD and CR LCIC patterns in pre- and post-hearing mice. GAD-positive LCIC modules (green) with complementary CR-labeling (blue) are evident at birth (a-c) and even more prominent by P14 (d-f). At P0, GAD modules appear less apparent, although primitive clustering is evident within layer 2 (a). CR labeling at this age is concentrated in layers 1 and 3 and already exhibits an extra modular pattern (b, dashed contours), surrounding primitive GAD clusters (c). At P14, the complementary organization is further sharpened, with distinct GAD layer 2 modules (d) encompassed by CR expression (e, f, dashed contours). At this later stage, CR-positive intermodular bridges linking layers 1 and 3 (e, IMB) are present, further delineating modular boundaries. Scale bars in (a-c) = 50µm, (d-f) = 100µm.
3.3. Early registry of EphA4 with GAD-positive LCIC modules
EphA4 expression in the neonatal rodent LCIC appears as a discontinuous network of patches (Gabriele et al., 2011; Cramer and Gabriele, 2014; Wallace et al., 2016), consistent with that described for a series of neurochemical modular markers (Dillingham et al., 2017). To determine the relative alignment of this guidance molecule with developing LCIC modules, EphA4 staining was performed at four postnatal stages in GAD67-GFP mice leading up to hearing onset (P0, 4, 8, and 12; Figure 3a-l). This window was chosen as it appears that converging LCIC multimodal afferents are initially shaped during this early postnatal period (Noftz et al., 2014; Balsamo and Gabriele, 2015; Lamb-Echegaray et al., 2018). As mentioned above, GAD-specific modules are not readily apparent at birth (Figure 3a), although EphA4 labeling at this stage is strong and highly localized into concentrated patches (Figure 3b). At subsequent ages (Figure 3d-l), clustering of GABAergic neurons in layer 2 becomes increasingly defined, while EphA4 labeling remains prominent up to hearing onset. Merges of the separate channels (Figure 3f, i, l) reveal striking overlap of GAD and EphA4-positive compartments (dashed contours). Although a few positive somata were encountered, EphA4 labeling consisted predominantly of a dense plexus of fibers concentrated within LCIC layer 2 modules, surrounding cellular voids occupied in part by the defined GABAergic neuronal population.
Figure 3.
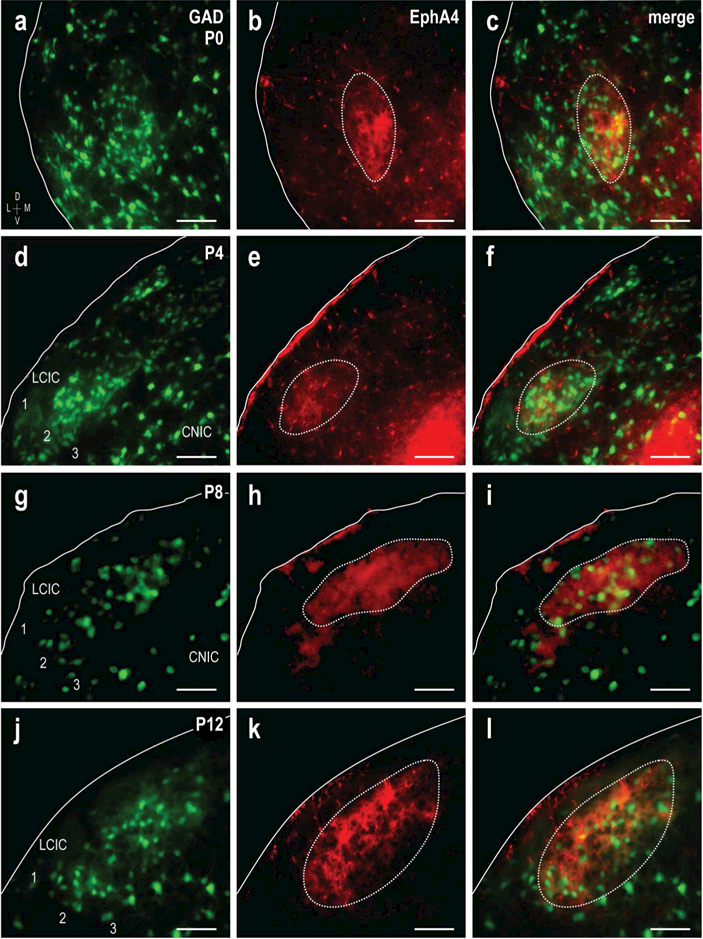
Developmental progression of GAD/EphA4 modular overlap. GAD (green) and EphA4 (red) expression at P0 (a-c), P4 (d-f), P8 (g-i) and P12 (j-l). GAD layer 2 modules are present at all ages (a, d, g, j), becoming more obvious by hearing onset (j). EphA4 modules (b, e, h, k, dashed contours) are easily discernible at all ages and restricted to layer 2. Digital merges (c, f, i, l) show precision of EphA4 and GAD modular overlap (dashed contours). EphA4 labeling was consistent with a dense plexus of fibers and presumptive terminals, surrounding many of the GAD-positive modular neurons. Scale bars = 50µm.
Sampling of GAD and EphA4 channels yielded brightness profile plots that show an early precision of overlapping periodic signals that persists over the developmental period examined (Figure 4a-h). Brightness peaks (Figure 4b, d, f, and h, arrows) coincide with domains along the LCIC layer 2 contour most concentrated with GAD/EphA4 labeling (Figure 4a, c, e, and g, dashed contours). Autocorrelation analyses suggest highly periodic signals (maxima > 0.5) for both channels at each of the examined ages (no statistical difference between channel periodicity for each age, p > 0.05; average periodicity strength for combined channels at P0 = 0.644 ± 0.118, P4 = 0.684 ± 0.075; P8 = 0.676 ± 0.109, P12 = 0.549 ± 0.132). The average period length for the two channels at each of the ages was not significantly different from each other (p > 0.05). However, the average period length at the two earlier stages was significantly shorter than that at the older ages (P0 & P4 = 180.26 ± 50.18µm, P8 & P12 = 235.73 ± 47.96µm; p = 0.004), likely due in part to continued growth of the IC as a whole during this period.
Figure 4.
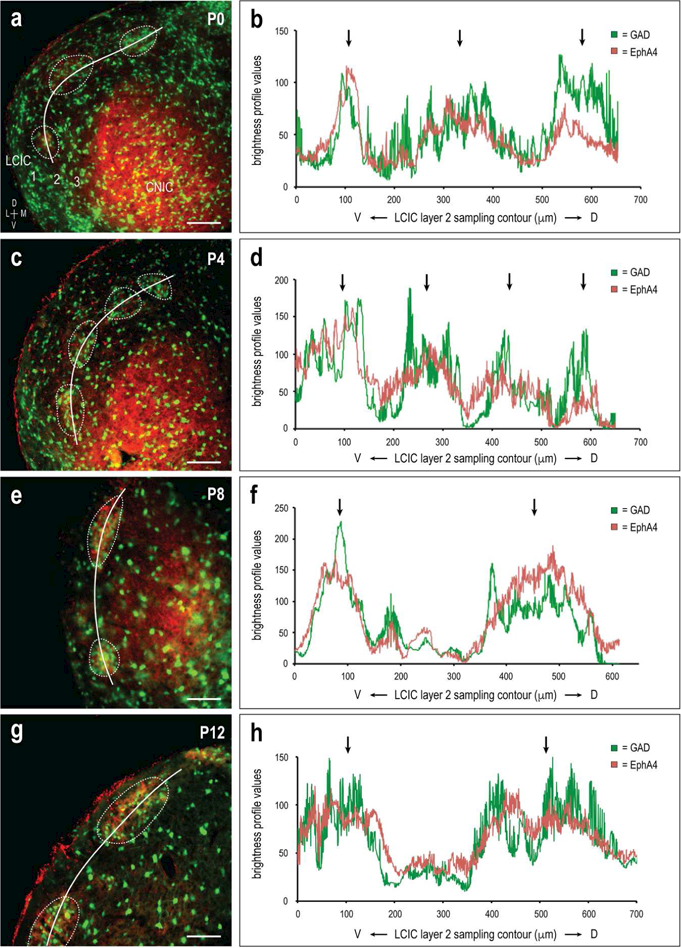
Early periodic and aligned GAD/EphA4 LCIC patterns. Developmental images (a, c, e, and corresponding brightness plot profiles (b, d, f, h) for GAD (green) and EphA4 (red) expression in the mid-rostrocaudal LCIC. Signal fluctuations are periodic and in-phase (arrows), highlighting overlap of GAD and EphA4 signals. Autocorrelation analyses revealed strong periodic signals for both channels (periodicity > 0.5) at each of the ages with no statistically significant difference between ages (p > 0.05). Period length was also not significantly different between GAD and EphA4 at each age (p > 0.05), but was shown to significantly increase from P0/P4 to P4/P8 (p < 0.5). Cross-correlation functions assessing relative overlap for the two channels with zero spatial shift was strong at each of the ages ( > 0.5), with no significant change (p > 0.5) across ages. White curves (a, c, e, g) indicate trajectory of LCIC layer 2 sampling. Dashed contours highlight layer 2 modules corresponding to peaks in adjacent brightness plot profiles (arrows). Scale bars in (a, c, e, g) = 100µm.
The qualitative observation that GAD and EphA4 labeling and corresponding waveforms are overlapping was assessed utilizing a cross-correlation function. At each postnatal age, cross-correlation values with zero spatial shift with respect to the two signal components was strong (cross-correlation y-intercept values > 0.5; averages at P0 = 0.636 ± 0.149, P4 = 0.627 ± 0.014; P8 = 0.674 ± 0.124, P12 = 0.551 ± 0.134), indicating registry of EphA4 patterns with developing modular fields. Paired t-test between each of the ages suggest no significant difference regarding strength of overlap of the two signals over the developmental period examined.
3.4. GAD-EphA4 modularity is complementary to calretinin expression
Two ages, P4 and P8, were further examined to directly test if indeed EphA4 staining that aligns with GAD-positive modules, is complementary to extra modular CR labeling as anticipated. These time points were chosen as P4 is the first to exhibit distinct GAD modular staining and CR intermodular bridging, as well as the fact that P4-P8 appears based on preliminary findings to be the period that much of the initial targeting of LCIC compartments by converging input arrays takes place. Figure 5 shows a magnification series (a-d, e-h, i-l) of a representative P4 case for each of the separate channels (GAD = green, EphA4 = red, CR = blue), as well as digital merges. At low magnification, GAD and EphA4 appear patchy and co-localized within the LCIC, and seemingly non-overlapping with CR-defined extra modular zones (Figure 5d). This observation is confirmed at higher magnifications (Figure 5h, l), where periodic EphA4 and GAD labeling is seen across the ventrolateral-to-dorsomedial extent of the LCIC (Figure 5h, arrowheads), largely surrounded by CR staining.
Figure 5.
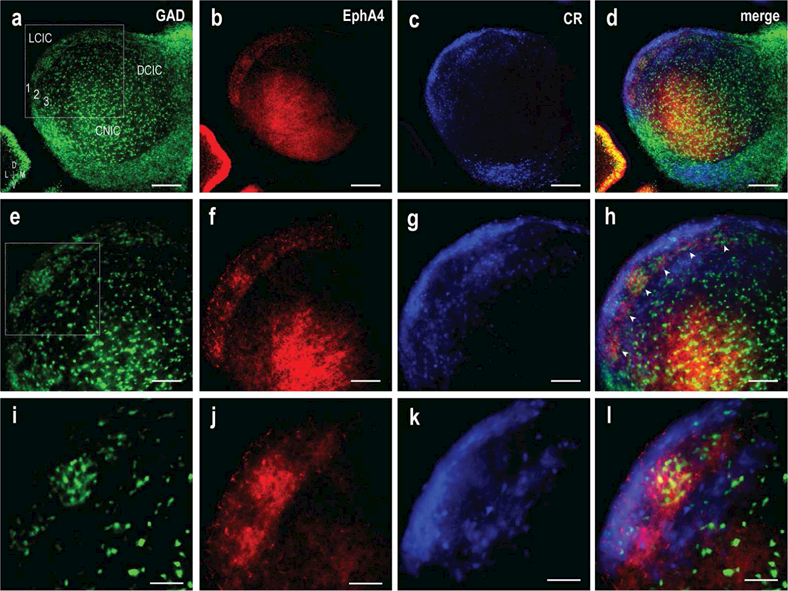
Alignment of EphA4 with GAD and complementary CR expression at P4. LCIC magnification series (a-d, e-h, i-l) of separate channels (GAD = green, EphA4 = red, CR = blue) with digital merges. Inset boxes in (a) and (e) shown at higher magnification in subsequent rows. LCIC patterning is readily apparent at low magnification (a-d), with clear discontinous EphA4 modules that occupy CR voids. GAD clustering into layer 2 modules is more easily observed at higher magnification (e-h, i-l), as is the fibrous-like appearance of EphA4 labeling, in contrast to cellular GAD and CR staining. At depicted mid-rostrocaudal LCIC level, upwards of six developing GAD/EphA4-positive modules (h, arrowheads) are observed situated amongst surrounding extra modular CR labeling. Scale bar in (a-d) = 200 µm, (e-h) = 100 µm, (i-l) = 50 µm.
Similar expression patterns were observed at P8 (Figure 6a, b), such that EphA4 and GAD expression patterns overlap as a series of layer 2 patches (Figure 6b, arrowheads). CR-labeling again selectively highlights extra modular zones, encompassing GAD/EphA4-positive compartments. While GAD-positive cells exhibit preferential clustering within LCIC modules, they are also evident throughout the CNIC and DCIC, as well as layers 1 and 3 of the LCIC itself.
Figure 6.
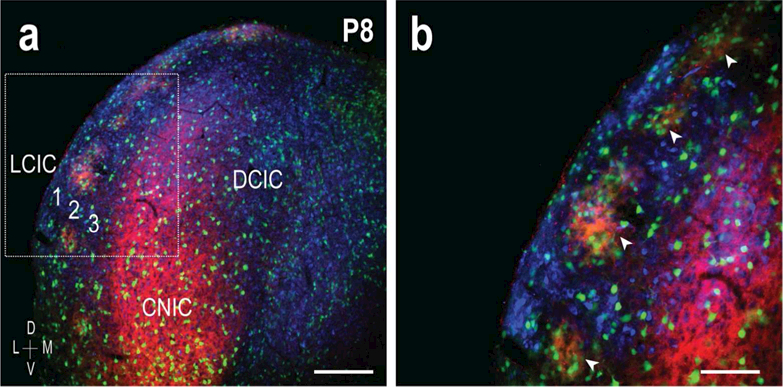
EphA4 registry with developing LCIC neurochemical framework at P8. LCIC digital merges (GAD = green, EphA4 = red, CR = blue) at low (a) and high magnification (b, inset box in a). Similar to P4, multiple GAD/EphA4-positive modules are readily apparent spanning LCIC layer 2 (b, arrowheads), with surrounding complementary CR extra modular labeling. Scale bar in (a) = 200 µm and (b) = 100 µm.
3.5. Ephrin-B2 alignment with developing LCIC compartmental framework
Much like EphA4, ephrin-B2 is expressed in the nascent LCIC and exhibits a pattern consistent with that of modular labeling (Gabriele et al., 2011; Cramer and Gabriele, 2014; Wallace et al., 2016). A series of experiments analogous to the presented EphA4 studies was performed for ephrin-B2 in GAD67-GFP mice at the same postnatal ages (Figure 7). GAD-positive modules are not readily apparent to the eye at birth, due to significant labeling in layers 1 and 3 that diminishes with age (Figure 7a). Similar to EphA4, ephrin-B2 is present at P0 and highly localized, forming patchy areas within layer 2 (Figure 7b, dashed contour). Discrete ephrin-B2 compartments remain striking throughout the period leading up to hearing onset, and match GAD-positive modules (Figure 7d-l, dashed contours). Unlike the observed fibrous EphA4 labeling, ephrin-B2 expression consisted mostly of positive cell bodies with a bit of surrounding neuropil labeling. Inspection at higher magnification suggested the GABAergic cell population was also largely positive for ephrin-B2.
Figure 7.
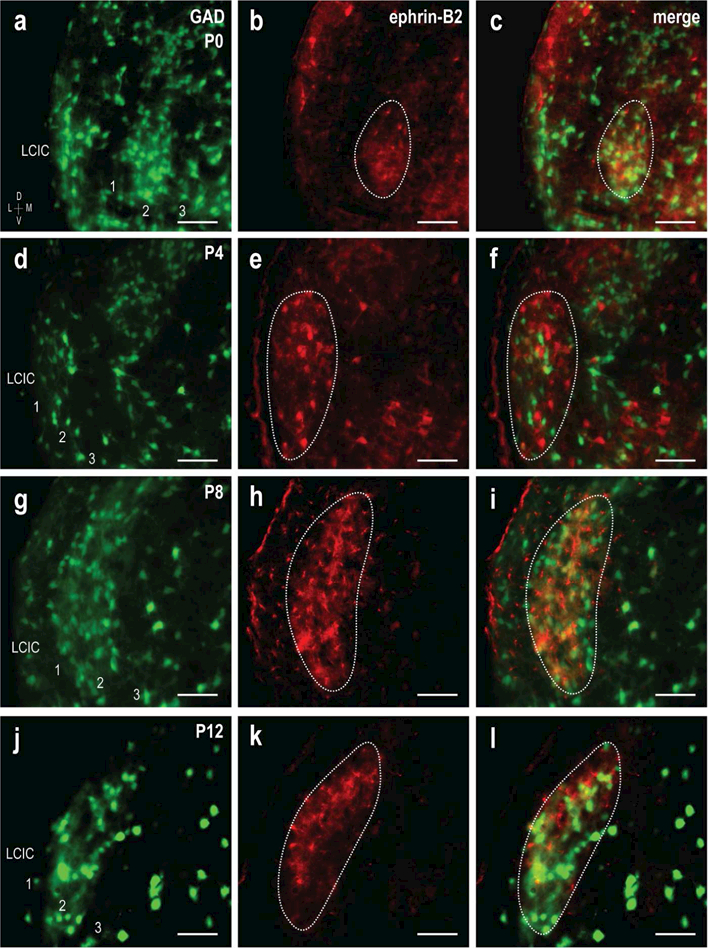
Development of GAD/ephrin-B2 modular overlap. GAD (green) and ephrin-B2 (red) expression at P0 (a-c), P4 (d-f), P8 (g-i) and P12 (j-l). GAD modules again become increasingly more apparent with age (a, d, g, j). Ephrin-B2 modules (b, e, h, k, dashed contours) are easily discernible at all ages and highly localized to layer 2, similar to EphA4. Digital merges (c, f, i, l) show spatial registry of GAD and ephrin-B2 patterns (dashed contours). Scale bars = 50µm.
Brightness profiles generated from LCIC layer 2 sampling of GAD and ephrin-B2 labeling reveal periodic signal components that are matching, and relatively in-phase with each other (Figure 8). Peaks in raw sampling data for each of the channels align (Figure 8b, d, f, and h, arrows) and correlate with patches of concentrated GAD and ephrin-B2 expression (Figure 8a, c, e, and g, dashed contours). Overlap of the two signals is striking throughout this early postnatal period (Figure 8a-h), indicating an early precision of guidance patterns with the developing LCIC micro-organization. Autocorrelation analysis suggests strong periodicity for both GAD and ephrin-B2 labeling (maxima > 0.5, no statistical difference between channel periodicity for each age, p > 0.05; average periodicity strength for combined channels at P0 = 0.527 ± 0.064, P40.627 ± 0.095; P8 = 0.617 ± 0.080, P12 = 0.712 ± 0.070). Periodicity strength at P0 was significantly weaker than that at each of the older ages (P0/P4 p = 0.038, P0/P8 p = 0.023, P0/P12 p = 2.68 × 10⁻⁵). Similar to EphA4, average period length for the two channels at each of the ages was not significantly different from each other (p > 0.05). Again, the average period length at the two earlier stages was significantly shorter than that at the older ages (P0 & P4 =147.62 ± 60.70µm, P8 & P12 = 267.41 ± 58.38µm; p = 3.13 × 10⁻⁶). Cross-correlation values with no offset of the two waveforms (y-intercept of cross-correlation function) at each of the stages was again strong ( > 0.5; averages at P0 = 0.579 ± 0.133, P4 = 0.554 ± 0.070; P8 = 0.609 0.099, P12 = 0.715 ± 0.089), indicating spatial overlap of strengthening ephrin-B2 patterns with the emerging LCIC modularity.
Figure 8.
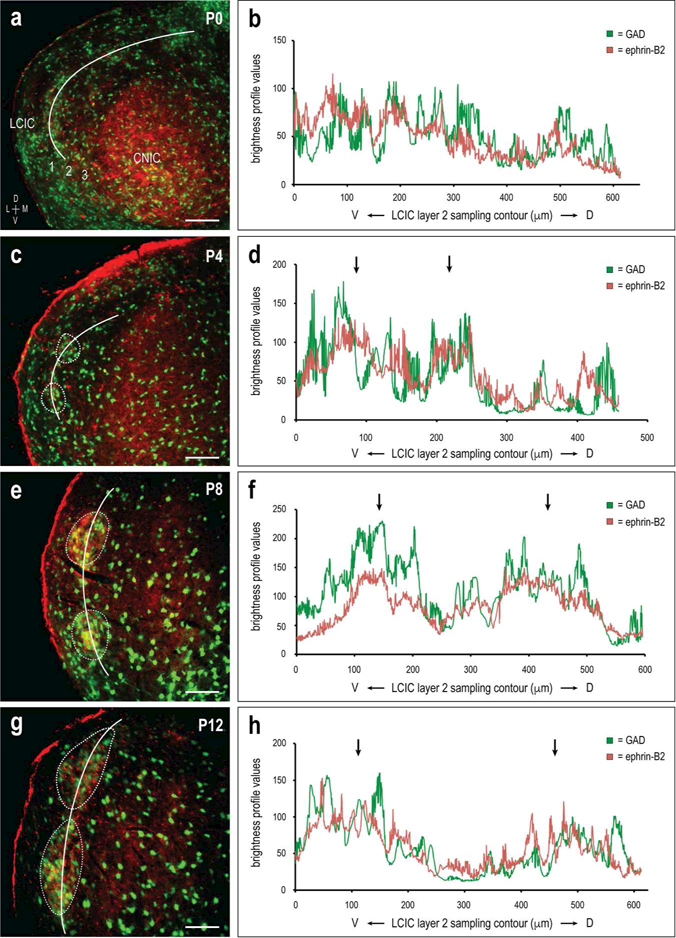
Ontogeny of alignment of GAD/ephrin-B2 LCIC patterns. Developmental images (a, c, e, g) and corresponding brightness plot profiles (b, d, f, h) for GAD (green) and ephrin-B2 (red) expression in the mid-rostrocaudal LCIC. Signals are periodic and in-phase especially at the three older stages (c, e, g, dashed contours; d, f, h, arrows), while statistically weaker at birth (a, b). Period length was not significantly different between GAD and ephrin-B2 at each age (p > 0.05), but was shown to significantly increase from P0/P4 to P4/P8 (p < 0.5). Cross-correlations were strong at each of the ages (> 0.5), with a trend of more precise overlap with age. White curves (a, c, e, g) indicate trajectory of LCIC layer 2 sampling. Dashed contours highlight layer 2 modules corresponding to peaks in adjacent brightness plot profiles (arrows). Scale bars in (a, c, e, g) = 100µm.
3.6. Spatial mismatch of GAD/ephrin-B2 and CR patterns
Double-labeling experiments for ephrin-B2 and CR were performed in GAD67-GFP mice at P4 and P8 (Figure 9) to assess registry of ephrin-B2 with the emerging modular-extra modular LCIC substrate. As anticipated, ephrin-B2-positive modules aligned with layer 2 GAD clusters at P4, encircled by extra modular CR labeling (Figure 9a-c). This arrangement became further sharpened by P8, such that complementary GAD/ephrin-B2 and CR patterning was easily distinguishable (Figure 9d-f). Higher magnification images show discrete modular zones (Figure 9e, arrowheads, 9f, dashed contour) delimited by surrounding CR labeling. Once again GAD-positive cells were seen throughout neighboring IC subdivisions and sporadically outside LCIC modular confines.
Figure 9.
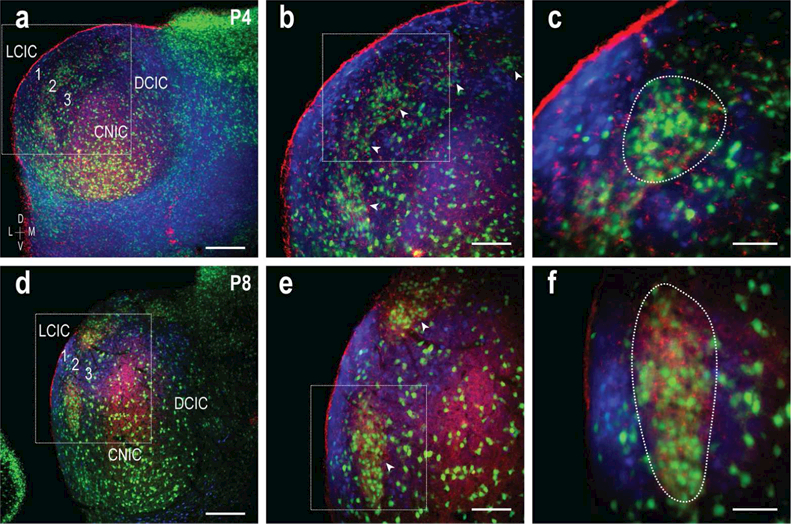
Ephrin-B2 alignment with LCIC modularity at P4 and P8. LCIC magnification series of digital merges (GAD = green, ephrin-B2 = red, CR =blue) in a P4 (a-c) and P8 (d-f) mouse. Inset boxes in (a, b; d, e) are shown at higher magnification in (b; e) and (c; f) respectively. At P4, multiple GAD/ephrin-B2-positive modules span LCIC layer 2 (b, arrowheads), with complementary CR labeling. A similar arrangement is seen at P8, with increasing clarity of the emerging guidance and neurochemical framework (e, arrowheads). A single ephrin-B2 module is highlighted for each of the ages (c, f, dashed contours). Scale bars in (a, d) = 200 µm, (b, e) = 100 µm, and (c, f) = 50 µm.
3.7. Distinct EphA4 and ephrin-B2 expression within LCIC modules
As both EphA4 and ephrin-B2 exhibit consistent modular labeling complementary to CR extra modular zones, experiments labeling both guidance proteins simultaneously in GAD67-GFP mice were undertaken to explore the possibility that different modular cell populations express unique molecular signatures. Confocal imaging within an individual module at P4 (Figure 10b-e) was performed following identification at lower magnification with wide field fluorescence (Figure 10a). This approach enabled greater resolution at the cellular level, confirming the previously stated fibrous nature of EphA4 labeling, and contrasting ephrin-B2 cell body staining. The dense plexus of EphA4 labeling (Figure 10c) surrounded lacunae occupied by single- (GAD or ephrin-B2) or double-labeled neurons (GAD and ephrin-B2; Figure 10e, arrowheads). The majority of encountered GAD neurons within modular zones were also positive for ephrin-B2, although there were many ephrin-B2 cells that were GAD-negative. Despite an abundance of labeled cells, some voids were still evident in the EphA4 network that were unoccupied, likely housing another unique yet to be identified neuronal population.
Figure 10.

Cellular examination of GAD/EphA4/ephrin-B2 modular spatial registry. Triple-labeling (GAD = green, EphA4 = red, ephrin-B2 = blue) showing low magnification overview along with higher magnification (a, inset box) confocal images (b, c, d, e) at P4. In contrast to GAD (b) and ephrin-B2 (d) somata labeling, EphA4 expression consists of a dense, punctate fibrous network (c). Most modular GAD neurons are also ephrin B2 positive, and surrounded by EphA4 labeling (compare b-e, arrowheads). However, there are several single-labeled ephrin-B2 modular neurons present that are also situated in EphA4 lacunae. Scale bars (a) = 100µm, (b-e) = 15µm.
3.8. EphA4 and ephrin-B2 overlap throughout rostrocaudal extent of LCIC
While the present study focused primarily on the mid-rostrocaudal extent of the LCIC where the modular-extra modular arrangement is most evident, cases combining EphA4 and ephrin-B2 labeling were also characterized along the rostrocaudal extent of the LCIC (Figure 11). Co-localization of EphA4 and ephrin-B2 patterns with GAD-positive domains that was observed and quantified mid-rostrocaudally remained consistent throughout the span of the LCIC. Whereas distinct patches or modules were the norm in representative midpoint sections, guidance labeling in more caudal aspects exhibited bridges linking adjacent modules (Figure 11a). This regional variation is consistent with GAD distributions in this area, as well as that previously described for another modular marker, NADPH-d (Dillingham et al., 2017). EphA4 and ephrin-B2 expression in the rostral LCIC and intercollicular nuclei again matched GAD patterns, where modular compartments merge while taking up a deeper, more medial position (Figure 11d).
Figure 11.
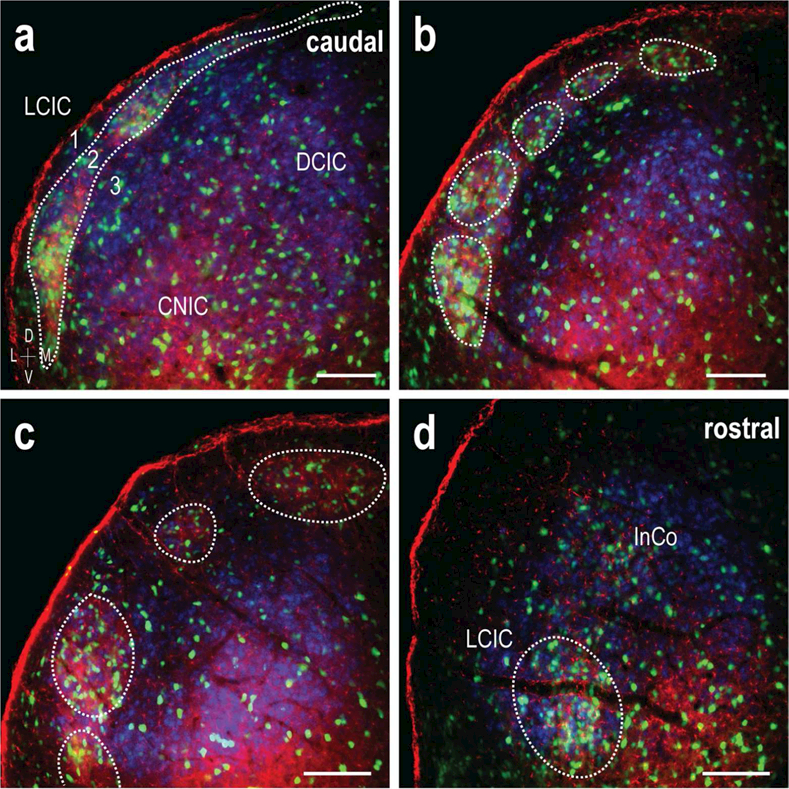
Caudal to rostral overlap of GAD/EphA4/ephrin-B2 patterning. LCIC triple-labeling (GAD = green, EphA4 = red, ephrin-B2 = blue) throughout the caudorostral extent of the LCIC (a-d). Caudally, modules are interconnected (a), appearing as a strip along layer 2. In the mid-rostrocaudal zones the discontinuous modular morphology is most readily apparent (b, c), prior to converging and taking up a deeper position in the rostral extreme (d). Matching of GAD, EphA4, and ephrin B2 LCIC patterns is consistent throughout the caudorostral dimension. The observed shape changes are consistent with that previously described for other modular markers (Dillingham et al., 2017). Scale bars (a-d) = 100µm.
4. DISCUSSION
In this study we examined the developmental expression of two guidance molecules with known binding affinities for each other (Gale et al., 1996; Bergemann et al., 1998), EphA4 and ephrin-B2, and their registry with previously described neuro chemical LCIC compartments (Dillingham et al., 2017). Both proteins are highly expressed during the early postnatal period and exhibit a series of characteristic patches, consistent with LCIC layer 2 modular zones. These guidance patterns align with the emerging modular-extra modular framework, and display an early precision highlighted by experiments combining CR-staining in GAD67-GFP mice. Quantification methods show highly periodic signals at each of the ages with strong matching of profile waveforms (GAD/EphA4 and GAD/ephrin-B2 overlap). Matching of EphA4 and ephrin-B2 with GAD-positive modules was strong over the developmental period studied. Whereas EphA4 and ephrin-B2 both consistently exhibit modular patterning, EphA4 label is fibrous and punctate in its appearance, while ephrin-B2 was more cellular. Ephrin-B2-positive somata were numerous within modular confines and largely GABAergic, filling voids within an extensive fibrous plexus of EphA4 labeling. These neurochemical and guidance signatures are discussed with respect to the developing LCIC microarchitecture and its segregated multimodal afferent systems (Fig. 12).
Figure 12.
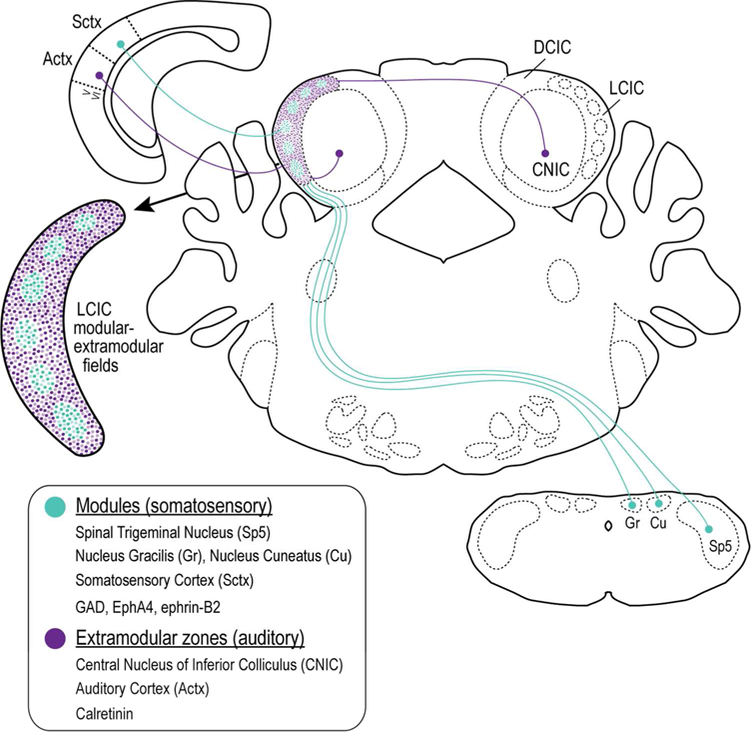
Schematic diagram depicting the modular-extra modular multimodal LCIC framework. Modules are positive for GAD, EphA4, and ephrin-B2 and receive somatosensory inputs converging from multiple levels. Surrounding extra modular zones are CR positive, receiving inputs of auditory origin arising largely from auditory cortex and adjacent IC subdivisions.
4.1. Anatomical characterization of LCIC compartments
Previous studies in a variety of adult species revealed a series of discontinuous modules in the IC shell consistently labeled with an assortment of neurochemical stains, including AChE, NADPH-d, GAD, CO, and parvalbumin (Chernock et al., 2004; Lesicko et al., 2016; Dillingham et al., 2017). A recent study from our lab confirms these markers highlight the same modular set and that LCIC modularity develops neonatally (Dillingham et al., 2017). This report was also the first to identify CR as a reliable marker for complementary extra modular zones. The emergence of LCIC patch-matrix-like compartments correlates temporally with the initial targeting and subsequent segregation of topographic multimodal afferents into their characteristic projection patterns. (unpublished findings from our lab; Balsamo and Gabriele, 2015; Lamb-Echegaray et al., 2018). Somatosensory and auditory fibers are present in the LCIC by birth and exhibit adult-like modular and extra modular projection distributions respectively by hearing onset. Such early arrangements suggest that intrinsic mechanisms may be largely responsible for the initial compartmentalization and segregation of unique LCIC neuronal populations and the appropriate ordering of their connectivity. Further studies that determine the specific involvement of Ephsand ephrins and their interplay with other cell adhesion families are needed to better understand the mechanisms that instruct the formation of LCIC functional domains.
4.2. Topographical organization of multimodal LCIC afferent/efferent systems
LCIC modality-specific projection streams appear to identify and obey established modular-extra modular boundaries (Wiberg and Blomqvist, 1984; Saldaña and Merchán, 1992; Saldaña et al., 1996, Winer et al., 1998; Zhou and Shore, 2006; Bajo et al., 2007; Torii et al., 2013; Stebbings et al., 2014; Lesicko et al., 2016). In adult mouse, converging ascending and descending inputs from somatosensory and auditory nuclei exhibit clear modular and extra modular configurations, respectively (Stebbings et al., 2014; Lesicko et al., 2016). Although these studies did not include CR staining of extra modular zones, labeled somatosensory inputs clearly overlapped GAD-positive modules, while auditory inputs terminated within surrounding domains. Such segregated LCIC multisensory afferent streams are in keeping with features consistent with discrete topographic maps (Luo and Flanangan, 2007).
Unlike continuous neural maps that utilize Eph-ephrin counter-gradients to provide positional information (Cang and Feldheim, 2013), expression in discrete systems is most often discontinuous, with complementary domains exhibiting different guidance proteins. Such an arrangement is epitomized in the nascent LCIC, where EphA4 and ephrin-B2 discontinuous patches dominate its dorsoventral axis. While it remains to be directly tested, correlative evidence suggests these zones are surrounded by ephrin-B3 extra modular expression (Wallace et al., 2016). One of our current aims is to assess the developmental progression of the various LCIC multimodal afferent patterns and how they interface with its emerging neurochemical and guidance framework. Results from these studies should provide insights for future experiments that aim to ascertain the precise Eph-ephrin interactions necessary for establishing its segregated modality-specific afferent streams.
Here we provide evidence of an extensive network of EphA4 fibrous labeling that dominates developing LCIC modules. This plexus surrounds ephrin-B2-positive cells bodies that are in abundance within modular confines, as well as other lacunae or voids that likely house other yet to be identified cell populations. Perisomatic punctate labeling was frequently observed ringing ephrin-B2 somata, including the subpopulation also positive for GAD. These findings warrant further study that examine the potential for EphA4 (presynaptic) interactions with ephrin-B2 expressing modular neurons (postsynaptic). Furthermore, the source of these EphA4-positive endings still needs to be systematically determined, to confirm if indeed these fibers correspond to inputs arising from somatosensory cortex and brainstem (spinal trigeminal and dorsal column) nuclei. Certainly the present findings, together with recent advances in adult mouse characterizing brainwide inputs to specific LCIC cell types (Chen et al., 2018), suggest a complex connectivity involving afferents from multiple systems (multisensory and neuromodulatory, Nevue et al., 2016) and levels (ascending, descending, and colliculocollicular) that converge on its modular-extra modular framework and exert influences on subpopulations of GABAergic and glutamatergic neurons. It remains to be determined the degree to which the connectional modularity that is evident for LCIC afferent systems also exists for its major efferent pathways, including those known to project on to the SC, the periaqueductal gray, and shell regions of thalamus (Chen et al., 2018).
4.3. Eph-ephrins delineate distinct subcompartments in other systems that receive unique input combinations.
The mosaic arrangement described here consisting of two major compartments is not unique to the IC shell. In fact, many areas exhibit similar organizational features, including olfactory bulb glomeruli (St. John et al., 2002), barrel fields of somatosensory cortex (Erzurumlu et al., 2006), the honeycomb-like lattice of the intermediate and deep superior colliculus (Illing and Graybiel, 1985; Wallace, 1986a, b; Wallace and Fredens, 1989; Mana and Chevalier, 2001), as well as striosomes (patch) and surrounding matrix of the striatum (Gerfen et al., 1985; Gerfen, 1992; Passante et al., 2008). Each of these patterns, similar to LCIC modular-extra modular zones, were initially described utilizing a variety of neurochemical markers that selectively highlighted certain cellular cohorts or neuronal compartments. These discrete morphological arrangements underlie important functional delineations for each of these areas as evidenced by similar mapping features of their now described segregated, input-output arrays. Furthermore, the development of many of these complex circuits relies upon highly orchestrated events involving the spatiotemporal expression of Eph-ephrin signaling proteins (Janis et al., 1999; Passante et al., 2008).
The present findings of matching neurochemical and guidance features suggest the LCIC may share certain aspects of its development with these analogous systems. However, in comparison, very little is known about the mechanisms and events that shape multimodal LCIC compartments. It remains unknown whether neurons destined to reside in modules versus extra modular zones is determined based upon birthdates. In the striatum, neurons are generated sequentially, with striosomal neurons preceding matrix neurons (van der Kooy and Fishell, 1987; Yun et al., 2002; Mason et al., 2005). These two cell populations intermingle embryonically in the striatal mantle, prior to segregating into their appropriate compartments during the early postnatal period (Lança et al., 1986; Krushel et al., 1995). If LCIC neurons were to follow a similar progression, in vitro assays would be needed to determine if a balance of adhesive and repulsive interactions were necessary for cell sorting and formation of modular-extra modular boundaries. Extrinsic cues may also be at play as in the striatum, where cells with similar fates cluster around developing afferent terminal patterns (Snyder-Keller et al., 2001; Snyder-Keller, 2004). Patch-matrix patterns in the striatum first become evident between birth and postnatal day 2, a time course in keeping with the emergence of LCIC compartments (Dillingham et al., 2017). Furthermore, Eph-ephrins are differentially expressed in complementary striosome/matrix patterns (Passante et al., 2008; Tai et al., 2013), much like that described here for the developing LCIC modules. Prior to determining the precise role of Eph-ephrins in cell segregation and discrete map formation in the LCIC, the full complement of guidance members at play must first be identified, as well as the many cell adhesion molecules that they likely interact with to exert their influences.
4.4. Concluding remarks
The presented data lend considerable support to the notion of Eph-ephrin involvement in the compartmentalization of the LCIC and the establishment of its characteristic modular-extra modular zones. Much work remains to determine the specific mechanisms that mediate compartmental cell sorting and boundary formation, as well as the manner in which its developing multimodal afferent and efferent pathways map with the underlying microstructure. Lastly, anatomical, physiological, and behavioral assessments in transgenic lines where the modular-extra modular organization is disrupted or compromised are needed to gain further insights into the LCIC, its development, connectivity, and functionality.
ACKNOWLEDGEMENTS
This work was supported by the National Institutes of Health (DC015353–01A1) and the National Science Foundation (DBI-0619207). The authors also thank Dr. Thomas Gabriele for his guidance with signal analysis, Isabel Lamb-Echegaray for her technical insights, and Devon Cowan for programming of quantitative ImageJ macros.
Footnotes
CONFLICT OF INTEREST STATEMENT
The authors declare all research was conducted in the absence of any commercial or financial relationships that could be construed as a potential conflict of interest.
REFERENCES
- Aitkin LM, Dickhaus H, Schult W, Zimmermann M. 1978. External nucleus of inferior colliculus: auditory and spinal somatosensory afferents and their interactions. J Neurophysiol 41:837–847. [DOI] [PubMed] [Google Scholar]
- Bajo VM, Nodal FR, Bizley JK, Moore DR, King AJ. 2007. The ferret auditory cortex: descending projections to the inferior colliculus. Cereb Cortex 17:475–491. [DOI] [PMC free article] [PubMed] [Google Scholar]
- Balsamo JA, Gabriele ML. 2015. Somatosensory inputs to the lateral cortex of the inferior colliculus prior to experience in mouse. Assoc Res Otolaryng Mtg PS-565
- Bergemann AD, Zhang L, Chiang MK, Brambilla R, Klein R, Flanagan JG. 1998. Ephrin-B3, a ligand for the receptor EphB3, expressed at the midline of the developing neural tube. Oncogene 16:471–480. [DOI] [PubMed] [Google Scholar]
- Cang J, Feldheim DA. 2013. Developmental mechanisms of topographic map formation and alignment. Ann Rev Neurosci 36:51–77. [DOI] [PubMed] [Google Scholar]
- Casseday JH, Covey E. 1996. A neuroethological theory of the operation of the inferior colliculus. Brain Behav Evol 47(6):311–336. [DOI] [PubMed] [Google Scholar]
- Chen C, Cheng M, Ito T, Song S. 2018. Neuronal organization in the inferior colliculus revisited with cell-type-dependent monosynaptic tracing. J Neurosci 38(13):3318–3332. [DOI] [PMC free article] [PubMed] [Google Scholar]
- Chernock ML, Larue DT, Winer JA. 2004. A periodic network of neurochemical modules in the inferior colliculus. Hear Res 188:12–20. [DOI] [PubMed] [Google Scholar]
- Coleman JR, Clerici WJ. 1987. Sources of projections to subdivisions of the inferior colliculus in the rat. J Comp Neurol 262:215–226. [DOI] [PubMed] [Google Scholar]
- Cramer KS, Gabriele ML. 2014. Axon guidance in the auditory system: Multiple functions of Eph receptors. Neurosci 277:152–162. [DOI] [PMC free article] [PubMed] [Google Scholar]
- Dillingham CH, Gay SM, Behrooz R, Gabriele ML. 2017. Modular-extra modular organization in developing multisensory shell regions of the mouse inferior colliculus. J Comp Neurol 525(17):3742–3756. [DOI] [PMC free article] [PubMed] [Google Scholar]
- Erzurumlu RS, Chen ZF, Jacquin MF. 2006. Molecular determinants of the face map development in the trigeminal brainstem. Anat Rec A Discov Mol Cell Evol Biol 288(2):121–134. [DOI] [PMC free article] [PubMed] [Google Scholar]
- Fathke RL, Gabriele ML. 2009. Patterning of multiple layered projections to the auditory midbrain prior to experience. Hear Res 249:36–43. [DOI] [PubMed] [Google Scholar]
- Gabriele ML, Brubaker DQ, Chamberlain KA, Kross KM, Simpson NS, Kavianpour SM. 2011. EphA4 and ephrin-B2 expression patterns during inferior colliculus projection shaping prior to experience. Dev Neurobiol 71:182–199. [DOI] [PubMed] [Google Scholar]
- Gale NW, Holland SJ, Valenzuela DM, Flenniken A, Pan L, Ryan TE, Henkemeyer M, Strebhardt K, Hirai H, Wilkinson DG, Pawson T, Davis S, Yancopoulos GD. 1996. Eph receptors and ligands comprise two major specificity subclasses and are reciprocally compartmentalized during embryogenesis. Neuron 17(1):9–19. [DOI] [PubMed] [Google Scholar]
- Gerfen CR. 1992. The neostriatal mosaic: multiple levels of compartmental organization in the basal ganglia. Annu Rev Neurosci 15:285–320. [DOI] [PubMed] [Google Scholar]
- Gerfen CR, Baimbridge KG, Miller JJ. 1985. The neostriatal mosaic: compartmental distribution of calcium-binding protein and parvalbumin in the basal ganglia of the rat and monkey. Proc Natl Acad Sci 82:8780–8784. [DOI] [PMC free article] [PubMed] [Google Scholar]
- Gruters KG, Groh JM. 2012. Sounds and beyond: multisensory and other non-auditory signals in the inferior colliculus. Front Neural Circuits 6, 96. doi: 10.3389/fncir.2012.00096. [DOI] [PMC free article] [PubMed] [Google Scholar]
- Illing RB, Graybiel AM. 1985. Convergence of afferents from frontal cortex and substantia nigra onto acetylcholinesterase-rich patches of the cat’s superior colliculus. Neurosci 14:455–482. [DOI] [PubMed] [Google Scholar]
- Jain R, Shore S. 2006. External inferior colliculus integrates trigeminal and acoustic information: unit responses to trigeminal nucleus and acoustic stimulation in the guinea pig. Neurosci Lett 395:71–75. [DOI] [PubMed] [Google Scholar]
- Janis LS, Cassidy RM, Kromer LF. 1999. Ephrin-A binding of EphA receptor expression delineate the matrix compartment of the striatum. J Neurosci 19:4962–4971. [DOI] [PMC free article] [PubMed] [Google Scholar]
- Krushel LA, Fishell G, van der Kooy D. 1995. Pattern formation in the mammalian forebrain: striatal patch and matrix neurons intermix prior to compartment formation. Eur J Neurosci 7(6):1210–1219. [DOI] [PubMed] [Google Scholar]
- Lamb-Echegaray ID, Gay SM, Noftz WA, Gabriele ML. 2018. Central nucleus projection patterns to the lateral cortex of the inferior colliculus target calretinin-positive extra modular zones in developing mouse. Assoc Res Otolaryngol Mtg, PS-55
- Lança AJ, Boyd S, Kolb BE, van der Kooy D. 1986. The development of a patchy organization of the rat striatum. Brain Res 392(1–2):1–10. [DOI] [PubMed] [Google Scholar]
- Lesicko AM, Hristova TS, Maigler KC, Llano DA. 2016. Connectional modularity of top-down and bottom-up multimodal inputs to the lateral cortex of the mouse inferior colliculus. J Neurosci 36:11037–11050. [DOI] [PMC free article] [PubMed] [Google Scholar]
- Loftus WC, Malmierca MS, Bishop DC, Oliver DL. 2008. The cytoarchitecture of the inferior colliculus revisited: a common organization of the lateral cortex in rat and cat. Neurosci 154(1):196–205. [DOI] [PMC free article] [PubMed] [Google Scholar]
- Luo L, Flanagan JG. 2007. Development of continuous and discrete neural maps. Neuron 56(2):284–300. [DOI] [PubMed] [Google Scholar]
- Mana S, Chevalier G. 2001. Honeycomb-like structure of the intermediate layers of the rat superior colliculus: afferent and efferent connections. Neurosci 103:673–693. [DOI] [PubMed] [Google Scholar]
- Mason HA, Rakowiecki SM, Raftopoulou M, Nery S, Huang Y, Gridley T, Fishell G. 2005. Notch signaling coordinates the patterning of striatal compartments. Development 132(19):4247–4258. [DOI] [PubMed] [Google Scholar]
- Nevue AA, Elde CJ, Perkel DJ, Portfors CV. 2016. Dopaminergic input to the inferior colliculus in mice. Front Neuroanat 9:168. doi: 10.3389/fnana.2015.00168. [DOI] [PMC free article] [PubMed] [Google Scholar]
- Noftz WA, Gray LC, Gabriele ML. 2014. Converging midbrain afferent patterns and auditory brainstem responses in ephrin-B3 mutant mice. Assoc Res Otolaryng Mtg PS-070
- Passante L, Gaspard N, Degraeve M, Frisén J, Kullander K, De Maertelaer V, Vanderhaeghen P. 2008. Temporal regulation of ephrin/Eph signalling is required for the spatial patterning of the mammalian striatum. Development 135(19):3281–90. [DOI] [PubMed] [Google Scholar]
- Saldaña E, Feliciano M, Mugnaini E. 1996. Distribution of descending projections from primary auditory neocortex to inferior colliculus mimics the topography of intracollicular projections. J Comp Neurol 37:15–40. [DOI] [PubMed] [Google Scholar]
- Saldaña E, Merchán MA. 1992. Intrinsic and commissural connections of the rat inferior colliculus. J Comp Neurol 319:417–437. [DOI] [PubMed] [Google Scholar]
- Snyder-Keller A 2004. Pattern of corticostriatal innervation in organotypic cocultures is dependent on the age of the cortical tissue. Exp Neurol 185(2):262–71. [DOI] [PubMed] [Google Scholar]
- Snyder-Keller A, Costantini LC, Graber DJ. 2001. Development of striatal patch/matrix organization in organotypic co-cultures of perinatal striatum, cortex and substantia nigra. Neuroscience 103(1):97–109. [DOI] [PubMed] [Google Scholar]
- St John JA, Pasquale EB, Key B. 2002. EphA receptors and ephrin-A ligands exhibit highly regulated spatial and temporal expression patterns in the developing olfactory system. Brain Res Dev Brain Res 138(1):1–14. [DOI] [PubMed] [Google Scholar]
- Stebbings KA, Lesicko AM, Llano DA. 2014. The auditory corticocollicular system: Molecular and circuit-level considerations. Hear Res 314:51–59. [DOI] [PMC free article] [PubMed] [Google Scholar]
- Tai AX, Cassidy RM, Kromer LF. 2013. EphA7 expression identifies a unique neuronal compartment in the rat striatum. J Comp Neurol 521:2663–2679. [DOI] [PubMed] [Google Scholar]
- Tamamaki N, Yanagawa Y, Tomioka R, Miyazaki J, Obata K, Kaneko T. 2003. Green fluorescent protein expression and colocalization with calretinin, parvalbumin, and somatostatin in the GAD67-GFP knock-in mouse. J Comp Neurol 467:60–79. [DOI] [PubMed] [Google Scholar]
- Tokunaga A, Sugita S, Otani K. 1984. Auditory and non-auditory subcortical afferents to the inferior colliculus in the rat. J Hirnforsch 25(4):461–72. [PubMed] [Google Scholar]
- Torii M, Hackett TA, Rakic P, Levitt P, Polley DB. 2013. EphA signaling impacts development of topographic connectivity in auditory corticofugal systems. Cereb Cortex 23:775–785. [DOI] [PMC free article] [PubMed] [Google Scholar]
- van der Kooy D, Fishell G. 1987. Neuronal birthdate underlies the development of striatal compartments. Brain Res 401:155–161. [DOI] [PubMed] [Google Scholar]
- Wallace MM, Harris JA, Brubaker DQ, Klotz CA, Gabriele ML. 2016. Graded and discontinuous EphA-ephrinB expression patterns in the developing auditory brainstem. Hear Res 335:64–75. [DOI] [PMC free article] [PubMed] [Google Scholar]
- Wallace MN. 1986a. Spatial relationship of histochemically demonstrable patches in the mouse superior colliculus. Exp Brain Res 62:241–249. [DOI] [PubMed] [Google Scholar]
- Wallace MN. 1986b. Spatial relationship of NADPH-diaphorase and acetylcholinesterase lattices in the rat and mouse superior colliculus. Neurosci 19:381–391. [DOI] [PubMed] [Google Scholar]
- Wallace MN, Fredens K. 1989. Relationship of afferent inputs to the lattice of high NADPH-diaphorase activity in the mouse superior colliculus. Exp Brain Res 78:435–445. [DOI] [PubMed] [Google Scholar]
- Wiberg M, Blomqvist A. 1984. The projection to the mesencephalon from the dorsal column nuclei. An anatomical study in the cat. Brain Res 311:225–244. [DOI] [PubMed] [Google Scholar]
- Winer JA, Larue DT, Diehl JJ, Hefti BJ. 1998. Auditory cortical projections to the cat inferior colliculus. J Comp Neurol 400:147–174. [PubMed] [Google Scholar]
- Yun K, Fischman S, Johnson J, Hrabe de Angelis M, Weinmaster G, Rubenstein JL. 2002. Modulation of the notch signaling by Mash1 and Dlx1/2 regulates sequential specification and differentiation of progenitor cell types in the subcortical telencephalon. Development 129(21):5029–40. [DOI] [PubMed] [Google Scholar]
- Zhou J, Shore S. 2006. Convergence of spinal trigeminal and cochlear nucleus projections in the inferior colliculus of the guinea pig. J Comp Neurol 495:100–112. [DOI] [PubMed] [Google Scholar]


