Abstract.
Prior information is often included in the basis material decomposition to solve the quantification problem of three-material mixtures in dual-energy computed tomography (DECT). Multienergy computed tomography (MECT) with more than two energy bins can provide a sufficient solution to this problem without invoking additional prior information. However, a question remains as to whether the prior information should still be included in the material decomposition process using MECT to improve the quantification accuracy and control noise amplification. This study aims to evaluate the impact of the prior information on noise and quantification bias in both DECT and MECT. The material decomposition tasks we used in this study are to quantify water/iodine, water/iodine/gadolinium, and water/ iodine/calcium in two- and three-material decompositions, under the assumption that the object to be decomposed consists of the basis materials and their mixtures. We performed phantom simulation and experimental studies using a clinical DECT system and a research photon-counting-detector-based MECT system. Results in the current phantom studies show that the prior information can still improve the noise performance without substantially affecting the basis material quantitative accuracy during the material decomposition process, even when the number of x-ray energy beams/bins is equal or greater than the number of basis materials.
Keywords: material decomposition, prior information, volume conservation, dual-energy computed tomography, multienergy computed tomography, photon-counting-detector computed tomography
1. Introduction
Dual-energy computed tomography (DECT) has received much attention over the past decade, with numerous novel clinical applications being incorporated into routine clinical practice, such as automatic bone removal,1 kidney stone characterization,2 virtual unenhanced imaging,3 and virtual monochromatic imaging.4 Material decomposition plays an important role in DECT.5–12 With two spectral measurements, DECT is theoretically only capable of quantifying up to two materials in a mixture within the diagnostic energy range. However, many clinical questions involve three materials in a mixture. These clinical questions can be classified into two major categories. One category involves three materials but with only one being the contrast material (e.g., iodine). A common example is the virtual unenhanced application to quantify and remove iodine content from a mixture of soft tissue, fat, and iodine in the liver.13 Another example is the bone mineral density (BMD) application to quantify BMD [calcium hydroxyapatite (CaHA)] from a mixture of red marrow, yellow marrow, and CaHA.14,15
The other category also involves three materials but with two of them being the contrast materials (e.g., iodine and gadolinium, or iodine and bismuth). Many clinical applications may benefit from simultaneous imaging of two contrast agents. One example is to use iodine and gadolinium contrast agents (injected separately with a certain time delay between them) to acquire multiple phases using a single scan, which may have clinical benefits for multiphase liver imaging,16,17 multiphase kidney imaging,18 computed tomography (CT) colonography,19 or CT angiography.20 Another example is to use iodine and bismuth to separate bowel wall (arterial) and lumen (enteric) in CT enterography to improve diagnosis of tumor in bowel wall and luminal filling defects.21–23
In DECT, in order to quantify the concentration of each of the three materials in a mixture, as required in the above applications, an additional physical constraint (a.k.a., prior information) must be included to solve an underdetermined problem.1,6,24,25 Three-material decomposition using a prior as physical constraint has been implemented on commercial DECT scanners.1 Typical prior information includes volume or mass conservation.7,8 Volume conservation is based on the assumption that the sum of the volumes of each basis material is equal to the volume of the mixture, which means that any volume of one material is to replace the same volume of other materials in a mixture. In practice, the assumption of volume conservation is not always true and may be violated, depending on the physical and chemical properties of the basis materials.6–8,26
With the recent advances in photon-counting-detector computed tomography (PCD-CT) and other multienergy computed tomography (MECT) techniques,22,26–36 three or more energy beams/bins can be simultaneously acquired. In principle, with three or more energy beams/bins, the material decomposition problem is no longer ill-conditioned, and a stable solution could be achieved to the three-material decomposition problem, without the need for prior as a physical constraint. Particularly, one of the main motivations of developing MECT techniques was to facilitate stable solutions to multimaterial decomposition problems, especially for mixtures including high-Z contrast materials. With the availability of more than two energy beams/bins in MECT, material decomposition methods were developed directly based on MECT measurements.27,37,38 It remains unclear, however, if it is still valuable to incorporate the prior information in the material decomposition process in MECT.
In this study, we investigated whether the prior information (e.g., volume conservation) is still beneficial in three-material decomposition using MECT. We analyzed noise magnification of the material decomposition with and without incorporating the prior information, and on the quantification bias when the prior information is inaccurate. CT simulations and experimental studies were performed to evaluate the impact of the prior information on the noise and bias properties of the material decomposition. For completeness, we also evaluated the impact of the prior information in two-material decomposition in DECT. The material decomposition task is to quantify water (background material) and iodine in two-material decomposition, water (background material), iodine, and gadolinium, as well as water (background), iodine, and calcium in three-material decompositions, under the assumption that the object to be decomposed consists of the basis materials and their mixtures.
2. Materials and Methods
2.1. DECT and MECT Basis Material Decomposition
The linear attenuation coefficient of a mixture composed of basis materials at x-ray beam energy can be expressed as
| (1) |
where and denote the mass attenuation coefficient and mass density of the ’th material in the mixture, respectively.
A generic image-based material decomposition method was employed, without invoking any noise reduction schemes in order to evaluate the inherent noise properties of the imaging system and the material decomposition process itself. The mass densities of the basis materials could be decomposed from the measured multienergy linear attenuation coefficients as
| (2) |
where
and
is the number of x-ray beams/bins ( for DECT and for MECT), is the number of basis materials, is the linear attenuation coefficient measured from the x-ray spectrum, or energy bin of , and is the effective mass attenuation coefficient at the x-ray spectrum or energy bin of , which can be determined by a separate calibration procedure. The last row in Eq. (2) (left-hand side), refers to volume conservation (prior information) defined for materials , where and are the mass density of the basis material in the mixture and in its pure form, respectively. When the linear equation system is overdetermined, it is solved using an ordinary least squares optimization method. After acquiring the mass density maps for all the basis materials with/without the prior, noise properties were analyzed and compared for each basis material and the bias introduced by an inaccurate prior was analyzed.
2.2. Figure of Merit for Noise Magnification
For convenience, here we define a single figure of merit (FOM) to quantify the overall noise magnification of the material decomposition process, which is given by , the overall relative noise in the solution to the linear equation system. Suppose the measurement noise is given by and the corresponding noise in the solution () of the linear system is , according to the definition of the condition number for a linear equation system, the upper bound of the relative noise is given by
| (3) |
where and denote the condition number of a matrix and the norm of a vector, respectively. For the same measurement noise , this upper bound serves as a single FOM to represent the overall noise magnification in the image-based material decomposition process with/without incorporating the prior information.
2.3. Bias due to Inaccurate Prior Information
The prior information such as volume conservation may not be accurate, especially for those contrast materials diluted in water or blood pool.6–8,26 In this section, we provide an analysis on how a small error in the prior information is propagated into the solution. Assuming that the total volume of a mixture is not strictly conserved (i.e., the total volume does not equal the summation of the volume of each material), the error term is given by
| (4) |
Applying Eq. (4) to Eq. (2), one obtains
| (5) |
Mass densities and can be solved as
| (6) |
where denotes the pseudoinverse and . Therefore, the difference between and is given by
| (7) |
where is written as a new matrix and denotes the last column in matrix . Thus represent the biases of mass densities for , when an error term is introduced.
2.4. Simulation Study
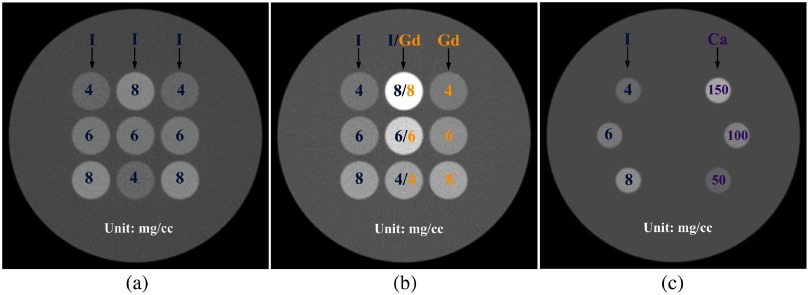
All the simulation studies were performed using a CT simulation software package (DRASIM, Siemens Healthineers).39 Three cylindrical water phantoms with a diameter of 20 cm were designed for two-material decomposition (iodine and water) and three-material decomposition (iodine, gadolinium, and water; iodine, calcium, and water) tasks, respectively. Figure 1 shows the phantom layout with material type and concentrations labeled. A calibration procedure to determine the coefficients in the decomposition matrix was performed on another water phantom with an identical diameter, but with contrast samples at different concentrations and locations.
Fig. 1.
Sample CT images showing the digital phantoms used in simulation studies for (a) two-material decomposition (iodine and water), (b) three-material decomposition (iodine, gadolinium, and water), and (c) three-material decomposition (iodine, calcium, and water).
Three CT scan configurations were simulated in this study: DECT, energy-integrating detector (EID)-based MECT (), and PCD-CT (). The spectra for DECT were generated based on a dual-source dual-energy CT (DS-DECT) scan configuration with a tube potential configuration of 80/Sn140 kV (Sn: 0.4 mm) [Fig. 2(a)]. The spectra for EID-based MECT () were represented by three energy beams, one low-energy beam, and two high-energy beams similar to those in Refs. 31 and 40 [Fig. 2(b)]. The low-energy spectrum was identical to the 80-kV beam in the DECT simulation, whereas the two high-energy beams were generated based on a “twin beam” design through adding a split filter (0.4-mm Sn and 0.12-mm Au) on the 140-kV beam. The spectra for PCD-CT () were generated by simulating four energy bins in a PCD-CT with threshold settings of (25, 50, 75, and 90 keV) at 140 kV [Fig. 2(c)].18,30,41
Fig. 2.
Simulated spectra: (a) DS-DECT (80/Sn140 kV), (b) EID-based MECT (80/Au140/Sn140 kV), and (c) PCD-CT [140 kV: (25, 50, 75, and 90 keV)].
The two-material phantom was used for DECT simulation, with and without the prior information, to study the impact of the prior information on DECT. The three-material phantom was designed for EID-based MECT () and PCD-CT (), with and without the prior information. Since DECT with prior can also solve the three-material problem, it is included as a reference. The projection data generated from each x-ray beam measurement were corrected for water beam hardening using a calibration water phantom at each spectrum. All images in the simulation study were reconstructed using a filtered-backprojection algorithm with a Hamming smooth filter, which was achieved by multiplying a Ram-Lak filter by a smoothed factor of 0.54.42,43 The information about data acquisition geometry, radiation dose, and material decomposition for two- and three-material phantom scans is summarized in Table 1.
Table 1.
Data acquisition geometry, radiation dose, and material decomposition in the simulation study.
| Two-material | Three-material | |||
|---|---|---|---|---|
| CT scanner platform | DECT | DECT | EID-based MECT () | PCD-CT () |
| Tube voltage (kV) | 80/Sn140 | 80/Sn140 | 80/Au140/Sn140 | 140: (25, 50, 75, and 90 keV) |
| Mean energies (keV) | (52.2 and 88.8) | (52.2, 75.4, and 88.8) | (62.6, 68.8, 88.3, and 108.3) | |
| Focal length (mm) | 595 | |||
| Source detector distance (mm) | 1095.6 | |||
| Detector shape/type/material/ | Cylindrical/PCD/CdTe | |||
| # of channels/projections/rows | 736/1152/1 | |||
| Slice width (mm) | 0.6 (iodine/gadolinium/water); 5.0 (iodine/calcium/water) | |||
| CTDIvol (mGy) | 16 | 16 (iodine/gadolinium/water); 32 (iodine/calcium/water) | ||
2.5. Phantom Experiments
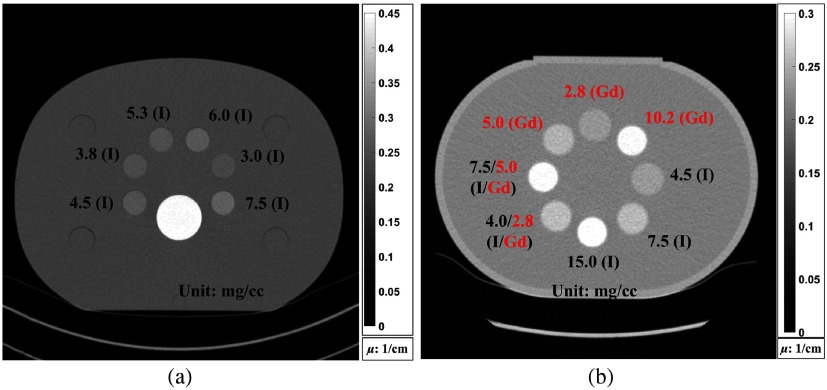
Two-material decomposition was first performed using a phantom containing two-basis materials of water and iodine, with and without the prior information to study the impact of the prior information on DECT. CT data were collected using a second generation DS-DECT (SOMATOM Definition Flash, Siemens Healthineers) with a voltage pair of 80/Sn140 kV. Images were reconstructed using commercial reconstruction software with a quantitative convolutional kernel (Q30f), during which beam hardening was corrected for by the CT manufacturer’s algorithm. A sample CT image in Fig. 3(a) shows the phantom design and iodine sample distribution as well as concentrations.
Fig. 3.
Sample CT images showing (a) two-material phantom and (b) three-material phantom used in the experimental study.
A water filled phantom [Fig. 3(b)] containing three iodine samples, three gadolinium samples, and two mixed iodine/gadolinium samples was prepared for three-material decomposition, with and without the prior information. The three-material phantom was scanned on a whole-body research PCD-CT prototype scanner (SOMATOM CounT, Siemens Healthineers) with the same threshold settings of [140 kV: (25, 50, 75, and 90 keV)] as in the simulation study.30,41 Images were reconstructed using commercial reconstruction software with a quantitative convolutional kernel (D30f), during which beam hardening was corrected for by the CT manufacturer’s algorithm. The information about data acquisition geometry, radiation dose, and material decomposition for two- and three-material phantom scans is summarized in Table 2.
Table 2.
Data acquisition geometry, radiation dose, and material decomposition in the experimental study.
| Two-material | Three-material | |
|---|---|---|
| CT scanner platform | DECT | PCD-CT () |
| Phantom size (cm) | ||
| Tube voltage (kV) | 80/Sn140 | 140: (25, 50, 75, and 90 keV) |
| Mean energies (keV) | (52.2 and 88.8) | (64.6, 69.5, 88.7, and 108.7) |
| Focal length (mm) | 595 | |
| Source detector distance (mm) | 1095.6 | |
| Detector shape/type/material/ | Cylindrical/PCD/CdTe | |
| Collimation (mm) | ||
| # of channels/projections/rows | 736/1152/64 | 480/1152/3241 |
| Slice-thickness/increment (mm) | 3.0/2.8 | |
| Recon kernel | Q30 | D30 |
| CTDIvol (mGy) | 8.17 | 35.34 |
3. Results
3.1. Impact of Prior on Two-Material Decomposition
3.1.1. Simulation study
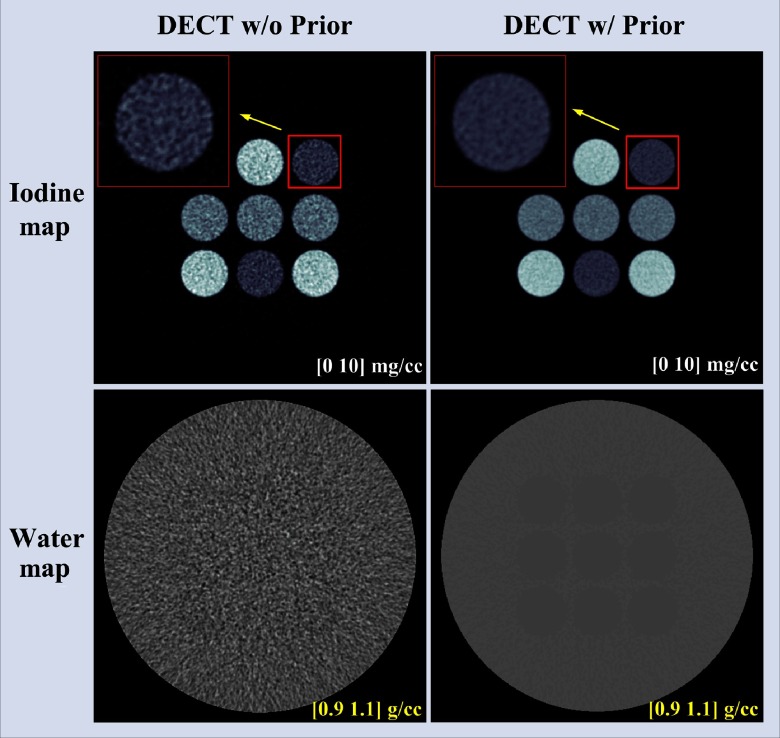
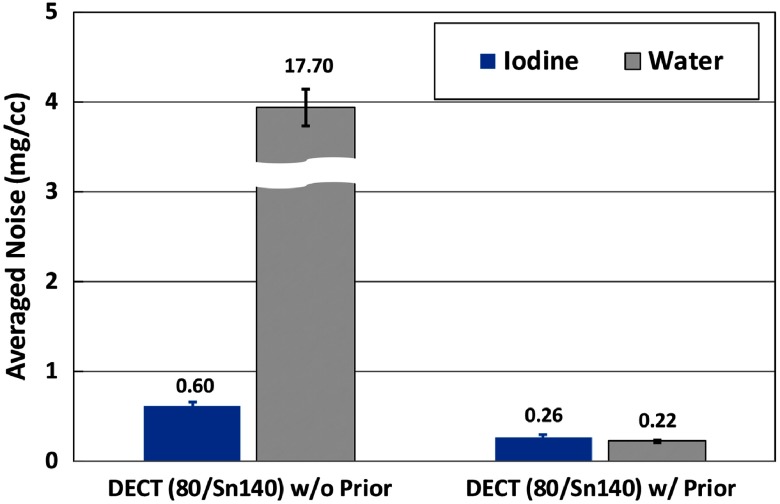
Figure 4 shows the basis material maps for iodine and water acquired from two-material decomposition in the simulation study. Figure 5 summarizes the noise levels in the basis material maps acquired with and without the prior. With the prior, a lower noise level in both basis material maps () was clearly visible, particularly for the water map. See Sec. 6 for more explanations on noise reduction on the water map. Figure 6 plots the mass density of iodine for all the samples measured in Fig. 4, with and without the prior, compared with the true concentrations of iodine samples. The error bars indicate the standard deviation of each measurement.
Fig. 4.
Iodine and water maps acquired from the two-material decomposition using DECT with and without the prior (simulation study); noise reduction is clearly visible on both iodine and water maps with the prior.
Fig. 5.
Noise levels in two-material decomposition using DECT with and without the prior (simulation study).
Fig. 6.
Mass density of iodine samples measured (a) without the prior and (b) with the prior in two-material decomposition using DECT (simulation study).
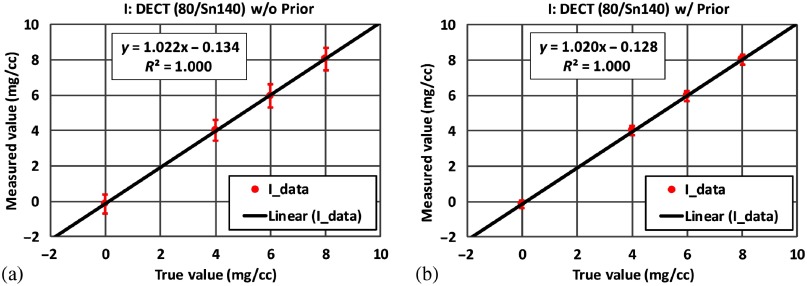
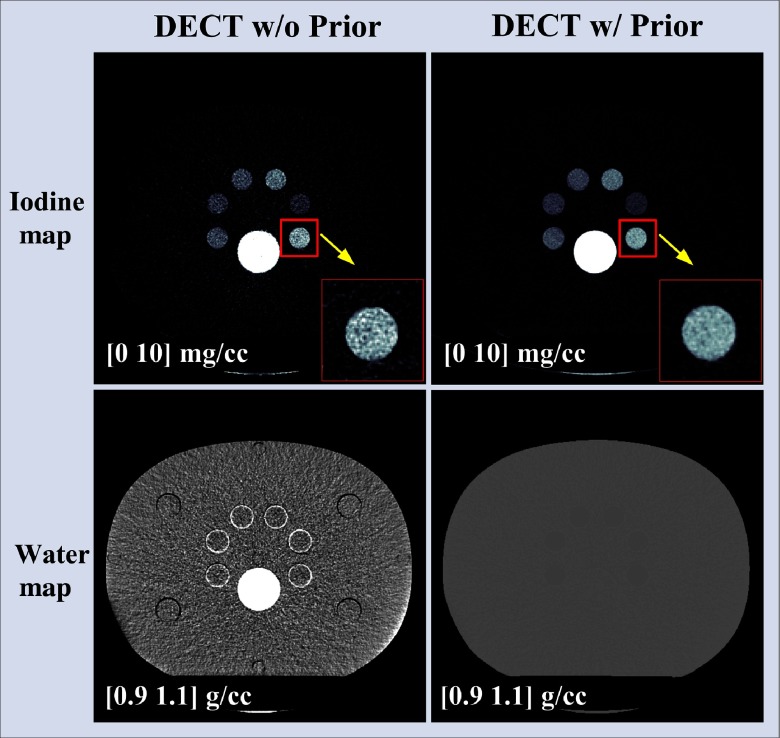
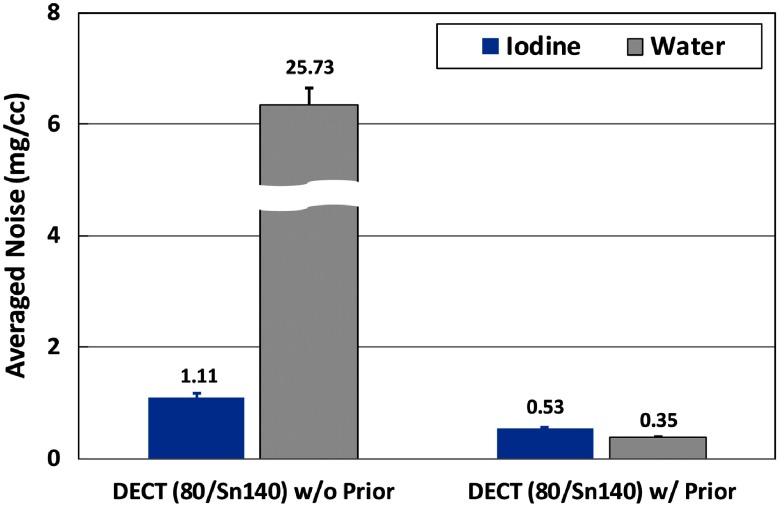
3.1.2. Phantom experiment
Figure 7 shows the basis material maps of iodine and water from two-material decomposition in the experimental study. Figure 8 summarizes the noise levels with and without the prior. One can see that noise was significantly reduced after the prior information was incorporated (). Figure 9 plots the mass density of iodine for all the samples shown in Fig. 7, with and without the prior, compared with the true concentrations of iodine samples. The error bars indicate the standard deviation of each measurement.
Fig. 7.
Iodine and water maps acquired from the two-material decomposition using DECT with and without the prior (experimental study); noise reduction is clearly visible in both iodine and water maps with the prior.
Fig. 8.
Noise levels of iodine and water maps from two-material decomposition in DECT with and without the prior (experimental study).
Fig. 9.
Mass density of iodine samples measured (a) without the prior and (b) with the prior in two-material decomposition using DECT (experimental study).
3.2. Impact of Prior on Three-Material Decomposition
3.2.1. Simulation study
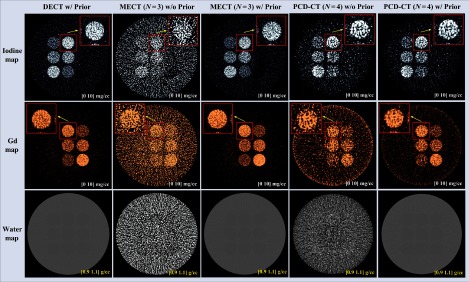
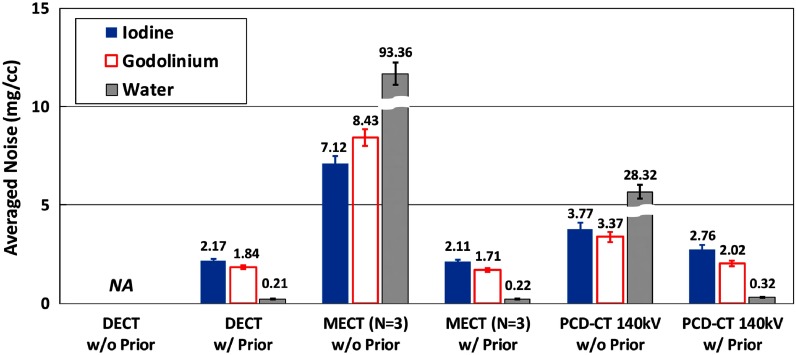
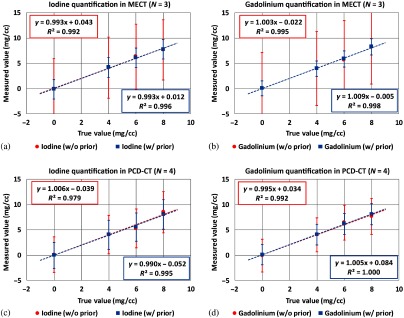
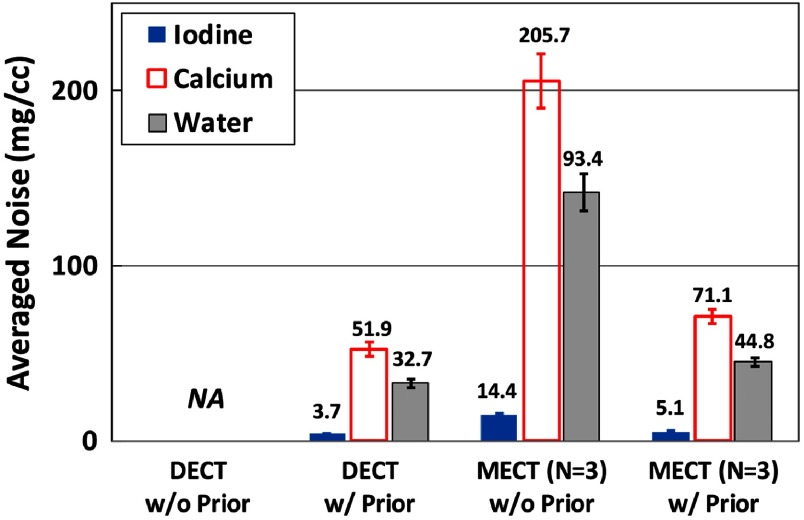
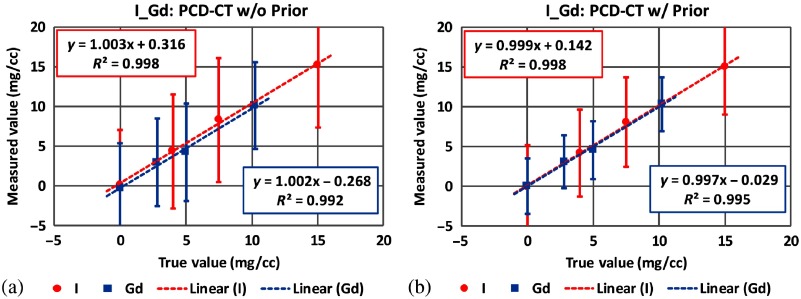
Figure 10 shows the mass density maps for iodine, gadolinium, and water acquired from three-material decomposition in the simulation study. The first column shows the iodine/gadolinium/water maps acquired in DECT with the prior (as DECT with the prior can still solve the three-material problem), the second and the third columns show the basis material maps determined from EID-based MECT () without and with the prior, and the fourth and the fifth columns show the basis material maps determined from PCD-CT () without and with the prior. Figure 11 summarizes the noise levels in all the basis material maps acquired with and without the prior. Similar to two-material decomposition, a lower noise level can be observed in all the basis material maps acquired with the prior (). Figure 12 plots the mass density of iodine and gadolinium for all the samples shown in Fig. 10, with and without the prior, compared with the true concentrations. The error bars indicate the standard deviation of each measurement.
Fig. 10.
Iodine, gadolinium, and water maps acquired from the three-material decomposition using DECT with the prior, and MECT with/without the prior (simulation study); noise reductions could be observed in all the basis material maps with the prior.
Fig. 11.
Noise levels in three-material decomposition using DECT with and without the prior, EID-based MECT with and without the prior, and PCD-CT with and without the prior (simulation study).
Fig. 12.
Mass densities of iodine and gadolinium samples measured in EID-based MECT () for (a) iodine and (b) gadolinium quantifications, and in PCD-CT for (c) iodine and (d) gadolinium quantifications, with and without the prior in three-material decomposition (simulation study).
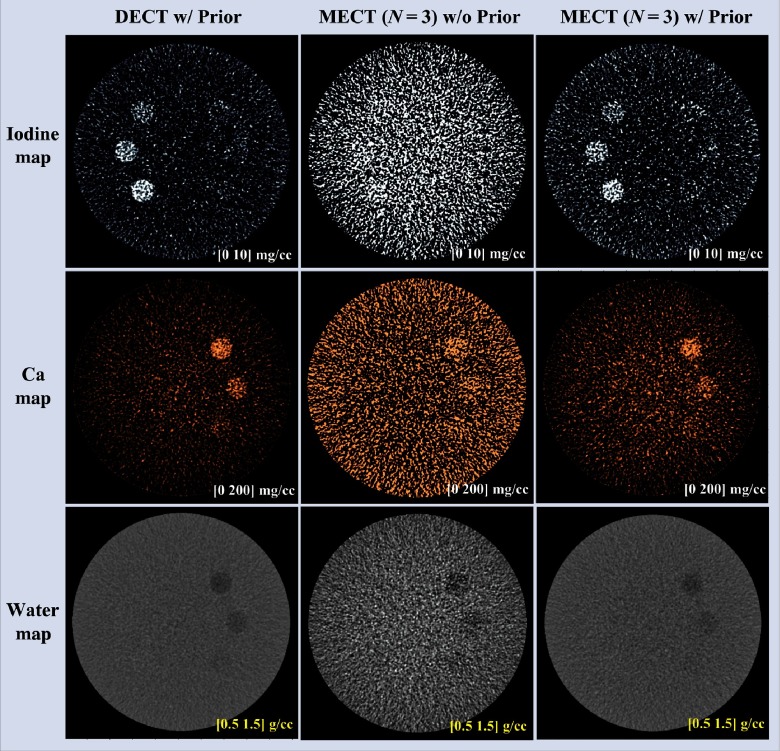
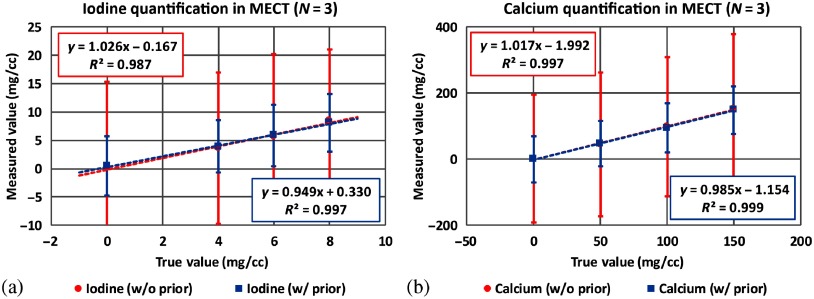
Figure 13 shows the mass density maps for iodine, calcium, and water acquired from three-material decomposition in the simulation study. The first column shows the iodine/calcium/water maps acquired in DECT with the prior, the second and the third columns show the basis material maps determined from EID-based MECT () without and with the prior. Figure 14 summarizes the noise levels in all the basis material maps acquired with and without the prior. Similar to two-material decomposition, a lower noise level can be observed in all the basis material maps acquired with the prior (). Figure 15 plots the mass density of iodine and calcium for all the samples shown in Fig. 13, with and without the prior, compared with the true concentrations. The error bars indicate the standard deviation of each measurement.
Fig. 13.
Iodine, calcium, and water maps acquired from the three-material decomposition using DECT with the prior, and MECT with/without the prior (simulation study); noise reductions could be observed in all the basis material maps with the prior.
Fig. 14.
Noise levels in three-material decomposition using DECT with and without the prior, EID-based MECT with and without the prior, and PCD-CT with and without the prior (simulation study).
Fig. 15.
Mass densities of iodine and calcium samples measured in EID-based MECT () for (a) iodine and (b) calcium quantifications, with and without the prior in three-material decomposition (simulation study).
3.2.2. Phantom experiment
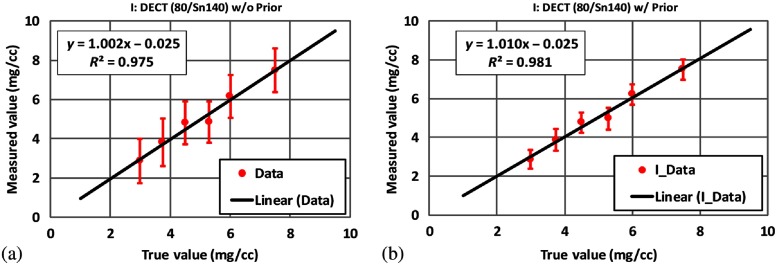
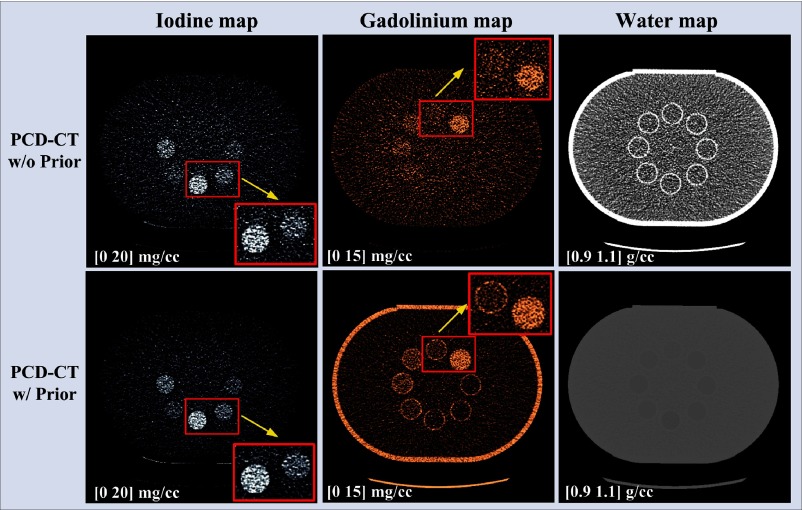
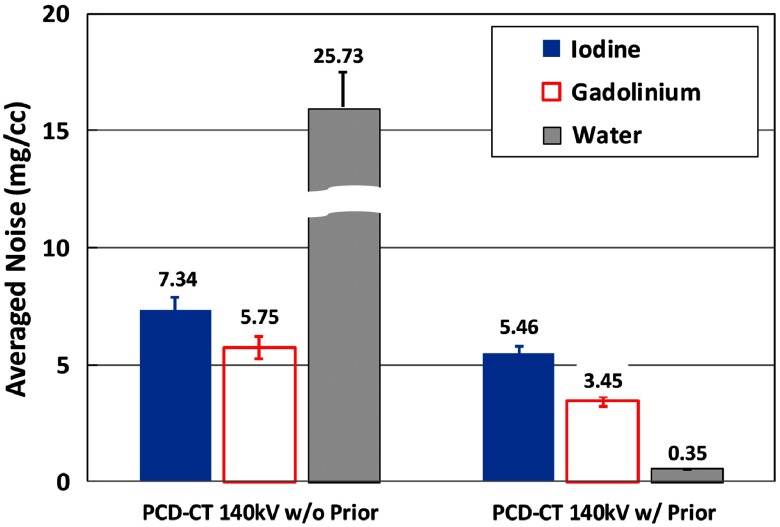
Figure 16 shows the basis material maps for iodine, gadolinium, and water acquired from three-material decomposition in the experimental study. Figure 17 summarizes the noise levels in all the basis material maps acquired with and without the prior. A lower noise level was visible in all of the iodine, gadolinium, and water maps acquired with the prior (). Figure 18 plots the mass density of iodine and gadolinium for all the samples measured in Fig. 16, with and without the prior, compared with the true concentrations of iodine and gadolinium samples. The error bars indicate the standard deviation of each measurement.
Fig. 16.
Iodine, gadolinium, and water maps acquired from the three-material decomposition using PCD-CT () with and without the prior (experimental study); noise reduction is visible in all basis material maps with the prior.
Fig. 17.
Noise levels of material density maps in three-material decomposition using PCD-CT with and without the prior (experimental study).
Fig. 18.
Mass densities of iodine and gadolinium samples measured in PCD-CT () (a) without the prior and (b) with the prior in three-material decomposition (experimental study).
3.3. Noise Magnification Analysis
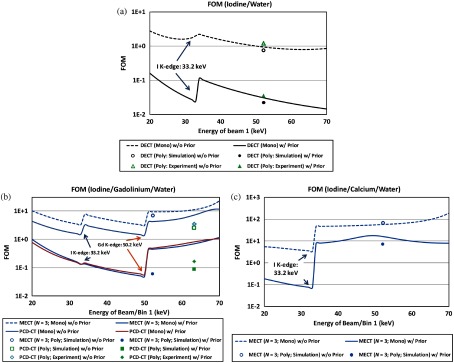
To demonstrate how the selection of beam energy would affect the noise magnification with and without the prior, the FOM for overall noise magnification was directly calculated using the mass attenuation coefficients of water, iodine, and gadolinium at monochromatic energies based on the NIST (National Institute of Standards and Technology) tables.44 The beam energies were determined as the mean energy of the corresponding polychromatic beams/bins, as listed in Tables 1 and 2, except for the very first energy beam/bin. Figure 19 shows the FOMs plotted as a function of energy for beam/bin 1, which was varied within (20 and 70) keV to capture the -edges of iodine (33.2 keV) and Gd (50.2 keV). FOMs calculated using the polychromatic data in simulation and experimental studies were also labeled in Fig. 19, which showed that the overall noise magnification in two- and three-material decompositions with the prior was much smaller than without the prior (), consistent with the results in the simulation and experimental studies (Figs. 4, 7, 10, 13, and 16).
Fig. 19.
FOMs for noise magnification determined using monochromatic/polychromatic beams in (a) two-material decomposition (iodine/water), (b) three-material decomposition (iodine/gadolinium/water), and (c) three-material decomposition (iodine/calcium/water).
3.4. Bias Analysis
3.4.1. Simulation study
Table 3 provides the quantification bias of iodine in two-material decomposition, and iodine and gadolinium, as well as iodine and calcium in three-material decompositions in simulation studies. All the average biases were except for that of calcium quantification ( w/o the prior and w/ the prior) in iodine and calcium separation. Taking into account of the concentration level of calcium (50 to 150 mg/cc) used in this simulation study, the relative bias level in iodine/calcium quantification was, however, comparable to that in iodine/gadolinium () quantification.
Table 3.
Summary of bias in basis material quantification in simulations.
| Two-material | Three-material | |||
|---|---|---|---|---|
| CT scanner platform | DECT (iodine) | MECT () (iodine/calcium) | MECT () (iodine/gadolinium) | PCD-CT (iodine/gadolinium) |
| Iodine w/o prior (mg/cc) | ||||
| Iodine w/ prior (mg/cc) | ||||
| Calcium w/o prior (mg/cc) | ||||
| Calcium w/ prior (mg/cc) | ||||
| Gadolinium w/o prior (mg/cc) | ||||
| Gadolinium w/ prior (mg/cc) | ||||
3.4.2. Phantom experiment
Table 4 provides the quantification bias of iodine in two-material decomposition, and iodine and gadolinium in three-material decomposition in phantom experiments. Due to violation of volume conservation, an average bias of 0.03 mg/cc was associated with the prior, compared to an average bias of 0.00 mg/cc without the prior. In three-material decomposition, the average biases for iodine and gadolinium were and , respectively, without the prior, and were and with the prior. The biases with the prior are attributable to the violation of the assumption for volume conservation.
Table 4.
Summary of bias in basis material quantification in experiments.
| Two-material | Three--material | |
|---|---|---|
| CT scanner platform | DECT | PCD-CT |
| Iodine w/o prior (mg/cc) | ||
| Iodine w/ prior (mg/cc) | ||
| Gadolinium w/o prior (mg/cc) | ||
| Gadolinium w/ prior (mg/cc) |
According to Eq. (7), the difference () between mass densities with and without introducing the error term can be plotted as a function of , as shown in Fig. 20. The value of corresponding to an average bias of 0.03 mg/cc in two-material decomposition is , as labeled in Fig. 20(a), indicating an average violation of volume conservation of about 0.1% for given iodine mass densities (). Similarly, the values of corresponding to biases of 0.20 mg/cc (iodine) and (gadolinium) in three-material decomposition were 0.004 and 0.001, as labeled in Fig. 20(b), indicating violations of volume conservation of about 0.4% and 0.1% for given iodine mass densities () and gadolinium mass density (), respectively (Fig. 20).
Fig. 20.
Mass density difference with respect to the error term introduced by assuming volume conservation for (a) two-material decomposition and (b) three-material decomposition. As labeled in (a), the error term is determined as in two-material decomposition, corresponding to an average violation of volume conservation of about 0.1%; as labeled in (b), the error terms are 0.004 and 0.001 in three-material decomposition, corresponding to an average violation of about 0.4% and 0.1% in iodine and gadolinium samples.
4. Discussion
With the growing popularity of DECT in routine clinical practice and emerging MECT techniques, it is important to improve the performance of material decomposition, which inherently magnifies noise in material density maps. Most of the material decomposition methods implemented on commercial products or research prototypes did not include prior information when the number of spectrum/energy measurements is sufficient for solving the material decomposition problem.27,37,38,45,46 In this work, both simulation and experimental studies for two- and three-material decompositions suggested that the prior information be included in the material decomposition process in order to improve the noise properties, even if the number of spectrum/energy measurements exceeds the number of unknowns for specific material decomposition tasks. In addition, we demonstrated that the quantitative accuracy of material decomposition was not affected substantially when a slight bias in the prior information was introduced. This work demonstrates a robust implementation of material decomposition using prior knowledge, especially for MECT with multiple energy bins that are usually more than sufficient for tasks involving two or three materials.
In our study, we measured image noise directly from the basis material images. The FOM of noise magnification was derived based on the condition number of the coefficient matrix for image-space material decomposition. Some previous studies used models based on Cramér–Rao lower bound (CRLB) to estimate the minimum noise level achievable for the line integrals in projection domain for each basis material.5,47 Since many line integrals contribute to the formation of each image voxel, it is difficult to estimate the noise levels using CRLB in image domain. Although some approximation can be used to estimate the central voxel variance using the CRLB estimate for one central projection,25 to the best of our knowledge, an accurate estimate of CRLB in the image domain for arbitrary region of interest does not exist. Therefore, we believe the noise estimate method used in the current study was already sufficient to meet the goal of this study without resorting to the CRLB.
The inclusion of prior information is only valid under the assumption that the object to be decomposed is composed of the basis materials and their mixtures. When the object contains materials other than the basis materials, inclusion of prior information may not be reasonable.8 In general, it is true that the two basis materials in DECT are selected to span the space of linear attenuation coefficients for human body tissues in the diagnostic energy range, and the objects to be decomposed are not necessarily composed of the two basis materials. However, we would like to emphasize that, in a wide range of dual-energy clinical applications, it is very common to use the basis materials to closely represent the tissues and contrast agents that are involved in the particular clinical applications. The benefit of doing so is that the decomposed coefficients directly represent the concentration of the material of interest. For example, the basis materials for virtual noncontrast and iodine quantification in several clinical applications (e.g., liver iodine quantification,13 solitary pulmonary nodule evaluation,48 and incidental adrenal mass49) are typically selected to be soft tissue, iodine, and fat. DECT plus prior information is typically used to solve the problem. Another example is BMD quantification.14,15 The basis materials are typically selected to be red marrow, yellow marrow, and CaHA. For DECT to work, a third condition (e.g., prior information) is also typically used. One may argue that those basis materials may not truly represent the composition of the tissue of interest. But as long as those materials capture the major components of the tissue, the results would still be clinically beneficial, recognizing that there could be some bias caused by imperfect modeling of the tissue composition. This is indeed the case in current clinical applications of DECT. Therefore, we believe that the underlying assumption in this study, i.e., that the object is composed of mixtures of basis materials, is widely applicable in many clinical applications of DECT, and similarly in MECT.
There are two major limitations in this study.
First, the impact of volume conservation on nonbasis materials has not been fully investigated. This is critically important in that the volume conservation defined for the basis materials may not be physically meaningful for other nonbasis materials.8 When the volume conservation is not taken into account, all the nonbasis materials such as the bone insert in Fig. 7 (left column) and water tank as well as the plastic tubes in Fig. 16 (upper row) were expected to be distributed into different basis material maps according to their physical properties (e.g., atomic number and density). When the volume conservation is incorporated into the material decompostion process, however, these nonbasis materials were assigned into the basis material maps in a different manner, as demonstrated in Fig. 7 (right column) and Fig. 16 (lower row). To solve this problem, a possible solution is to expand the current two- or three-material decompositions to a multimaterial decomposition task through modifying the geometric analysis described in Ref. 8 to a lower or higher dimension for the specific imaging tasks in our study. When four or more energy beam/bins are used, direct geometric analysis may be difficult and an approach based on Clifford algebra projection may be adopted.50 Note that the above approach was derived on CT values not on linear attenuation coefficient as in the current study. As demonstrated in Sec. 7, however, when volume conservation is considered, the implementations of image-based material decomposition algorithm on either linear attenuation coefficient or CT value are expected to be equivalent. Further investigation regarding this issue is underway to fully explore the impact of the volume conservation on multimaterial decompositions.
Second, the generic image-based material decomposition method used in this study magnifies the noise from x-ray beam measurements to basis material maps. As demonstrated in three-material decomposition in Fig. 17, even with the prior, the average noise levels in gadolinium and iodine maps were still as high as and , respectively, at given radiation dose level and reconstruction slice thickness in PCD-CT. This high-noise level may hinder the observation and detection of low-contrast objects. Further noise reductions either before or within the process of material decomposition, in additional to the incorporation of the prior information, may be desired.12,15,51–53 However, since our purpose is to evaluate the inherent properties of the material decomposition with and without incorporation of the prior information, noise reduction methods were intentionally excluded.
5. Conclusion
The impact of prior information (e.g., volume conservation) on two-material decomposition in DECT and three-material decomposition in MECT was investigated through numerical analyses, simulation studies, and experimental validations. Both simulation and experimental results showed significantly reduced noise levels in all the basis material maps when the prior information was included in the material decomposition. In addition, the bias was not substantially degraded in two- and three-material decompositions, despite the violation of the assumption for volume conservation. The findings in this study suggest that prior information such as volume conservation be included in the material decomposition process in both DECT and MECT even if the number of spectra/energy bins is sufficient for solving a multimaterial problem, under the assumption that the object to be decomposed is composed of the basis materials and their mixtures.
6. Appendix A: Significant Noise Reduction in Water Map
As shown in Figs. 4, 7, 10, and 13, the average noise level in the water map was significantly reduced when the prior information (volume conservation) was incorporated into the material decomposition process. This can be explained as follows. Considering three-material decomposition of iodine, gadolinium, and water in Eq. (2), and can be described as
| (8) |
| (9) |
Substituting , , and , one obtains
| (10) |
where the noise in water map is only a fraction of that in iodine and gadolinium map.
7. Appendix B: Implementation of Image-Based Material Decomposition Based on CT Numbers
The image-based material decomposition method can be implemented using either linear attenuation coefficient or CT number in Hounsfield units.8,18,19,27,34,37,38 When the system equation in Eq. (1) is represented using CT number, we have26
| (11) |
where , , Gd, and W denote the CT number of basis materials iodine, gadolinium, and water in their pure forms at x-ray beam energy , the term is dropped since in theory , and the last term, , can be treated in three conditions:
-
1.
: when this term is treated as a variable, another unknown is introduced and needs to be calibrated.26
-
2.
: when the term is treated as a constant but not zero, another physical constraint which is not exactly the volume conservation is introduced.
-
3.
: when the term is treated as zero, volume conservation is applied because .
In either condition, the image-based material decomposition method performed on CT number either introduces another unknown or inherently incorporates a physical constraint. For condition (3), when volume conservation is considered, the implementations of image-based material decomposition algorithm on either linear attenuation coefficient or CT number are expected to be equivalent.
Acknowledgments
This research was supported by the National Institute of Biomedical Imaging and Bioengineering of the National Institutes of Health under Award Nos. R21 EB024071, R01 EB016966, and C06 RR018898. The content is solely the responsibility of the authors and does not necessarily represent the official views of the National Institutes of Health. The authors would like to thank Dr. Thomas Flohr, Dr. Karl Stierstorfer, Dr. Bernhard Schmidt, and Dr. Steffen Kappler in Siemens Healthcare, for providing help on the DRASIM and the PCD-CT simulation tool. We also give thanks to Kristina Nunez for her assistance in this manuscript preparation.
Biographies
Liqiang Ren received his BS degree in opto-electronics in 2009 and an MEng. degree in optical engineering in 2011, both from Tianjin University, and his PhD in electrical and electronics engineering from the University of Oklahoma in 2016. He is a postdoc research fellow at Mayo Clinic. His research interests include optical microscopic imaging, x-ray fluorescence imaging, and spectral CT.
Shengzhen Tao received his PhD in biomedical engineering and physiology from Mayo Graduate School in 2017. Currently, he is a medical physics resident at Mayo Clinic specialized in diagnostic imaging. His research interests include CT/MRI image reconstruction, image denoising, spectral CT, MRI physics, and pulse sequence design.
Kishore Rajendran received his BE degree in biomedical engineering in 2009 from Anna University, his MS degree in medical electronics in 2011 from Coventry University, and his PhD in radiology in 2016 from the University of Otago. Currently, he is an assistant professor of Radiology at Mayo Clinic, Rochester, Minnesota. His current research focuses on photon-counting detector based CT for early detection of vascular and musculoskeletal diseases, CT image reconstruction, and CT noise reduction.
Cynthia H. McCollough is the Brooks-Hollern professor and a professor of medical physics and biomedical engineering at Mayo Clinic, where she directs the CT Clinical Innovation Center. Her research interests include CT dosimetry, advanced CT technology, and new clinical applications, such as dual-energy and multi-spectral CT. She is an NIH-funded investigator and is active in numerous professional organizations. She is a fellow of the AAPM and ACR. She received her doctorate from the University of Wisconsin in 1991.
Lifeng Yu received a BS degree in nuclear physics in 1997 and MEng. degree in nuclear technology in 2000, both from Beijing University, and his PhD in medical physics from the University of Chicago in 2006. He is a professor of medical physics at Mayo Clinic and a fellow of the AAPM. His research interests include CT physics, image quality assessment, and spectral CT.
Disclosure
Dr. McCollough receives industry support from Siemens Healthcare. No other authors have anything to disclose.
References
- 1.Johnson T. R. C., et al. , “Material differentiation by dual energy CT: initial experience,” Eur. Radiol. 17(6), 1510–1517 (2007). 10.1007/s00330-006-0517-6 [DOI] [PubMed] [Google Scholar]
- 2.Primak A. N., et al. , “Noninvasive differentiation of uric acid versus non uric acid kidney stones using dual-energy CT,” Acad. Radiol. 14(12), 1441–1447 (2007). 10.1016/j.acra.2007.09.016 [DOI] [PMC free article] [PubMed] [Google Scholar]
- 3.Sommer W. H., et al. , “Image quality of virtual noncontrast images derived from dual-energy CT angiography after endovascular aneurysm repair,” J. Vasc. Interventional Radiol. 21(3), 315–321 (2010). 10.1016/j.jvir.2009.10.040 [DOI] [PubMed] [Google Scholar]
- 4.Yu L., Leng S., McCollough C. H., “Dual-energy CT-based monochromatic imaging,” Am. J. Roentgenol. 199(5 Suppl.), S9–S15 (2012). 10.2214/AJR.12.9121 [DOI] [PubMed] [Google Scholar]
- 5.Alvarez R. E., Macovski A., “Energy-selective reconstructions in x-ray computerised tomography,” Phys. Med. Biol. 21(5), 733–744 (1976). 10.1088/0031-9155/21/5/002 [DOI] [PubMed] [Google Scholar]
- 6.Kelcz F., Joseph P. M., Hilal S. K., “Noise considerations in dual energy CT scanning,” Med. Phys. 6(5), 418–425 (1979). 10.1118/1.594520 [DOI] [PubMed] [Google Scholar]
- 7.Liu X., et al. , “Quantitative imaging of element composition and mass fraction using dual-energy CT: three-material decomposition,” Med. Phys. 36(5), 1602–1609 (2009). 10.1118/1.3097632 [DOI] [PMC free article] [PubMed] [Google Scholar]
- 8.Mendonça P. R. S., Lamb P., Sahani D.V., “A flexible method for multi-material decomposition of dual-energy CT images,” IEEE Trans. Med. Imaging 33(1), 99–116 (2014). 10.1109/TMI.2013.2281719 [DOI] [PubMed] [Google Scholar]
- 9.Niu T., et al. , “Iterative image-domain decomposition for dual-energy CT,” Med. Phys. 41(4), 041901 (2014). 10.1118/1.4866386 [DOI] [PubMed] [Google Scholar]
- 10.Zhao W., et al. , “Energy spectrum extraction and optimal imaging via dual-energy material decomposition,” in IEEE Nuclear Sci. Symp. and Med. Imaging Conf. (NSS/MIC) (2015). 10.1109/NSSMIC.2015.7582159 [DOI] [Google Scholar]
- 11.Cho H. M., et al. , “Calibration phantoms for accurate water and lipid density quantification using dual energy mammography,” Phys. Med. Biol. 62(11), 4589–4603 (2017). 10.1088/1361-6560/aa6f31 [DOI] [PubMed] [Google Scholar]
- 12.Xue Y., et al. , “Statistical image-domain multimaterial decomposition for dual-energy CT,” Med. Phys. 44(3), 886–901 (2017). 10.1002/mp.12096 [DOI] [PMC free article] [PubMed] [Google Scholar]
- 13.De Cecco C. N., et al. , “Dual energy CT (DECT) of the liver: conventional versus virtual unenhanced images,” Eur. Radiol. 20(12), 2870–2875 (2010). 10.1007/s00330-010-1874-8 [DOI] [PubMed] [Google Scholar]
- 14.Cann C. E., “Quantitative CT for determination of bone mineral density: a review,” Radiology 166(2), 509–522 (1988). 10.1148/radiology.166.2.3275985 [DOI] [PubMed] [Google Scholar]
- 15.Sfeir J. G., et al. , “Evaluation of cross-sectional and longitudinal changes in volumetric bone mineral density in postmenopausal women using single- versus dual-energy quantitative computed tomography,” Bone 112, 145–152 (2018). 10.1016/j.bone.2018.04.023 [DOI] [PMC free article] [PubMed] [Google Scholar]
- 16.Muenzel D., et al. , “Photon counting CT of the liver with dual-contrast enhancement,” Proc. SPIE 9783, 97835N (2016). 10.1117/12.2216391 [DOI] [Google Scholar]
- 17.Muenzel D., et al. , “Simultaneous dual-contrast multi-phase liver imaging using spectral photon-counting computed tomography: a proof-of-concept study,” Eur. Radiol. Exp. 1(1), 25 (2017). 10.1186/s41747-017-0030-5 [DOI] [PMC free article] [PubMed] [Google Scholar]
- 18.Rolf S., et al. , “Photon-counting CT for simultaneous imaging of multiple contrast agents in the abdomen: an in vivo study,” Med. Phys. 44(10), 5120–5127 (2017). 10.1002/mp.2017.44.issue-10 [DOI] [PMC free article] [PubMed] [Google Scholar]
- 19.Muenzel D., et al. , “Spectral photon-counting CT: initial experience with dual-contrast agent K-edge colonography,” Radiology 283(3), 723–728 (2017). 10.1148/radiol.2016160890 [DOI] [PubMed] [Google Scholar]
- 20.Dangelmaier J., et al. , “Experimental feasibility of spectral photon-counting computed tomography with two contrast agents for the detection of endoleaks following endovascular aortic repair,” Eur. Radiol. 28(8), 3318–3325 (2018). 10.1007/s00330-017-5252-7 [DOI] [PMC free article] [PubMed] [Google Scholar]
- 21.Mongan J., et al. , “In vivo differentiation of complementary contrast media at dual-energy CT,” Radiology 265(1), 267–272 (2012). 10.1148/radiol.12120692 [DOI] [PMC free article] [PubMed] [Google Scholar]
- 22.Symons R., et al. , “Photon-counting CT for simultaneous imaging of multiple contrast agents in the abdomen: an in vivo study,” Med. Phys. 44(10), 5120–5127 (2017). 10.1002/mp.2017.44.issue-10 [DOI] [PMC free article] [PubMed] [Google Scholar]
- 23.Qu M., et al. , “Toward biphasic computed tomography (CT) enteric contrast: material classification of luminal bismuth and mural iodine in a small-bowel phantom using dual-energy CT,” J. Comput. Assisted Tomogr. 36(5), 554–559 (2012). 10.1097/RCT.0b013e3182606baf [DOI] [PubMed] [Google Scholar]
- 24.Yveborg M., Danielsson M., Bornefalk H., “Theoretical comparison of a dual energy system and photon counting silicon detector used for material quantification in spectral CT,” IEEE Trans. Med. Imaging 34(3), 796–806 (2015). 10.1109/TMI.2014.2362795 [DOI] [PubMed] [Google Scholar]
- 25.Bornefalk H., Persson M., “Theoretical comparison of the iodine quantification accuracy of two spectral CT technologies,” IEEE Trans. Med. Imaging 33(2), 556–565 (2014). 10.1109/TMI.2013.2290198 [DOI] [PubMed] [Google Scholar]
- 26.Li Z., et al. , “Image-based material decomposition with a general volume constraint for photon-counting CT,” Proc. SPIE 9412, 94120T (2015). 10.1117/12.2082069 [DOI] [PMC free article] [PubMed] [Google Scholar]
- 27.Roessl E., Proksa R., “K-edge imaging in x-ray computed tomography using multi-bin photon counting detectors,” Phys. Med. Biol. 52(15), 4679–4696 (2007). 10.1088/0031-9155/52/15/020 [DOI] [PubMed] [Google Scholar]
- 28.Bauer R. W., et al. , “Dual-energy CT for the assessment of chronic myocardial infarction in patients with chronic coronary artery disease: comparison with 3-T MRI,” Am. J. Roentgenol. 195(3), 639–646 (2010). 10.2214/AJR.09.3849 [DOI] [PubMed] [Google Scholar]
- 29.Kappler S., et al. , “Photon counting CT at elevated x-ray tube currents: contrast stability, image noise and multi-energy performance,” Proc. SPIE 9033, 90331C (2014). 10.1117/12.2043511 [DOI] [Google Scholar]
- 30.Yu Z., et al. , “Initial results from a prototype whole-body photon-counting computed tomography system,” Proc. SPIE 9412, 94120W (2015). 10.1117/12.2082739 [DOI] [PMC free article] [PubMed] [Google Scholar]
- 31.Yu L., et al. , “Dual-source multienergy CT with triple or quadruple x-ray beams,” J. Med. Imaging 5(3), 033502 (2018). [DOI] [PMC free article] [PubMed] [Google Scholar]
- 32.Ren L., Zheng B., Liu H., “Tutorial on x-ray photon counting detector characterization,” J. X-Ray Sci. Technol. 26(1), 1–28 (2018). 10.3233/XST-16210 [DOI] [PMC free article] [PubMed] [Google Scholar]
- 33.Fornaro J., et al. , “Dual- and multi-energy CT: approach to functional imaging,” Insights Imaging 2(2), 149–159 (2011). 10.1007/s13244-010-0057-0 [DOI] [PMC free article] [PubMed] [Google Scholar]
- 34.Faby S., et al. , “Performance of today’s dual energy CT and future multi energy CT in virtual non-contrast imaging and in iodine quantification: a simulation study,” Med. Phys. 42(7), 4349–4366 (2015). 10.1118/1.4922654 [DOI] [PubMed] [Google Scholar]
- 35.McCollough C. H., et al. , “Dual- and multi-energy CT: principles, technical approaches, and clinical applications,” Radiology 276(3), 637–653 (2015). 10.1148/radiol.2015142631 [DOI] [PMC free article] [PubMed] [Google Scholar]
- 36.Curtis T. E., Roeder R. K., “Effects of calibration methods on quantitative material decomposition in photon-counting spectral computed tomography using a maximum a posteriori estimator,” Med. Phys. 44(10), 5187–5197 (2017). 10.1002/mp.12457 [DOI] [PubMed] [Google Scholar]
- 37.Lehmann L. A., Alvarez R. E., “Energy-selective radiography a review,” in Digital Radiography: Selected Topics, Kereiakes J. G., Thomas S. R., Orton C. G., Eds., Springer, Boston, Massachusetts, pp. 145–188 (1986). [Google Scholar]
- 38.Sukovle P., Clinthorne N. H., “Basis material decomposition using triple-energy x-ray computed tomography,” in Proc. 16th IEEE Instrum. and Meas. Technol. Conf. (Cat. No. 99CH36309) (1999). 10.1109/IMTC.1999.776097 [DOI] [Google Scholar]
- 39.Fung G. S. K., et al. , “XCAT/DRASIM: a realistic CT/human-model simulation package,” Proc. SPIE 7961, 79613D (2011). 10.1117/12.878034 [DOI] [Google Scholar]
- 40.Ren L., McCollough C. H., Yu L., “Three-material decomposition in multi-energy CT: impact of prior information on noise and bias,” Proc. SPIE 10573, 105731G (2018). 10.1117/12.2294953 [DOI] [PMC free article] [PubMed] [Google Scholar]
- 41.Yu Z., et al. , “Evaluation of conventional imaging performance in a research whole-body CT system with a photon-counting detector array,” Phys. Med. Biol. 61(4), 1572–1595 (2016). 10.1088/0031-9155/61/4/1572 [DOI] [PMC free article] [PubMed] [Google Scholar]
- 42.Zeng G. L., “Revisit of the ramp filter,” in IEEE Nuclear Sci. Symp. and Med. Imaging Conf. (NSS/MIC) (2014). 10.1109/NSSMIC.2014.7430796 [DOI] [Google Scholar]
- 43.Beckmann M., Iske A., “Error estimates for filtered back projection,” in Int. Conf. Sampling Theory and Appl. (SampTA) (2015). 10.1109/SAMPTA.2015.7148952 [DOI] [Google Scholar]
- 44.Hubbell J. H., Seltzer S. M., “Tables of x-ray mass attenuation coefficients and mass energy-absorption coefficients 1 keV to 20 meV for elements z = 1 to 92 and 48 additional substances of dosimetric interest,” Technical Report (1995).
- 45.Rassouli N., et al. , “Detector-based spectral CT with a novel dual-layer technology: principles and applications,” Insights Imaging 8(6), 589–598 (2017). 10.1007/s13244-017-0571-4 [DOI] [PMC free article] [PubMed] [Google Scholar]
- 46.Slavic S., et al. , “GSI Xtream on revolution CT,” White Paper, GE Healthcare; (2017). [Google Scholar]
- 47.Roessl E., Herrmann C., “Cramér–Rao lower bound of basis image noise in multiple-energy x-ray imaging,” Phys. Med. Biol. 54(5), 1307–1318 (2009). 10.1088/0031-9155/54/5/014 [DOI] [PubMed] [Google Scholar]
- 48.Chae E. J., et al. , “Clinical utility of dual-energy CT in the evaluation of solitary pulmonary nodules: initial experience,” Radiology 249(2), 671–681 (2008). 10.1148/radiol.2492071956 [DOI] [PubMed] [Google Scholar]
- 49.Gnannt R., et al. , “Dual-energy CT for characterization of the incidental adrenal mass: preliminary observations,” Am. J. Roentgenol. 198(1), 138–144 (2012). 10.2214/AJR.11.6957 [DOI] [PubMed] [Google Scholar]
- 50.Thomas O. D., et al. , “Material decomposition in an arbitrary number of dimensions using noise compensating projection,” Biomed. Phys. Eng. Express 4(1), 015007 (2018). 10.1088/2057-1976/aa907d [DOI] [Google Scholar]
- 51.Zhao W., et al. , “Using edge-preserving algorithm with non-local mean for significantly improved image-domain material decomposition in dual-energy CT,” Phys. Med. Biol. 61(3), 1332–1351 (2016). 10.1088/0031-9155/61/3/1332 [DOI] [PMC free article] [PubMed] [Google Scholar]
- 52.Clark D. P., Holbrook M., Badea C.T., “Multi-energy CT decomposition using convolutional neural networks,” Proc. SPIE 10573, 105731O (2018). 10.1117/12.2293728 [DOI] [Google Scholar]
- 53.Tao S., et al. , “Material decomposition with prior knowledge aware iterative denoising (MD-PKAID),” Phys. Med. Biol. 63(19), 195003 (2018). 10.1088/1361-6560/aadc90 [DOI] [PubMed] [Google Scholar]


