

Summary
Viscoelastic properties of cells provide valuable information regarding biological or clinically relevant cellular characteristics. Here, we introduce a new, electronic-based, microfluidic platform—visco-node-pore sensing (visco-NPS)—which quantifies cellular viscoelastic properties under periodic deformation. We measure the storage (G′) and loss (G″) moduli (i.e., elasticity and viscosity, respectively) of cells. By applying a wide range of deformation frequencies, our platform quantifies the frequency dependence of viscoelastic properties. G′ and G″ measurements show that the viscoelastic properties of malignant breast epithelial cells (MCF-7) are distinctly different from those of non-malignant breast epithelial cells (MCF-10A). With its sensitivity, visco-NPS can dissect the individual contributions of different cytoskeletal components to whole-cell mechanical properties. Moreover, visco-NPS can quantify the mechanical transitions of cells as they traverse the cell cycle or are initiated into an epithelial-mesenchymal transition. Visco-NPS identifies viscoelastic characteristics of cell populations, providing a biophysical understanding of cellular behavior and a potential for clinical applications.
Subject Areas: Analytical Chemistry, Fluidics, Cell, Biomechanics
Graphical Abstract
Highlights
-
•
Visco-node-pore sensing (visco-NPS) enables viscoelastic measurements of cells
-
•
Visco-NPS can sense changes in cytoskeleton and nucleus structure
-
•
SLUG induction in MCF-10A causes partial EMT and increased viscous behavior
Analytical Chemistry; Fluidics; Cell; Biomechanics
Introduction
Cellular mechanical properties are recognized as important indicators of biologically relevant functions of cells and tissues (Stossel et al., 2001, Janmey and McCulloch, 2007). In particular, viscoelastic properties provide valuable information regarding how cells facilitate their movement and minimize damage from external stimuli by storing and dissipating energy (Lange and Fabry, 2013, Suresh, 2007). Governing the viscoelastic responses of cells are intracellular components such as actin filaments, microtubules, and the nucleus—all of which play important roles in the dynamics of cell proliferation (Provenzano and Keely, 2011), migration (Yamaguchi and Condeelis, 2007), differentiation (Mundel et al., 1997, Woods et al., 2007), and apoptosis (Gourlay and Ayscough, 2005). Mechanical characterization of cells also provides clinical merits in terms of detecting cellular changes that are due to, for instance, cancer malignancy (Kumar and Weaver, 2009, Kim et al., 2018, Prabhune et al., 2012), cell cycle (Otto et al., 2015, Benham-Pyle et al., 2015), stem cell differentiation (Altman et al., 2002, Luu et al., 2009, Saha et al., 2006), or epithelial-mesenchymal transition (EMT) (Cabrera-Benítez et al., 2012, Gjorevski et al., 2012). Thus, analyzing viscoelastic properties of cells provides not only a fundamental understanding of biophysical characteristics but also a tremendous potential for clinical applications.
To quantify the viscoelastic properties of cells, different rheological methods have been developed. To name just a few examples, micropipette aspiration (Sato et al., 1987, Sato et al., 1990), microplate rheometer (Desprat et al., 2006, Thoumine et al., 1999), optical stretcher (Guck et al., 2001, Yang et al., 2016), and atomic force microscopy (AFM) (Haase and Pelling, 2015, Alcaraz et al., 2003) have all been used to measure the viscoelastic properties of cells with respect to different loading conditions, such as force magnitude and deformation frequency. These methods, however, have low throughput (only a few cells/hour [Guo et al., 2012, Wang et al., 2015, Cartagena-Rivera et al., 2015]) and consequently are not capable of screening large populations of cells—a critical need for clinical applications. To address this key drawback, a number of higher-throughput microfluidic platforms have been developed, including hydrodynamic stretching cytometry (Gossett et al., 2012, Masaeli et al., 2016), real-time deformability cytometry (RT-DC) (Otto et al., 2015), and mechano node-pore-sensing (mechano-NPS) (Kim et al., 2018). These particular methods, however, focus on mechanically phenotyping cells for screening purposes and do not provide the means to investigate basic cellular mechanics. Recent studies have reported microfluidic platforms that take a rheological approach and drive cells through a confining channel to measure their cellular viscoelastic properties (Preira et al., 2013, Hu and Lam, 2017). However, these platforms rely on imaging, and consequently, they have a very limited temporal and spatial window for measurement, which in turn, severely restricts sample size and experimental conditions. Key information such as what is the frequency dependence of viscoelastic properties and what is the origin of whole-cell properties cannot be easily obtained. Thus despite the many different platforms for measuring cell mechanical properties that exist today, none thus far are able to provide a comprehensive view of cellular mechanics.
Here, we introduce a novel, all-electronic-based, microfluidic platform to measure the cellular viscoelastic properties. Our platform, visco-node-pore sensing (visco-NPS), employs a rheological approach by utilizing a sinusoidal-shaped contraction channel through which cells undergo an oscillating deformation as a result of the channel's periodically changing width. By integrating this unique channel with a node-pore sensor (Balakrishnan et al., 2013, Kim et al., 2018), we are able to measure the storage (elasticity) and loss (viscosity) moduli of cells. As we demonstrate, visco-NPS can successfully quantify the differences in the viscoelastic properties between malignant and non-malignant epithelial cells. Moreover, it can ascertain the individual contributions of cytoskeletal components, i.e., actin filaments and microtubules, to the mechanical behavior of cells. Finally, visco-NPS can determine the changes in cell mechanical properties that result from the dynamic transitions that the cytoskeleton and nucleus undergo during the cell cycle or from an initiated EMT. Overall, visco-NPS represents an efficient, simple, and direct means to quantify the mechanical properties of single cells.
Results
Experimental Design
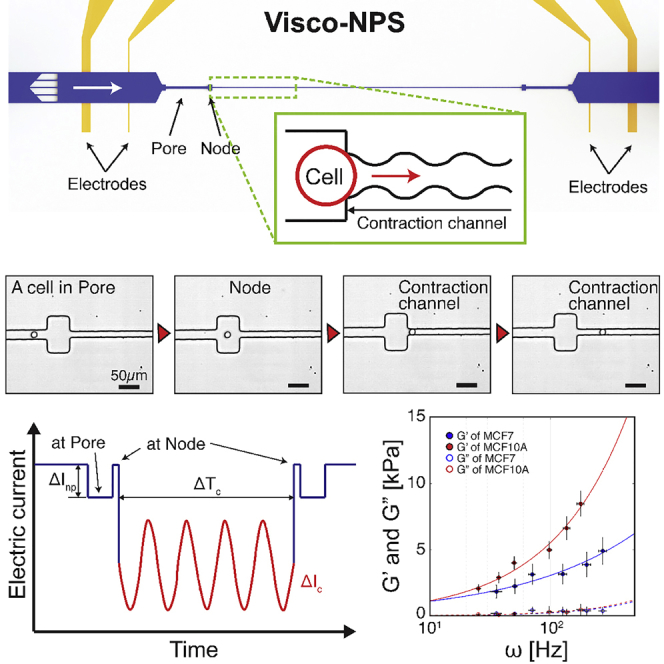
Visco-NPS consists of a microfluidic channel embedded in a polydimethylsiloxane (PDMS) mold that is bonded to a glass substrate with pre-defined platinum (Pt) electrodes and gold (Au) contact pads (Figure 1A). The embedded channel has multiple components: in-plane filters and a sinusoidal contraction channel flanked by a set of pores and nodes (Figure 1B). The in-plane filters have 25-μm-wide gaps and subsequently remove cellular clusters that would otherwise clog the contraction channel. The first node-pore region measures, with sufficient signal-to-noise ratio, the free cell size based on the Coulter principle (Balakrishnan et al., 2013, Balakrishnan et al., 2015, Coulter, 1953, Kim et al., 2018) (Table S2). With its periodically changing width (wc = wo+αcos(ωt), where wo, α, and ω are the initial width, strain amplitude, and deformation frequency, respectively) (Figure S1), the contraction channel measures the viscoelastic properties of transiting cells as they undergo a sinusoidal deformation (Figures 1C and Video S1). For the experiments described here, the contraction channel dimensions were chosen such that MCF-7 and MCF-10A cells were subject to the same strain, ɛ = 0.4 + 0.1cos(ωt) (Figure S2 and Table S1). Different periodic contraction channel lengths (Lp) were employed to control the deformation frequency applied to each cell type. Pressure-driven flow (13.7–27.6 kPa), via a commercial microfluidic flow controller (Elveflow, France), is used to drive 10–50 cells/min across the channel without coincidence events. By varying the flow rate, a wide range of ω is achieved even with the same Lp. A four-terminal measurement is employed to measure the current across the channel (Balakrishnan et al., 2013, Balakrishnan et al., 2015, Saleh and Sohn, 2001, Kim et al., 2018) (Figure S3). After low-pass filtering to remove noise from the measured signal, a derivative cutoff detection method is employed to identify the start and end time points of each sub-pulse (ΔInp and ΔIc in Figure 1D; Kim et al., 2018).
Figure 1.

Principle of Visco-NPS
(A) A photographic image of visco-NPS. The platform consists of a PDMS mold of a microfluidic channel bonded to a glass substrate with pre-defined electrodes (blue dashed box).
(B) A schematic of the microfluidic channel, which has three main features: a pore, a node, and a sinusoidal contraction channel (green dashed box). The outer electrodes apply a DC voltage across the channel, and the inner electrode pair measures the current across the channel. The in-plane filters, with their 25-μm gaps, prevent cellular clusters from entering the contraction channel. The inset shows the sinusoidal geometry of the contraction channel. The width of channel (wc) gradually changes as a cosine function (w0+αcos(ωt)). Lp, w0, α, and ω correspond to the contraction channel's periodic length, initial width, strain amplitude, and deformation frequency, respectively.
(C) Time snapshots of an MCF-10A cell in each region of the microfluidic channel with the time sequence indicated by the red arrowheads (see Video S1 for detailed information). Because wc (=8.75 + 1.5cos(ωt)) gradually changes along the channel length (Lp = 1,000 μm), the sinusoidal geometry of the contraction channel is not visible with the naked eye (Figure S1).
(D) Expected current pulse produced by a cell transiting the microfluidic channel. ΔInp and ΔIc correspond to the current drop by a cell transiting a node-pore and the contraction channel, respectively. The periodically changing width of the contraction channel causes the current drop to have the shape of sinusoidal function (red solid line). ΔTc indicates the time duration of a cell transiting through the entire contraction channel. The inset shows an actual current pulse produced by an MCF-7 cell traversing a microfluidic channel with Lp = 500 μm, a flow rate of 1.89 mm3/min, and wc of 10.5 + 1.5cos(ωt).
See also Figures S1–S3; see also Tables S1 and S2.
MCF-10A cells enter the contraction channel whose periodic length, Lp, is 1,000 μm. A non-pulsatile pressure (13.8 kPa) at the channel inlet causes the cells to flow through the pore at a velocity, vpore, of 16 mm/s. Video was recorded with 1,000 fps and played at 5 fps (i.e., 200× slower than real time)
To validate statistical significance, an unpaired t test, a two-way ANOVA test, or a Pearson correlation coefficient test was performed. Power analysis was employed to ensure that the measured sample size provides adequate power (>0.80) to detect statistical differences compared with their control groups with 95% confidence intervals. All experimental groups with p <0.05 showed sufficient power value with the analyzed sample size (n = 100) (Table S3). All data presented in this study were measured using two different microfluidic devices per experimental case to ensure repeatability of results. For example, the storage modulus (G′) of MCF-10A cells was measured with two different device replicas. A comparison of the results showed no statistical difference (Figure S4).
Theoretical Model for Visco-NPS
Strain values correspond to the amount of cellular deformation in the contraction channel. By definition, strain (ɛ) is determined by the free-cell diameter (Dcell) and width of the contraction channel (wc). As wc is periodic along the channel's longitudinal axis, so, too, is ɛ,
| (Equation 1a) |
| (Equation 1b) |
where ɛ0, ɛp, and ω denote the strain amplitude, compressive pre-strain, and deformation frequency, respectively. For the experiments and results we present here, we designed and utilized a contraction channel whose ɛ = 0.4 + 0.1cos(ωt) (Table S1).
To determine the stress value (σ) of a cell within our contraction channel, we first analyzed the external forces surrounding a deformed cell. As it transits the contraction channel and deforms, a cell is subject to driving (Fdrive) and drag forces (Figure S5). Fdrive is a result of the pressure distribution around the deformed cell (Equation 2). To calculate this force, we modeled (via COMSOL Multiphysics) the fluid dynamics within our device and used the specific flow rate and channel geometry we employed in our experiments as our parameters. With Fdrive, we then calculated the average pressure difference (ΔPavg) across the deformed cell in the channel's longitudinal axis direction (Equation 2). Frictional forces (Ffric) between the cell surface and channel wall (Figure S5), which are in the opposite direction of the flow, are defined by the frictional coefficient (μf) and normal force (Fn) (Equation 3).
| (Equation 2a) |
| (Equation 2b) |
| (Equation 3a) |
| (Equation 3b) |
As a cell transits the contraction channel with constant velocity (Figure S6), there is a zero net force around the deformed cell (Equation 4). Substituting Fdrive and Ffric into Equation 4, we determine σ from our fluidic conditions and the compressive deformation of cells (Equation 5).
| (Equation 4) |
| (Equation 5) |
With ɛ (Equation 1) and σ (Equation 5) defined for an individual cell, we employ a rheological stress-strain relationship to quantify a cell's viscoelastic properties. This relationship is defined in Equation 6, where σp, G′, and G″ indicate the pre-stress induced by ɛp, storage modulus (cell elasticity), and loss modulus (cell viscosity), respectively. Substituting Equation 1 (ɛ) and Equations 5 (σ) into Equation 6, we can subsequently numerically calculate the unknown variables, μf, σp, G′, and G″, using least squares fitting.
| (Equation 6) |
In addition to quantifying the viscoelastic properties of a cell at any given frequency, ω, we can utilize the power-law structural damping model (Fabry et al., 2001) to provide more information about a cell's dynamic behavior with respect to a wide range of frequencies. The complex modulus (G∗) is defined as
| (Equation 7a) |
| (Equation 7b) |
| (Equation 7c) |
where G0, α, and μ denote shear modulus at zero frequency, power-law exponent, and viscosity, respectively. G0 and ω0 are scaling factors for stiffness and frequency, and ω0 = 1 Hz in our experiments. All power-law components are numerically calculated by least squares fitting.
Measuring the Viscoelastic Properties of Epithelial Cells
We investigated and compared the viscoelastic properties of malignant MCF-7 and non-malignant MCF-10A breast epithelial cells. Both cell types were subject to periodic deformation as they traveled through our platform's sinusoidal contraction channel. By using contraction channels of different Lp in combination with a range of controlled flow rates, we were able to achieve a wide range of effective deformation frequencies (ω) for both MCF-7 and MCF-10A cell populations we measured. As shown in Figures 2A and 2B, ω ranged from 20 to 300 Hz for MCF-7 cells and from 20 to 200 Hz for MCF-10A cells. Each ω range was sufficiently large to quantify the dynamic response of the respective cell types. To determine how cell-channel interactions vary with respect to the cell types utilized in our studies and with respect to frequency, we measured μf (Figure S7). We observed no statistical difference among μf values for MCF-7 and MCF-10A cells throughout the entire frequency regime tested. We subsequently treated our channels with BSA and observed a 1.1% decrease in the mean value of μf for both MCF-7 and MCF-10A cells when compared with the untreated control case (Figure S7). Based on these results, we concluded that utilizing bare, untreated PDMS devices is appropriate under our given experimental conditions and that cell-surface interactions, although present, ultimately do not contribute significantly to the quantitative analysis of the cellular viscoelastic properties that our platform performs.
Figure 2.

Applied Effective Frequencies and Viscoelastic Properties of Breast Epithelial Cells
(A and B) Applied effective deformation frequency (ω) of (A) MCF-7 and (B) MCF-10A cells (n = 100 for all cases). Lp and vpore correspond to the period of the contraction channel length and the flow velocity at the pore before the contraction channel, respectively. By changing Lpand vpore, we can adjust the ω that cells experience in the contraction channel. Error bar represents standard deviation.
(C) Storage (G′, solid circle) and loss (G″, empty circle) moduli of MCF-7 and MCF-10A cells (n = 100 for all cases). Inset (top left) shows enlarged plot of G″. Solid and dashed lines indicate the power-law structural damping model (Equation 7) of the storage and loss moduli with respect to the effective deformation frequency (ω), respectively. MCF-7 cells have a smaller power-law exponent (α = 0.44 ± 0.006) than MCF-10A cells (α = 0.69 ± 0.005) (see Table 1 for detailed information). Overall, MCF-10A cells show a greater G′ compared with MCF-7 cells. Both cell lines have a much larger G′ value than G″ value. In the main plot, error bars in x and y axes correspond to standard deviation. In the inset, error bars in x and y axes correspond to standard deviation and standard error, respectively.
See also Figures S4–S7.
Figure 2C shows the storage (G′) and loss (G″) moduli (i.e., elasticity and viscosity, respectively) of MCF-7 and MCF-10A cells. Throughout the entire range of the effective frequency we tested, G′ for MCF-10A cells is greater than that for MCF-7 cells, indicating that these cells are generally stiffer. To investigate the frequency-dependent viscoelastic response of cells, we employed the power-law structural damping model (solid and dashed lines in Figure 2C). Table 1 provides the measured power-law components—G0 (scaling factor), α (power-law exponent), and μ (Newtonian viscosity)—that we derived from measuring both cell types. As indicated in Table 1, α is much larger for MCF-10A than MCF-7 cells (0.69 versus 0.44), reflecting the fact that their G′ increased more rapidly with deformation frequency. Physically, MCF-10A cells have a far stiffer mechanical response to increasing ω when compared with MCF-7 cells. With regard to viscous behavior, both cell types have exceedingly small G″ values when compared with G′ throughout the entire frequency regime tested, with MCF-10A cells having a G″ value only slightly greater than that of MCF-7 cells (Figure 2C and inset). The very small G″ values we obtain indicate that both malignant and non-malignant breast epithelial cell lines have “solid-like behavior,” i.e., they have low viscosity. This is remarkably different from that observed at the tissue level, where malignant breast tissue has been shown to exhibit a more viscous response to oscillating stimuli when compared with normal tissue (Sinkus et al., 2005).
Table 1.
Parameters of the Power-Law Structural Damping Model with Corresponding Standard Error
| G0 [Pa] | α | μ [Pa s] | |
|---|---|---|---|
| MCF-7 | 396.42 ± 12.438 | 0.44 ± 0.006 | 2.17 ± 0.045 |
| MCF-10A | 235.02 ± 5.789 | 0.69 ± 0.005 | 2.15 ± 0.074 |
G0, α, and μ denote the shear modulus at zero frequency, power-law coefficient, and viscosity, respectively.
Contribution of Cytoskeletal Components to Cellular Properties
The cytoskeleton is an important component governing cellular mechanical behavior (Fletcher and Mullins, 2010). To investigate the individual contributions of cytoskeletal actin filaments and microtubules to the mechanical properties of cells, we analyzed the viscoelastic response of MCF-7 and MCF-10A cells when they were subject to different pharmacological treatments. Specifically, we stabilized actin filaments with jasplakinolide (Jas, Figures 3A and 3D) and de-activated them with latrunculin B (LatB, Figures 3A and 3D). In parallel, we stabilized and destabilized microtubules with paclitaxel (TAX) and nocodazole (Noc) treatment, respectively. We performed all measurements at ω > 100 Hz to provide a sufficient window to detect different viscoelastic responses between the two cell types. As shown in Figures 3B and 3E, stabilized actin filaments led to an increased G′ for both cell types versus the respective controls, indicating that the treated cells had become stiffer. In contrast, de-activated actin filaments led to a decreased G′ and the treated cells had become softer. With regard to specific cell type, Jas and LatB treatment had the strongest effect on G′ at different frequencies, ωavg = 275 Hz for MCF-7 cells and ωavg = 100 Hz for MCF-10A cells, indicating that actin filaments have different frequency ranges in which they are actively engaged. The difference in actin filament behavior between MCF-7 and MCF-10A cells may be a result of their structural and functional differences, which in turn, are correlated with malignancy and metastatic potential (Lindberg et al., 2008, Proietti et al., 2018, Geltmeier et al., 2015). In terms of cell viscosity, both Jas- and LatB-treated MCF-7 and MCF-10A cells have extremely small values of G″ when compared with Gʹ (Figures 3C and 3F). Interestingly, both Jas and LatB treatment enhanced the viscous behavior of MCF-10A cells (noted as larger G″ values in our data when compared with the control untreated cells, Figure 3F), but further study is necessary to understand the biological basis of this phenomena.
Figure 3.

Contribution of Actin Filaments to Cellular Viscoelastic Properties
(A) Fluorescence images of MCF-7 cells after jasplakinolide (Jas) and latrunculin B (LatB) treatment. For comparison, fluorescence images of untreated cells (Ctrl) are also included. 4′,6-diamidino-2-phenylindole (DAPI, blue) and rhodamine phalloidin (red) were used to stain the cell nucleus and actin filaments, respectively. Scale bar, 10 μm.
(B) Storage modulus (G′) of treated MCF-7 cells per the different ranges of effective deformation frequency (ω) (n = 100 for all cases). Jas treatment stabilizes actin filaments, and LatB treatment de-activates them. Untreated cells were used as a control (Ctrl) case. Statistical differences were determined by an unpaired t test. Within each box, the central line is the median, the red cross is an outlier, and the edges of the box correspond to 25% and 75% of the population.
(C) Loss modulus (G″) of Jas- and LatB-treated MCF-7 cells compared with untreated (Ctrl) cells (n = 100 for each case). Error bars indicate standard error.
(D) Fluorescence images of MCF-10A cells after Jas and LatB treatment. For comparison, fluorescence images of untreated cells (Ctrl) are also included. DAPI (blue) and rhodamine phalloidin (red) were used to stain the cell nucleus and actin filaments, respectively. Scale bar, 10 μm.
(E) Storage modulus (G′) of treated MCF-10A cells per the different ranges of effective deformation frequency (ω) (n = 100 for all cases). Statistical differences were determined by an unpaired t test. Within each box, the central line is the median, the red cross is an outlier, and the edges of the box correspond to 25% and 75% of the population.
(F) Loss modulus (G″) of Jas- and LatB-treated MCF-7 cells compared with untreated (Ctrl) cells (n = 100 for each case). Error bars indicate standard error. For all graphs *p ≤ 0.05, **p ≤ 0.01, ***p ≤ 0.001, and ****p ≤ 0.0001. See also Table S3.
Figures 4A and 4D show the viscoelastic properties of MCF-7 and MCF-10A cells after microtubule stabilization and de-activation. Stabilization resulted in an increased G′ for MCF-7 cells, whereas disruption of microtubule formation led to a reduced G′ for both cell types throughout all applied frequencies (Figures 4B and 4D). Both pharmacological microtubule treatments on MCF-7 cells showed the most significant effects at ωavg = 125 Hz (Figure 4B). Noc treatment, especially, revealed a bipolar effect on elasticity (G′) measurements. At ωavg = 125 Hz, cells softened, which was reflected in the significantly smaller G′ values when compared with untreated cells. At ωavg = 200 Hz, the difference in G′ is relatively smaller than other frequencies. At ωavg = 275 Hz, G′ of cells significantly decreased again by Noc treatment. For MCF-10A cells, disrupting microtubules via Noc treatment showed stronger effects on cellular elasticity when compared with stabilizing them with TAX treatment throughout the frequency range we tested (Figure 4D). Significantly, at ωavg = 180 Hz, the overall values of G′ for MCF-10A cells decreased by TAX treatment, in contrast to other frequency conditions. This suggests that the dynamics of cytoskeletal filament formation induce different cellular mechanical behavior of cells and depend on loading conditions, i.e., frequency (Gardel et al., 2008, Brangwynne et al., 2006, Fletcher and Mullins, 2010). Similar to our results on the viscosity of cells after Jas and LatB treatments, both TAX- and Noc-treated cells showed a much smaller G″ when compared with G′ (Figures 4C and 4F), indicating that the cells consistently have a solid-like behavior. Finally, whereas TAX-treated MCF-7 cells have an increased G″ in the high-frequency range, TAX-treated MCF-10A cells have a decreased G″ with respect to increasing deformation frequency (Figure 4F).
Figure 4.

Contribution of Microtubules to Cellular Viscoelastic Properties
(A) Fluorescence images of MCF-7 cells after paclitaxel (TAX) and nocodazole (Noc) treatment. For comparison, fluorescence images of untreated cells are shown as the control case (Ctrl). DAPI (blue) and green fluorescence protein (GFP, green) stain cell nucleus and tubulin, respectively. Scale bar, 10 μm.
(B) Storage modulus (G′) of treated MCF-7 cells with respect to pharmacological treatments per the different range of effective deformation frequency (ω) (n = 100 for all cases). TAX treatment stabilizes microtubules, whereas Noc treatment de-activates them. Untreated cells were used as a control (Ctrl) case. Statistical differences were determined by an unpaired t test. Within each box, the central line is the median, the red cross is an outlier, and the edges of the box correspond to 25% and 75% of the population.
(C) Loss modulus (G″) of TAX- and Noc-treated MCF-7 cells compared with untreated (Ctrl) cells (n = 100 for each case). Error bars indicate standard error.
(D) Fluorescence images of MCF-10A cells after TAX and Noc treatment. For comparison, fluorescence images of untreated cells are shown as the control case (Ctrl). DAPI (blue) and green fluorescence protein (GFP, green) stain cell nucleus and tubulin, respectively. Scale bar, 10 μm.
(E) Storage modulus (G′) of treated MCF-10A cells with respect to pharmacological treatments per the different range of effective deformation frequency (ω) (n = 100 for all cases). Statistical differences were determined by an unpaired t test. Within each box, the central line is the median, the red cross is an outlier, and the edges of the box correspond to 25% and 75% of the population.
(F) Loss modulus (G″) of TAX- and Noc-treated MCF-10A cells compared with untreated (Ctrl) cells (n = 100 for each case). Error bars indicate standard error. For all graphs, *p ≤ 0.05, **p ≤ 0.01, ***p ≤ 0.001, and ****p ≤ 0.0001. See also Table S3.
Cellular Mechanical Transition through Cell-Cycle Phases
Cells experience dramatic changes to their cytoskeleton and nucleus during the cell cycle (Baluska and Barlow, 1993, Rusan et al., 2001), and correspondingly these changes should induce different cellular mechanical behaviors. We thus analyzed the viscoelastic properties of MCF-7 cells that were synchronized in their cell cycle via a double thymidine block and release protocol (see Transparent Methods) and evaluated the effects of actin filament de-activation during each cell-cycle phase. Figures 5A and S8 show the morphological changes that MCF-7 cells undergo as they progress through the different cell-cycle phases, from G1- to S- to G2- to M-phase. As expected, the relative size of the nuclei increases during S-phase and stained nuclei show the classical spike shape of mitosis in M-phase. By immunostaining nuclear DNA, we validated cell synchronization and confirmed that DNA content increased as the cells traversed their cell cycle (Figure 5A). We screened synchronized MCF-7 cells with visco-NPS at ω = 200 Hz. Our results show that the G′ of MCF-7 cells clearly increases as they go from G1- to S- to G2-phase. As the cells progress from G2- to M- back to G1-phase, there is a significant decrease in G′ (Figure 5B). Our results show that the elasticity of MCF-7 cells is highly dependent on the cell-cycle phase. Cells have the stiffest mechanical response in the G2-phase, suggesting that the combined contribution of cytoskeletal filaments and the nucleus in this phase are mechanically the most stable. This is consistent with the fact that, in the G2-phase, cells experience the maximum accumulation of cytoplasmic material, assembly of microtubules, and structuring of the nuclear envelope, all in preparation for division. Furthermore, this mechanical stability reverses upon transitioning from G2 to M as the nuclear envelope breaks down, enabling the mitotic spindle to separate the sister chromatids.
Figure 5.

Cellular Mechanical Transition through Cell-Cycle Phases
(A) Normalized DAPI intensity of MCF-7 cells with respect to cell-cycle phases (G1-phase, n = 398; S-phase, n = 400; G2-phase, n = 457; and M-phase; n = 390). The condensation of nuclear DNA into chromosome structures during M-phase resulted in the strongest DAPI intensity. Error bars represent standard deviation. Outliers over three standard deviations of the mean were removed.
(B) Storage modulus (G′) of untreated and LatB-treated (purple) MCF-7 cells throughout the different cell-cycle phases, as measured with a 200 Hz effective deformation frequency (n = 100 for all cases). The individual and combined statistical effects of LatB treatment and cell-cycle phases were determined by a two-way ANOVA test. Both LatB treatment (p = 6.806 × 10−37) and cell-cycle phases (p = 1.132 × 10⁻³²) have significant statistical effects on change of Gʹ. The interaction of these two factors also shows a significant statistical effect on G′ as having low p value (p = 6.781 × 10⁻⁸). Within each box, the central line is the median, the red cross is an outlier, and the edges of the box correspond to 25% and 75% of the population.
(C) Loss modulus (G″) of untreated and LatB-treated (inset) MCF-7 cells throughout the different cell-cycle phases with ωavg = 200 Hz (n = 100 for all cases).
Error bars represent standard error. For all graphs, *p ≤ 0.05 and **p ≤ 0.01, respectively. See also Figure S8.
To analyze the contribution of the nucleus to the viscoelastic properties measured, we de-polymerized actin filaments in each cell-cycle phase via LatB treatment. In general, we measured lower G′ values versus untreated cells, indicating that the cells had softened. Similar to our result on cellular elasticity, LatB-treated cells also showed the largest G′ value in G2 phase (Figure 5B). We evaluated the statistical difference among all experimental conditions based on correlation coefficient (rho) and p values (Table 2). G1 + LatB versus G2 + LatB, G2 + LatB versus M, S + LatB versus M + LatB, G2 versus M + LatB, and G2 + LatB versus M + LatB showed significant statistical difference. From this, we conclude that the cell nucleus in G1-, G2-, and M-phases greatly contributes to cellular elasticity. To quantify the statistical effect of the two variables, i.e., cell-cycle phase and LatB treatment, we performed a two-way ANOVA test and showed that both cell-cycle phase (p = 6.781 × 10⁻⁸) and LatB treatment (p = 6.806 × 10−37) had a statistically significant effect on the G′ of MCF-7 cells. In addition, the combined effect of these two variables also had a significant effect on the G′ of MCF-7 cells (p = 6.781 × 10⁻⁸). Cellular viscosity (G″) showed a trend similar to elasticity (G′) regarding cell-cycle phase and LatB treatment. MCF-7 cells in G2-phase exhibited the largest G″ value in both untreated and LatB-treated groups (Figure 5C). As well, the perturbation of actin filaments by LatB treatment resulted in a decrease in G″ compared with untreated cells during each cell-cycle phase. Strikingly, LatB-treated MCF-7 cells showed a more dramatic decrease of G″ in S-phase (Figure 5C inset). In S-phase, cellular DNA is actively being unwound by helicases and replicated and might therefore be less mechanically stable than DNA packaged around histones and in chromosomes. In general, visco-NPS provides sufficient sensitivity to measure the contributions of actin filaments and nuclear structure to the cellular viscoelastic properties throughout the different cell-cycle phases.
Table 2.
Correlation Coefficient (rho) and p Value between Storage Modulus (G′) of Each Experimental Case
| versus | G1 | G1 + LatB | S | S + LatB | G2 | G2 + LatB | M | M + LatB |
|---|---|---|---|---|---|---|---|---|
| G1 | NA | rho = −0.050 p = 0.631 |
rho = −0.122 p = 0.242 |
rho = 0.010 p = 0.925 |
rho = −0.071 p = 0.502 |
rho = 0.181 p = 0.083 |
rho = 0.098 p = 0.349 |
rho = −0.059 p = 0.576 |
| G1 + LatB | NA | rho = 0.053 p = 0.611 |
rho = 0.170 p = 0.104 |
rho = 0.149 p = 0.155 |
rho = 0.259 *p = 0.012 |
rho = −0.079 p = 0.455 |
rho = 0.193 p = 0.063 |
|
| S | NA | rho = −0.032 p = 0.764 |
rho = 0.036 p = 0.731 |
rho = −0.064 p = 0.542 |
rho = 0.201 p = 0.053 |
rho = −0.102 p = 0.332 |
||
| S + LatB | NA | rho = 0.016 p = 0.875 |
rho = 0.197 p = 0.058 |
rho = 0.054 p = 0.607 |
rho = 0.228 *p = 0.028 |
|||
| G2 | NA | rho = 0.062 p = 0.557 |
rho = 0.023 p = 0.828 |
rho = 0.304 **p = 0.003 |
||||
| G2 + LatB | NA | rho = 0.221 *p = 0.033 |
rho = 0.286 **p = 0.006 |
|||||
| M | NA | rho = 0.030 p = 0.772 |
||||||
| M + LatB | NA |
Larger ρ value indicates more highly correlated relationship between the cases. G1, S, G2, M, and LatB denote Gap 1 phase, Synthesis phase, Gap 2 phase, Mitosis phase, and Latrunculin B treatment, respectively. *p ≤ 0.05 and **p ≤ 0.01.
SLUG-Initiated Epithelial-Mesenchymal Transition Induces Cellular Mechanical Changes
To highlight further the power and sensitivity of our platform in detecting dynamic state changes in cells, we initiated EMT re-programming in MCF-10A cells and studied the effects of this stimulation on cellular viscoelastic properties. EMT is a cellular program that assumes diverse roles in biology, from embryogenesis to wound healing to tumor progression, in which epithelial characteristics of tight cell-cell junctions and polarity are attenuated in favor of a migratory and invasive, mesenchymal-like phenotype (Kalluri and Weinberg, 2009, Yang and Weinberg, 2008). SLUG, a member of the Snail family transcription factors, has been identified as one of many dynamic regulators of EMT, driving a key hallmark of this transition—namely, E-cadherin downregulation by binding to the E-boxes of the E-cadherin promoter and repressing transcription (Shih and Yang, 2011, Yang and Weinberg, 2008). Here, we activated the EMT cascade by transducing MCF-10A cells with a retroviral vector expressing SLUG. As EMT has been described as a dynamic spectrum with transitional states in which epithelial cells adopt any permutation of mesenchymal characteristics, we first characterized the phenotypic changes caused by the induction of SLUG, comparing against untreated MCF-10A cells (Aiello et al., 2017, Nieto et al., 2016, Brabletz et al., 2018, Micalizzi et al., 2010). One of the first changes that we observed was in terms of morphology (Figure S9). Normal MCF-10As adopted classical epithelial morphology with “cobblestone” appearance and apical-basal polarity, whereas our virus-infected cells exhibited a greater degree of cell spreading, increased cell lamellipodia and filopodia, and disassembly of intercellular junctions, all of which are consistent with EMT (Lamouille et al., 2014). We then proceeded to compare the expression patterns of a panel of common EMT markers: SLUG, E-cadherin, vimentin, and N-cadherin (Zeisberg and Neilson, 2009). As shown in Figure 6A, the key difference that we observed for SLUG expression between the two cell types was in subcellular localization of the transcription factor. Specifically, SLUG-transduced MCF-10A cells showed enhanced localization of SLUG to cell nuclei (Figures 6A(i) and 6B), suggesting elevated regulation of gene expression versus normal MCF-10As, in which the transcription factor appeared largely excluded from nuclei and unable to bind to the E-cadherin promoter. The observed SLUG translocation in the SLUG-transduced MCF-10A cells was sufficient to induce, not surprisingly, a reduction in E-cadherin expression (Figure 6A(iii)) and also an upregulation in vimentin (Figure 6A(ii)), both of which have been implicated in cancerous tissues transitioning to a mesenchymal state (Zeisberg and Neilson, 2009). However, SLUG transduction did not result in E-cadherin to N-cadherin switching (Figure 6A(iv) and S10). Our SLUG-transduced MCF-10As, therefore, appeared to have acquired an intermediate EMT phenotype, which is consistent with the work of others within the field that overexpressed SLUG and also reported decreased E-cadherin and increased vimentin expression (Bolós et al., 2003, Côme et al., 2004, Lee et al., 2008, Vuoriluoto et al., 2011). Having validated a transitioned state, we then investigated the mechanical cell properties of untreated versus EMT-initiated cell states using our device. We found that SLUG MCF-10A cells exhibited significantly larger Gʺ (i.e., they were more viscous) than untreated MCF-10A cells, despite both cells possessing a similar level of Gʹ (Figures 6C and 6D). Although further in-depth study is required to dissect fully the underlying biological contributions, we, nonetheless, have observed morphological, phenotypic, and viscoelastic changes of cells as they undergo an induced EMT via SLUG (Voulgari and Pintzas, 2009, Zhang et al., 2014).
Figure 6.

Viscoelastic Properties through Epithelial-Mesenchymal Transition (EMT)
(A) Immunofluorescence images of MCF-10A and SLUG-induced MCF-10A cells with staining for DNA (DAPI, blue) and (i) the transcription factor SLUG (red), (ii) the EMT-associated filamentous protein vimentin (magenta), (iii) intracellular junction marker E-cadherin (green), and (iv) intracellular junction marker N-cadherin (yellow). SLUG-induced cells demonstrate elevated localization of SLUG to cell nuclei, upregulation of vimentin expression, downregulation of E-cadherin expression, and no visible change in N-cadherin expression. Scale bar, 100 μm.
(B) Immunofluorescence scanning confocal images for DNA (DAPI, blue) and SLUG (red). Isolated fluorescence channel for SLUG (gray scale) show clearer localization of SLUG within cell nuclei (example cells marked with yellow arrows). Scale bar, 5 μm.
(C) G′ of normal (red) and SLUG-expressed (black) MCF-10A cells (normal; n = 100 and +SLUG; n = 90) at ω = 100 Hz. No statistical difference was found between MCF-10A and SLUG-induced cells. Within each box, the central line is the median and the edges correspond to 25% and 75% of the G′ distribution.
(D) G″ of normal (red) and SLUG-expressed (black) MCF-10A cells (normal; n = 100 and + SLUG; n = 90) at ω = 100 Hz. EMT induces significant increase of G″ of cells. Error bars represent standard error. ****p ≤ 0.0001.
See also Figures S9 and S10.
Discussion
Visco-NPS enables the analysis of populations of single cells for their viscoelastic properties. By combining a sinusoidal contraction channel with node-pore sensing (Balakrishnan et al., 2013) or mechano-NPS (Kim et al., 2018), we can quantify the mechanical response of cells as they periodically deform. Based on just two mechanical properties, storage (elasticity) and loss (viscosity) moduli, malignant and non-malignant breast epithelial cells show distinctly different viscoelastic behavior and frequency-dependent responses to dynamic loading conditions. Yet, for all frequencies measured, each cell type's viscosity was smaller than its elasticity. These results are in direct contrast to prior AFM studies measuring the same cell types, which report that viscosity has a greater value than elasticity above a threshold frequency (Charras and Horton, 2002, Alcaraz et al., 2003, Haase and Pelling, 2015, Rother et al., 2014). Likewise, our results that centered on the effects of EMT on cell viscoelastic behavior differ from those studies in which EMT had been induced in cells by transforming growth factor-β1 and subsequently measured via AFM (Schneider et al., 2013, Efremov et al., 2017). In these studies, EMT-induced cells were shown to exhibit more solid-like behavior and greater energy storage, which is in contrast with our findings that such cells exhibit more viscous behavior. The discrepancy between these results more than likely rests upon the fundamental differences between the two characterization modalities—AFM and visco-NPS—with regard to how they probe cells. Visco-NPS measures whole-cell mechanical properties, whereas AFM targets localized, cellular sub-regions. Equally important, visco-NPS measures cells in suspension and, arguably, in a more unbiased state, as AFM requires cells to be adhered to a substrate. In the latter case, substrate stiffness, topography, and porosity are all key material parameters that are capable of re-modeling the numerous components of the cytoskeleton and, thus, modulating cell mechanics. This is especially important to consider with regard to our EMT experiments in which we observed a dramatic upregulation of vimentin expression, which is well known to affect the mechanical properties of epithelial cells (Guo et al., 2013, Hu et al., 2018). Mendez et al. report that the biomechanical contributions of vimentin intermediate filaments depend greatly on the stiffness of the substrate upon which cells are immobilized for AFM (Mendez et al., 2014). Thus, in general, compared with visco-NPS, AFM requires an extra step of de-coupling substrate properties from observed cell mechanical phenomena.
As we have shown, visco-NPS can determine the individual contributions of cytoskeletal components, such as actin filaments and microtubules, to cellular viscoelastic properties. Furthermore, through pharmacological treatments, in which we stabilized or de-activated cytoskeletal filaments or microtubules, visco-NPS can quantitatively measure the subsequent effects on the elasticity and viscosity of the treated cells. Finally, the sensitivity of visco-NPS enables measurement of the changes in mechanical properties of cells as they traverse their cell cycle or are initiated into EMT. In general, visco-NPS provides a comprehensive understanding of the dynamic mechanical behavior of cells.
Attractive features of visco-NPS are that it is label free, does not require a high-speed camera or advanced fluidics, and has high-throughput capability. Its simplicity allows it be combined potentially with other cell analyses, including cell-surface marker screening (Balakrishnan et al., 2015) and single-cell whole-transcriptome analysis (Shapiro et al., 2013, White et al., 2011, Streets et al., 2014). This, in particular, would provide opportunities to correlate mechanical properties with biochemical properties. The design flexibility of visco-NPS allows us to utilize a variety of experimental conditions, models, and mechanical tests for further studies. By varying the width and period of the sinusoidal contraction channel, one can apply different levels of strain to, and can access different frequency regimes in which to measure, cells. Moreover, contraction channels with different periodic lengths placed in series would allow one to measure a single cell at multiple deformation frequencies. In so doing, one can determine the frequency dependence of the cell's viscoelastic properties, which ultimately would provide a more in-depth understanding of the cellular mechanical properties at the single-cell level.
Although we have focused on the power-law structural damping model, other mechanical models (Lim et al., 2006) are applicable to this platform. For example, cortical shell-liquid core (Yeung and Evans, 1989), linear viscoelastic solid (Karcher et al., 2003, Schmid-Schönbein et al., 1981), and biphasic models (Leterrier, 2001, Haider, 2004) could all be applied to different cell types and their corresponding biophysical function. By modifying the microfluidic channel design, one can perform different types of mechanical tests. For example, one could perform a mechanical creep test by applying a constant compressive stress to the deformed cells through pneumatic side channels positioned parallel to the sides of the sinusoidal contraction channel. Such a test could provide an understanding of the biophysical relationship between mechanical properties and cell recovery characteristics (Bonakdar et al., 2016). Even in its present form, visco-NPS, can successfully measure the viscoelastic properties of cells under various biological conditions, as we have demonstrated here.
Cellular mechanics is an emerging area of research, especially within the context of cancer (Kumar and Weaver, 2009, Goldmann et al., 2013, Peyton et al., 2007). Quantifying the viscoelastic properties of cell populations, visco-NPS introduces new possibilities in basic biology and clinical applications, such as cancer diagnosis, cytoskeleton-targeted drug screening, studies for cell cycle as a therapeutic target of cancer, and EMT-induced cellular mechanical transition. By combining the clear relationship between malignancy and viscoelastic properties of cells with numerous features of our platform (e.g., label-free analysis and high-throughput capability), visco-NPS could potentially be used as a cancer screening and diagnostic tool, especially for those cancer cells, e.g., triple-negative breast cancer, that are otherwise difficult to identify with traditional methods (Dent et al., 2007, Schneider et al., 2008, Hudis and Gianni, 2011). As it can quantify the contribution of cytoskeletal filaments to whole-cell mechanical properties, visco-NPS could be employed as a screening method for the cytoskeleton-targeted drugs that are often used in cancer therapies (Martin et al., 2014, Checchi et al., 2003, Tommasi et al., 2007). Recently, a number of studies have shown that cell-cycle pathways, such as regulation of CDK (cyclin-dependent kinases), ATM (ataxia telangiectasia mutated), and ATR (AMT- and Rad3-related), lead to aberrant cell proliferation and are critical to carcinogenesis (Hartwell and Kastan, 1994, Kastan and Bartek, 2004, Abraham, 2001, Smith et al., 2010). By analyzing the cellular mechanical transitions during the cell cycle and quantifying the mechanical properties of actin filaments as they are perturbed during each phase, visco-NPS could yield a new approach to the development of cancer therapies that target these, and other, cell-cycle pathways.
Visco-NPS is an electronic-based, high-throughput, single-cell analysis method that can quantify viscoelastic properties of cell populations with respect to a wide range of deformation frequencies. As demonstrated, measurement of a cell's storage and loss moduli in combination with the power-law structural damping model provides a quantitative mechanical metric for comparing different cell types, evaluating cytoskeletal contributions to cellular properties, and analyzing cellular mechanical transitions through the different phases of the cell cycle or other significant morphological and phenotypic changes, such as EMT. Visco-NPS thus has great potential to be utilized as an efficient measurement tool for those basic research and clinical applications that require characterization of cellular mechanics.
Limitation of Study
There are some possible drawbacks of the present study. First, we focused on cells from breast tissue to analyze cellular viscoelastic properties. Studying cells from other tissues could provide more broad information regarding the relationship between different cancers and cellular mechanical properties. Second, all cells tested in this study were epithelial cell lines (MCF-7 and MCF-10A) rather than patient-derived cells. Third, visco-NPS in its current platform design measures a single cell at only one specific deformation frequency. Thus the frequency dependence of cellular viscoelastic properties can only be assessed for populations of cells versus individual cells. Fourth, measuring the whole-cell properties via visco-NPS resulted in significantly smaller values of cellular viscosity (i.e., loss modulus, G″) when compared with elasticity (i.e., storage modulus, G′) for most of experimental cases, which could limit the resolution of measurement.
Methods
All methods can be found in the accompanying Transparent Methods supplemental file.
Acknowledgments
We thank R. Banchs-Falcon, T. Carey, M. Kozminsky, and H. You for helpful discussions and critical reading of this manuscript. This research was partially funded by NIH/NIBIB, United States 1R01EB024989-01, NIH/NCI, United States 1R21CA182375-01A1, and a generous gift from Michael and Margaret Checca. J.K. is supported by the Jungsong Foundation, Republic of Korea and a John and Janet McMurtry Fellowship.
Author Contributions
J.K. conceived of the device and method and performed the visco-NPS measurements; O.J.S. performed the viral packaging and viral transduction of SLUG; B.L. and O.J.S. contributed to the cytoimmunochemistry characterization of SLUG-infected MCF-10A cells; Y.K. assisted with the fabrication of the devices and performed tissue culture; J.K., B.L., and L.L.S. analyzed the results; J.K., B.L., and L.L.S. devised experiments; J.K. and B.L. performed FACS; and J.K., B.L., O.J.S., and L.L.S. wrote the manuscript.
Declaration of Interests
L.L.S. and J.K. are inventors of a pending patent (U.S. Patent: 62/571,255 PCT/US17/5642), which covers the design of the visco-NPS platform introduced in this article.
Published: March 29, 2019
Footnotes
Supplemental Information can be found online at https://doi.org/10.1016/j.isci.2019.02.021.
Supplemental Information
References
- Abraham R.T. Cell cycle checkpoint signaling through the ATM and ATR kinases. Genes Dev. 2001;15:2177–2196. doi: 10.1101/gad.914401. [DOI] [PubMed] [Google Scholar]
- Aiello N.M., Brabletz T., Kang Y., Nieto M.A., Weinberg R.A., Stanger B.Z. Upholding a role for EMT in pancreatic cancer metastasis. Nature. 2017;547:E7–E8. doi: 10.1038/nature22963. [DOI] [PMC free article] [PubMed] [Google Scholar]
- Alcaraz J., Buscemi L., Grabulosa M., Trepat X., Fabry B., Farré R., Navajas D. Microrheology of human lung epithelial cells measured by atomic force microscopy. Biophys. J. 2003;84:2071–2079. doi: 10.1016/S0006-3495(03)75014-0. [DOI] [PMC free article] [PubMed] [Google Scholar]
- Altman G., Horan R., Martin I., Farhadi J., Stark P., Volloch V., Vunjak-Novakovic G., Richmond J., Kaplan D.L. Cell differentiation by mechanical stress. FASEB J. 2002;16:270–272. doi: 10.1096/fj.01-0656fje. [DOI] [PubMed] [Google Scholar]
- Balakrishnan K.R., Anwar G., Chapman M.R., Nguyen T., Kesavaraju A., Sohn L.L. Node-pore sensing: a robust, high-dynamic range method for detecting biological species. Lab Chip. 2013;13:1302–1307. doi: 10.1039/c3lc41286e. [DOI] [PubMed] [Google Scholar]
- Balakrishnan K.R., Whang J.C., Hwang R., Hack J.H., Godley L.A., Sohn L.L. Node-pore sensing enables label-free surface-marker profiling of single cells. Anal. Chem. 2015;87:2988–2995. doi: 10.1021/ac504613b. [DOI] [PMC free article] [PubMed] [Google Scholar]
- Baluska F., Barlow P. The role of the microtubular cytoskeleton in determining nuclear chromatin structure and passage of maize root cells through the cell cycle. Eur. J. Cell Biol. 1993;61:160–167. [PubMed] [Google Scholar]
- Benham-Pyle B.W., Pruitt B.L., Nelson W.J. Mechanical strain induces E-cadherin–dependent Yap1 and β-catenin activation to drive cell cycle entry. Science. 2015;348:1024–1027. doi: 10.1126/science.aaa4559. [DOI] [PMC free article] [PubMed] [Google Scholar]
- Bolós V., Peinado H., Pérez-Moreno M.A., Fraga M.F., Esteller M., Cano A. The transcription factor Slug represses E-cadherin expression and induces epithelial to mesenchymal transitions: a comparison with Snail and E47 repressors. J. Cell Sci. 2003;116:499–511. doi: 10.1242/jcs.00224. [DOI] [PubMed] [Google Scholar]
- Bonakdar N., Gerum R., Kuhn M., Spörrer M., Lippert A., Schneider W., Aifantis K.E., Fabry B. Mechanical plasticity of cells. Nat. Mater. 2016;15:1090. doi: 10.1038/nmat4689. [DOI] [PubMed] [Google Scholar]
- Brabletz T., Kalluri R., Nieto M.A., Weinberg R.A. EMT in cancer. Nat. Rev. Cancer. 2018;18:128. doi: 10.1038/nrc.2017.118. [DOI] [PubMed] [Google Scholar]
- Brangwynne C.P., Mackintosh F.C., Kumar S., Geisse N.A., Talbot J., Mahadevan L., Parker K.K., Ingber D.E., Weitz D.A. Microtubules can bear enhanced compressive loads in living cells because of lateral reinforcement. J. Cell Biol. 2006;173:733–741. doi: 10.1083/jcb.200601060. [DOI] [PMC free article] [PubMed] [Google Scholar]
- Cabrera-Benítez N.E., Parotto M., Post M., Han B., Spieth P.M., Cheng W.-E., Valladares F., Villar J., Liu M., Sato M. Mechanical stress induces lung fibrosis by epithelial-mesenchymal transition (EMT) Crit. Care Med. 2012;40:510. doi: 10.1097/CCM.0b013e31822f09d7. [DOI] [PMC free article] [PubMed] [Google Scholar]
- Cartagena-Rivera A.X., Wang W.-H., Geahlen R.L., Raman A. Fast, multi-frequency, and quantitative nanomechanical mapping of live cells using the atomic force microscope. Sci. Rep. 2015;5:11692. doi: 10.1038/srep11692. [DOI] [PMC free article] [PubMed] [Google Scholar]
- Charras G.T., Horton M.A. Single cell mechanotransduction and its modulation analyzed by atomic force microscope indentation. Biophys. J. 2002;82:2970–2981. doi: 10.1016/S0006-3495(02)75638-5. [DOI] [PMC free article] [PubMed] [Google Scholar]
- Checchi P.M., Nettles J.H., Zhou J., Snyder J.P., Joshi H.C. Microtubule-interacting drugs for cancer treatment. Trends Pharmacol. Sci. 2003;24:361–365. doi: 10.1016/S0165-6147(03)00161-5. [DOI] [PubMed] [Google Scholar]
- Côme C., Arnoux V., Bibeau F., Savagner P. Roles of the transcription factors snail and slug during mammary morphogenesis and breast carcinoma progression. J. Mammary Gland Biol. Neoplasia. 2004;9:183–193. doi: 10.1023/B:JOMG.0000037161.91969.de. [DOI] [PMC free article] [PubMed] [Google Scholar]
- Coulter, W.H. 1953. Means for counting particles suspended in a fluid. Google Patents.
- Dent R., Trudeau M., Pritchard K.I., Hanna W.M., Kahn H.K., Sawka C.A., Lickley L.A., Rawlinson E., Sun P., Narod S.A. Triple-negative breast cancer: clinical features and patterns of recurrence. Clin. Cancer Res. 2007;13:4429–4434. doi: 10.1158/1078-0432.CCR-06-3045. [DOI] [PubMed] [Google Scholar]
- Desprat N., Guiroy A., Asnacios A. Microplates-based rheometer for a single living cell. Rev. Sci. Instrum. 2006;77:055111. [Google Scholar]
- Efremov Y.M., Wang W.-H., Hardy S.D., Geahlen R.L., Raman A. Measuring nanoscale viscoelastic parameters of cells directly from AFM force-displacement curves. Sci. Rep. 2017;7:1541. doi: 10.1038/s41598-017-01784-3. [DOI] [PMC free article] [PubMed] [Google Scholar]
- Fabry B., Maksym G.N., Butler J.P., Glogauer M., Navajas D., Fredberg J.J. Scaling the microrheology of living cells. Phys. Rev. Lett. 2001;87:148102. doi: 10.1103/PhysRevLett.87.148102. [DOI] [PubMed] [Google Scholar]
- Fletcher D.A., Mullins R.D. Cell mechanics and the cytoskeleton. Nature. 2010;463:485–492. doi: 10.1038/nature08908. [DOI] [PMC free article] [PubMed] [Google Scholar]
- Gardel M.L., Kasza K.E., Brangwynne C.P., Liu J., Weitz D.A. Mechanical response of cytoskeletal networks. Methods Cell Biol. 2008;89:487–519. doi: 10.1016/S0091-679X(08)00619-5. [DOI] [PMC free article] [PubMed] [Google Scholar]
- Geltmeier A., Rinner B., Bade D., Meditz K., Witt R., Bicker U., Bludszuweit-Philipp C., Maier P. Characterization of dynamic behaviour of MCF7 and MCF10A cells in ultrasonic field using modal and harmonic analyses. PLoS One. 2015;10:e0134999. doi: 10.1371/journal.pone.0134999. [DOI] [PMC free article] [PubMed] [Google Scholar]
- Gjorevski N., Boghaert E., Nelson C.M. Regulation of epithelial-mesenchymal transition by transmission of mechanical stress through epithelial tissues. Cancer Microenviron. 2012;5:29–38. doi: 10.1007/s12307-011-0076-5. [DOI] [PMC free article] [PubMed] [Google Scholar]
- Goldmann W.H., Auernheimer V., Thievessen I., Fabry B. Vinculin, cell mechanics and tumour cell invasion. Cell Biol. Int. 2013;37:397–405. doi: 10.1002/cbin.10064. [DOI] [PubMed] [Google Scholar]
- Gossett D.R., Henry T., Lee S.A., Ying Y., Lindgren A.G., Yang O.O., Rao J., Clark A.T., di Carlo D. Hydrodynamic stretching of single cells for large population mechanical phenotyping. Proc. Natl. Acad. Sci. U S A. 2012;109:7630–7635. doi: 10.1073/pnas.1200107109. [DOI] [PMC free article] [PubMed] [Google Scholar]
- Gourlay C.W., Ayscough K.R. The actin cytoskeleton: a key regulator of apoptosis and ageing? Nat. Rev. Mol. Cell Biol. 2005;6:583–589. doi: 10.1038/nrm1682. [DOI] [PubMed] [Google Scholar]
- Guck J., Ananthakrishnan R., Mahmood H., Moon T.J., Cunningham C.C., Käs J. The optical stretcher: a novel laser tool to micromanipulate cells. Biophys. J. 2001;81:767–784. doi: 10.1016/S0006-3495(01)75740-2. [DOI] [PMC free article] [PubMed] [Google Scholar]
- Guo M., Ehrlicher A.J., Mahammad S., Fabich H., Jensen M.H., Moore J.R., Fredberg J.J., Goldman R.D., Weitz D.A. The role of vimentin intermediate filaments in cortical and cytoplasmic mechanics. Biophys. J. 2013;105:1562–1568. doi: 10.1016/j.bpj.2013.08.037. [DOI] [PMC free article] [PubMed] [Google Scholar]
- Guo Q., Park S., Ma H. Microfluidic micropipette aspiration for measuring the deformability of single cells. Lab Chip. 2012;12:2687–2695. doi: 10.1039/c2lc40205j. [DOI] [PubMed] [Google Scholar]
- Haase K., Pelling A.E. Investigating cell mechanics with atomic force microscopy. J. R. Soc. Interface. 2015;12:20140970. doi: 10.1098/rsif.2014.0970. [DOI] [PMC free article] [PubMed] [Google Scholar]
- Haider M.A. A radial biphasic model for local cell-matrix mechanics in articular cartilage. SIAM J. Appl. Math. 2004;64:1588–1608. [Google Scholar]
- Hartwell L.H., Kastan M.B. Cell cycle control and cancer. Science. 1994;266:1821–1828. doi: 10.1126/science.7997877. [DOI] [PubMed] [Google Scholar]
- Hu J., Li Y., Hao Y., Zheng T., Parada G.A., Wu H., Lin S., Wang S., Zhao X., Goldman R.D. High stretchability, strength and toughness of living cells enabled by hyperelastic vimentin network. Biorxiv. 2018 doi: 10.1073/pnas.1903890116. [DOI] [PMC free article] [PubMed] [Google Scholar]
- Hu S., Lam R.H. Characterization of viscoelastic properties of normal and cancerous human breast cells using a confining microchannel. Microfluidics Nanofluidics. 2017;21:68. [Google Scholar]
- Hudis C.A., Gianni L. Triple-negative breast cancer: an unmet medical need. Oncologist. 2011;16:1–11. doi: 10.1634/theoncologist.2011-S1-01. [DOI] [PubMed] [Google Scholar]
- Janmey P.A., McCulloch C.A. Cell mechanics: integrating cell responses to mechanical stimuli. Annu. Rev. Biomed. Eng. 2007;9:1–34. doi: 10.1146/annurev.bioeng.9.060906.151927. [DOI] [PubMed] [Google Scholar]
- Kalluri R., Weinberg R.A. The basics of epithelial-mesenchymal transition. J. Clin. Invest. 2009;119:1420–1428. doi: 10.1172/JCI39104. [DOI] [PMC free article] [PubMed] [Google Scholar]
- Karcher H., Lammerding J., Huang H., Lee R.T., Kamm R.D., Kaazempur-Mofrad M.R. A three-dimensional viscoelastic model for cell deformation with experimental verification. Biophys. J. 2003;85:3336–3349. doi: 10.1016/S0006-3495(03)74753-5. [DOI] [PMC free article] [PubMed] [Google Scholar]
- Kastan M.B., Bartek J. Cell-cycle checkpoints and cancer. Nature. 2004;432:316–323. doi: 10.1038/nature03097. [DOI] [PubMed] [Google Scholar]
- Kim J., Han S., Lei A., Miyano M., Bloom J., Srivastava V., Stampfer M.R., Gartner Z.J., Labarge M.A., Sohn L.L. Characterizing cellular mechanical phenotypes with mechano-node-pore sensing. Microsyst. Nanoeng. 2018;4 doi: 10.1038/micronano.2017.91. [DOI] [PMC free article] [PubMed] [Google Scholar]
- Kumar S., Weaver V.M. Mechanics, malignancy, and metastasis: the force journey of a tumor cell. Cancer Metastasis Rev. 2009;28:113–127. doi: 10.1007/s10555-008-9173-4. [DOI] [PMC free article] [PubMed] [Google Scholar]
- Lamouille S., Xu J., Derynck R. Molecular mechanisms of epithelial–mesenchymal transition. Nat. Rev. Mol. Cell Biol. 2014;15:178–196. doi: 10.1038/nrm3758. [DOI] [PMC free article] [PubMed] [Google Scholar]
- Lange J.R., Fabry B. Cell and tissue mechanics in cell migration. Exp. Cell Res. 2013;319:2418–2423. doi: 10.1016/j.yexcr.2013.04.023. [DOI] [PMC free article] [PubMed] [Google Scholar]
- Lee M.-Y., Chou C.-Y., Tang M.-J., Shen M.-R. Epithelial-mesenchymal transition in cervical cancer: correlation with tumor progression, epidermal growth factor receptor overexpression, and snail up-regulation. Clin. Cancer Res. 2008;14:4743–4750. doi: 10.1158/1078-0432.CCR-08-0234. [DOI] [PubMed] [Google Scholar]
- Leterrier J. Water and the cytoskeleton. Cell. Mol. Biol. (Noisy-le-Grand) 2001;47:901–923. [PubMed] [Google Scholar]
- Lim C., Zhou E., Quek S. Mechanical models for living cells—a review. J. Biomech. 2006;39:195–216. doi: 10.1016/j.jbiomech.2004.12.008. [DOI] [PubMed] [Google Scholar]
- Lindberg U., Karlsson R., Lassing I., Schutt C.E., Höglund A.-S. The microfilament system and malignancy. Semin. Cancer Biol. 2008;18:2–11. doi: 10.1016/j.semcancer.2007.10.002. [DOI] [PubMed] [Google Scholar]
- Luu Y.K., Capilla E., Rosen C.J., Gilsanz V., Pessin J.E., Judex S., Rubin C.T. Mechanical stimulation of mesenchymal stem cell proliferation and differentiation promotes osteogenesis while preventing dietary-induced obesity. J. Bone Miner. Res. 2009;24:50–61. doi: 10.1359/JBMR.080817. [DOI] [PMC free article] [PubMed] [Google Scholar]
- Martin S.K., Kamelgarn M., Kyprianou N. Cytoskeleton targeting value in prostate cancer treatment. Am. J. Clin. Exp. Urol. 2014;2:15. [PMC free article] [PubMed] [Google Scholar]
- Masaeli M., Gupta D., O’Byrne S., Henry T., Gossett D.R., Tseng P., Utada A.S., Jung H.-J., Young S., Clark A.T. Multiparameter mechanical and morphometric screening of cells. Sci. Rep. 2016;6:37863. doi: 10.1038/srep37863. [DOI] [PMC free article] [PubMed] [Google Scholar]
- Mendez M., Restle D., Janmey P. Vimentin enhances cell elastic behavior and protects against compressive stress. Biophy. J. 2014;107:314–323. doi: 10.1016/j.bpj.2014.04.050. [DOI] [PMC free article] [PubMed] [Google Scholar]
- Micalizzi D.S., Farabaugh S.M., Ford H.L. Epithelial-mesenchymal transition in cancer: parallels between normal development and tumor progression. J. Mammary Gland Biol. Neoplasia. 2010;15:117–134. doi: 10.1007/s10911-010-9178-9. [DOI] [PMC free article] [PubMed] [Google Scholar]
- Mundel P., Reiser J., Borja A.Z.M.A., Pavenstädt H., Davidson G.R., Kriz W., Zeller R. Rearrangements of the cytoskeleton and cell contacts induce process formation during differentiation of conditionally immortalized mouse podocyte cell lines. Exp. Cell Res. 1997;236:248–258. doi: 10.1006/excr.1997.3739. [DOI] [PubMed] [Google Scholar]
- Nieto M.A., Huang R.Y.-J., Jackson R.A., Thiery J.P. EMT: 2016. Cell. 2016;166:21–45. doi: 10.1016/j.cell.2016.06.028. [DOI] [PubMed] [Google Scholar]
- Otto O., Rosendahl P., Mietke A., Golfier S., Herold C., Klaue D., Girardo S., Pagliara S., Ekpenyong A., Jacobi A. Real-time deformability cytometry: on-the-fly cell mechanical phenotyping. Nat. Methods. 2015;12:199–202. doi: 10.1038/nmeth.3281. [DOI] [PubMed] [Google Scholar]
- Peyton S.R., Ghajar C.M., Khatiwala C.B., Putnam A.J. The emergence of ECM mechanics and cytoskeletal tension as important regulators of cell function. Cell Biochem. Biophys. 2007;47:300–320. doi: 10.1007/s12013-007-0004-y. [DOI] [PubMed] [Google Scholar]
- Prabhune M., Belge G., Dotzauer A., Bullerdiek J., Radmacher M. Comparison of mechanical properties of normal and malignant thyroid cells. Micron. 2012;43:1267–1272. doi: 10.1016/j.micron.2012.03.023. [DOI] [PubMed] [Google Scholar]
- Preira P., Valignat M.-P., Bico J., Théodoly O. Single cell rheometry with a microfluidic constriction: quantitative control of friction and fluid leaks between cell and channel walls. Biomicrofluidics. 2013;7:24111. doi: 10.1063/1.4802272. [DOI] [PMC free article] [PubMed] [Google Scholar]
- Proietti S., Catizone A., Masiello M.G., Dinicola S., Fabrizi G., Minini M., Ricci G., Verna R., Reiter R.J., Cucina A. Increase in motility and invasiveness of MCF 7 cancer cells induced by nicotine is abolished by melatonin through inhibition of ERK phosphorylation. J. Pineal Res. 2018;64:e12467. doi: 10.1111/jpi.12467. [DOI] [PubMed] [Google Scholar]
- Provenzano P.P., Keely P.J. Mechanical signaling through the cytoskeleton regulates cell proliferation by coordinated focal adhesion and Rho GTPase signaling. J. Cell Sci. 2011;124:1195–1205. doi: 10.1242/jcs.067009. [DOI] [PMC free article] [PubMed] [Google Scholar]
- Rother J., Nöding H., Mey I., Janshoff A. Atomic force microscopy-based microrheology reveals significant differences in the viscoelastic response between malign and benign cell lines. Open Biol. 2014;4:140046. doi: 10.1098/rsob.140046. [DOI] [PMC free article] [PubMed] [Google Scholar]
- Rusan N.M., Fagerstrom C.J., Yvon A.-M.C., Wadsworth P. Cell cycle-dependent changes in microtubule dynamics in living cells expressing green fluorescent protein-α tubulin. Mol. Biol. Cell. 2001;12:971–980. doi: 10.1091/mbc.12.4.971. [DOI] [PMC free article] [PubMed] [Google Scholar]
- Saha S., Ji L., de Pablo J.J., Palecek S.P. Inhibition of human embryonic stem cell differentiation by mechanical strain. J. Cell. Physiol. 2006;206:126–137. doi: 10.1002/jcp.20441. [DOI] [PubMed] [Google Scholar]
- Saleh O., Sohn L. Quantitative sensing of nanoscale colloids using a microchip Coulter counter. Rev. Sci. Instrum. 2001;72:4449–4451. [Google Scholar]
- Sato M., Levesque M.J., Nerem R.M. Micropipette aspiration of cultured bovine aortic endothelial cells exposed to shear stress. Arterioscler. Thromb. Vasc. Biol. 1987;7:276–286. doi: 10.1161/01.atv.7.3.276. [DOI] [PubMed] [Google Scholar]
- Sato M., Theret D., Wheeler L., Ohshima N., Nerem R. Application of the micropipette technique to the measurement of cultured porcine aortic endothelial cell viscoelastic properties. J. Biomech. Eng. 1990;112:263–268. doi: 10.1115/1.2891183. [DOI] [PubMed] [Google Scholar]
- Schmid-Schönbein G., Sung K., Tözeren H., Skalak R., Chien S. Passive mechanical properties of human leukocytes. Biophys. J. 1981;36:243–256. doi: 10.1016/S0006-3495(81)84726-1. [DOI] [PMC free article] [PubMed] [Google Scholar]
- Schneider B.P., Winer E.P., Foulkes W.D., Garber J., Perou C.M., Richardson A., Sledge G.W., Carey L.A. Triple-negative breast cancer: risk factors to potential targets. Clin. Cancer Res. 2008;14:8010–8018. doi: 10.1158/1078-0432.CCR-08-1208. [DOI] [PubMed] [Google Scholar]
- Schneider D., Baronsky T., Pietuch A., Rother J., Oelkers M., Fichtner D., Wedlich D., Janshoff A. Tension monitoring during epithelial-to-mesenchymal transition links the switch of phenotype to expression of moesin and cadherins in NMuMG cells. PLoS One. 2013;8:e80068. doi: 10.1371/journal.pone.0080068. [DOI] [PMC free article] [PubMed] [Google Scholar]
- Shapiro E., Biezuner T., Linnarsson S. Single-cell sequencing-based technologies will revolutionize whole-organism science. Nat. Rev. Genet. 2013;14:618. doi: 10.1038/nrg3542. [DOI] [PubMed] [Google Scholar]
- Shih J.-Y., Yang P.-C. The EMT regulator slug and lung carcinogenesis. Carcinogenesis. 2011;32:1299–1304. doi: 10.1093/carcin/bgr110. [DOI] [PubMed] [Google Scholar]
- Sinkus R., Tanter M., Xydeas T., Catheline S., Bercoff J., Fink M. Viscoelastic shear properties of in vivo breast lesions measured by MR elastography. Magn. Reson. Imaging. 2005;23:159–165. doi: 10.1016/j.mri.2004.11.060. [DOI] [PubMed] [Google Scholar]
- Smith J., Tho L.M., Xu N., Gillespie D.A. The ATM–Chk2 and ATR–Chk1 pathways in DNA damage signaling and cancer. Adv. Cancer Res. 2010;108:73–112. doi: 10.1016/B978-0-12-380888-2.00003-0. [DOI] [PubMed] [Google Scholar]
- Stossel T.P., Condeelis J., Cooley L., Hartwig J.H., Noegel A., Schleicher M., Shapiro S.S. Filamins as integrators of cell mechanics and signalling. Nat. Rev. Mol. Cell Biol. 2001;2:138–145. doi: 10.1038/35052082. [DOI] [PubMed] [Google Scholar]
- Streets A.M., Zhang X., Cao C., Pang Y., Wu X., Xiong L., Yang L., Fu Y., Zhao L., Tang F. Microfluidic single-cell whole-transcriptome sequencing. Proc. Natl. Acad. Sci. U S A. 2014;111:7048–7053. doi: 10.1073/pnas.1402030111. [DOI] [PMC free article] [PubMed] [Google Scholar]
- Suresh S. Biomechanics and biophysics of cancer cells. Acta Biomater. 2007;55:3989–4014. doi: 10.1016/j.actbio.2007.04.002. [DOI] [PMC free article] [PubMed] [Google Scholar]
- Thoumine O., Ott A., Cardoso O., Meister J.-J. Microplates: a new tool for manipulation and mechanical perturbation of individual cells. J. Biochem. Biophys. Methods. 1999;39:47–62. doi: 10.1016/s0165-022x(98)00052-9. [DOI] [PubMed] [Google Scholar]
- Tommasi S., Mangia A., Lacalamita R., Bellizzi A., Fedele V., Chiriatti A., Thomssen C., Kendzierski N., Latorre A., Lorusso V. Cytoskeleton and paclitaxel sensitivity in breast cancer: the role of β-tubulins. Int. J. Cancer. 2007;120:2078–2085. doi: 10.1002/ijc.22557. [DOI] [PubMed] [Google Scholar]
- Voulgari A., Pintzas A. Epithelial–mesenchymal transition in cancer metastasis: mechanisms, markers and strategies to overcome drug resistance in the clinic. Biochim. Biophys. Acta. 2009;1796:75–90. doi: 10.1016/j.bbcan.2009.03.002. [DOI] [PubMed] [Google Scholar]
- Vuoriluoto K., Haugen H., Kiviluoto S., Mpindi J., Nevo J., Gjerdrum C., Tiron C., Lorens J., Ivaska J. Vimentin regulates EMT induction by Slug and oncogenic H-Ras and migration by governing Axl expression in breast cancer. Oncogene. 2011;30:1436–1448. doi: 10.1038/onc.2010.509. [DOI] [PubMed] [Google Scholar]
- Wang A., Vijayraghavan K., Solgaard O., Butte M.J. Fast stiffness mapping of cells using high-bandwidth atomic force microscopy. ACS Nano. 2015;10:257–264. doi: 10.1021/acsnano.5b03959. [DOI] [PMC free article] [PubMed] [Google Scholar]
- White A.K., Vaninsberghe M., Petriv I., Hamidi M., Sikorski D., Marra M.A., Piret J., Aparicio S., Hansen C.L. High-throughput microfluidic single-cell RT-qPCR. Proc. Natl. Acad. Sci. U S A. 2011;108:13999–14004. doi: 10.1073/pnas.1019446108. [DOI] [PMC free article] [PubMed] [Google Scholar]
- Woods A., Wang G., Beier F. Regulation of chondrocyte differentiation by the actin cytoskeleton and adhesive interactions. J. Cell. Physiol. 2007;213:1–8. doi: 10.1002/jcp.21110. [DOI] [PubMed] [Google Scholar]
- Yamaguchi H., Condeelis J. Regulation of the actin cytoskeleton in cancer cell migration and invasion. Biochim. Biophys. Acta. 2007;1773:642–652. doi: 10.1016/j.bbamcr.2006.07.001. [DOI] [PMC free article] [PubMed] [Google Scholar]
- Yang J., Weinberg R.A. Epithelial-mesenchymal transition: at the crossroads of development and tumor metastasis. Dev. Cell. 2008;14:818–829. doi: 10.1016/j.devcel.2008.05.009. [DOI] [PubMed] [Google Scholar]
- Yang T., Bragheri F., Minzioni P. A comprehensive review of optical stretcher for cell mechanical characterization at single-cell level. Micromachines (Basel) 2016;7 doi: 10.3390/mi7050090. [DOI] [PMC free article] [PubMed] [Google Scholar]
- Yeung A., Evans E. Cortical shell-liquid core model for passive flow of liquid-like spherical cells into micropipets. Biophys. J. 1989;56:139–149. doi: 10.1016/S0006-3495(89)82659-1. [DOI] [PMC free article] [PubMed] [Google Scholar]
- Zeisberg M., Neilson E.G. Biomarkers for epithelial-mesenchymal transitions. J. Clin. Invest. 2009;119:1429–1437. doi: 10.1172/JCI36183. [DOI] [PMC free article] [PubMed] [Google Scholar]
- Zhang J., Tian X.-J., Zhang H., Teng Y., Li R., Bai F., Elankumaran S., Xing J. TGF-β–induced epithelial-to-mesenchymal transition proceeds through stepwise activation of multiple feedback loops. Sci. Signal. 2014;7:ra91. doi: 10.1126/scisignal.2005304. [DOI] [PubMed] [Google Scholar]
Associated Data
This section collects any data citations, data availability statements, or supplementary materials included in this article.
Supplementary Materials
MCF-10A cells enter the contraction channel whose periodic length, Lp, is 1,000 μm. A non-pulsatile pressure (13.8 kPa) at the channel inlet causes the cells to flow through the pore at a velocity, vpore, of 16 mm/s. Video was recorded with 1,000 fps and played at 5 fps (i.e., 200× slower than real time)