Abstract
Prostate cancer is one of the most common types of cancer among Canadian men. Next-generation sequencing using RNA-Seq provides large amounts of data that may reveal novel and informative biomarkers. We introduce a method that uses machine learning techniques to identify transcripts that correlate with prostate cancer development and progression. We have isolated transcripts that have the potential to serve as prognostic indicators and may have tremendous value in guiding treatment decisions. Analysis of normal versus malignant prostate cancer data sets indicates differential expression of the genes HEATR5B, DDC, and GABPB1-AS1 as potential prostate cancer biomarkers. Our study also supports PTGFR, NREP, SCARNA22, DOCK9, FLVCR2, IK2F3, USP13, and CLASP1 as potential biomarkers to predict prostate cancer progression, especially between stage II and subsequent stages of the disease.
Keywords: prostate cancer progression, transcriptomics signature, machine learning, RNA-Seq analysis
Introduction
Prostate cancer is one of the most common types of cancer among men worldwide. It is estimated that more than 1 in 1.2 million men were diagnosed with prostate cancer in 2015, resulting in more than 335 000 deaths.1 A current obstacle in improving patient care is the inability to accurately predict tumors that are at a high risk for progression. Identifying reliable prognostic biomarkers to guide treatment decisions is a high priority in the prostate cancer field.
Next-generation sequencing (NGS) has revolutionized genomic and transcriptomic analysis. RNA-Seq reads the transcriptome at a single-nucleotide resolution, revealing unexplored genomic and transcriptomic territories not revealed using conventional technologies, such as microarray,2,3 RNA-Seq represents a high-throughput technique capable of identifying nonconventional biomarkers, such as noncoding RNA and alternative splicing events.2,3 Alternative splicing can produce protein isoforms with potentially different functions from the same DNA sequence. Indeed, approximately half of all active splicing events are altered in ovarian and breast tumors.4 RNA-Seq can also measure transcriptomic activity and transcriptome assembly to provide a better understanding of the regulation of corresponding protein isoforms.5-8 A typical RNA-Seq experiment, however, produces a large amount of data, and therefore, demands considerable computational resources in both time and space. Using machine learning to analyze RNA-Seq data can reduce redundant and irrelevant information while providing a selection of potentially significant biomarkers for biological validation. Optimizing a computational approach to effectively isolate novel splice variants from RNA-Seq data may provide invaluable clues about novel biomarkers for detecting and predicting the progression of prostate cancer.
Several studies have used RNA-Seq to identify new potential biomarkers for prostate cancer. Feng et al9 presented a comprehensive review of the most recent studies on alternative splicing in cancer using RNA-Seq data. This included an overview of several publicly available RNA-Seq data sets and the most recent open-source bioinformatics tools for RNA-Seq data analysis. Recent studies using RNA-Seq for prostate cancer analysis include genome-wide association and variation studies, noncoding RNAs (eg, microRNA, lincRNA, and siRNA), somatic mutations, chimeric RNA, and gene fusion. Kannan et al10 used RNA-Seq on 20 human prostate cancer and 10 matched benign prostate tissues from patients who had received no preoperative therapy prior to radical prostatectomy and identified a potential link between increased chimeric RNA events and prostate cancer.
Pflueger et al11 used RNA-Seq data from 25 human prostate cancer samples and isolated 7 novel gene fusions related to prostate cancer, including TMPRSS2-ERG. TMPRSS2-ERG gene fusion is present in 50% to 90% of human prostate cancers and has been identified as an early molecular event associated with invasion of the disease.12 Ren et al13 also identified recurrent gene fusions in 14 primary prostate tumors from a Chinese population. Although they found TRMPRSS2-ERG fusion to occur at a very low frequency, they isolated additional novel gene fusions, CTAGE5-KHDRBS3 and USP9Y-TTTY15, that frequently occurred in the Chinese cohort. These conflicting reports illustrate that disparity exists among prostate cancer patients of different ethnic backgrounds.
In another study, Xu et al14 identified 92 new genes with somatic mutations in human prostate cancer. Their study used RNA-Seq data from 5 cancer patients to detect variants of chromosomal rearrangements, insertions, and deletions. Of significance, they identified a frame-shift mutation in the coding region of TNFSF10 that disrupts its ability to induce apoptosis, a change that may promote tumor progression. Prensner et al15 focused on new noncoding RNA and found an unannotated lincRNA, PCAT-1, a prostate-specific regulator of cell proliferation.
Exploiting the high-resolution features of RNA-Seq that allow for reconstructing the transcriptome, inferring protein isoforms, and their corresponding protein function can offer an integrative approach to better understand the onset and progression of the disease. Thus, in this study, we extended our earlier study16 for detecting differential expressed transcripts in prostate cancer using RNA-Seq data. This model identifies transcripts associated with malignant tumors as compared with corresponding matched normal samples and transcripts that are differentially expressed during disease progression through different TNM stages. Our analysis revealed several transcripts that may be used as potential biomarkers for predicting prostate cancer and disease progression.
Methods
Data preprocessing
Figure 1 depicts the pipeline of our proposed model. Initially, samples are pre-processed individually by filtering the mRNA reads of each sample17 and mapping them to the Human Genome (hg19) using Tophat2,18 2 fast methods for mapping splice junctions and aligning short reads, respectively. In the next step, we use Cufflinks6 for assembling the transcriptome using the mapped reads from the previous step based on RefSeq annotation.19 For all samples, we used Cufflinks to estimate the relative abundances of the transcripts in fragments per kilobase of exon per million of mapped reads (FPKM) values. We run Tophat2 and Cufflinks using the default values.
Figure 1.
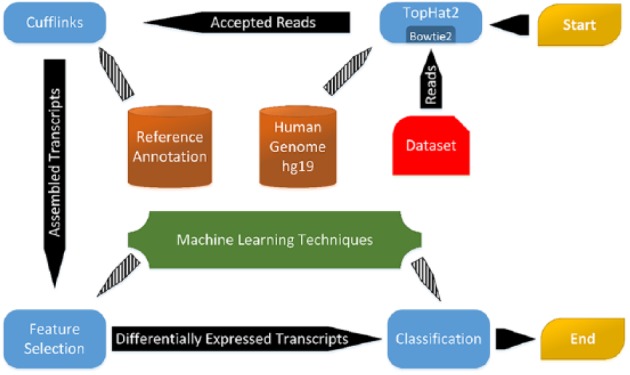
A Schematic view of the proposed workflow for finding differential transcripts between benign versus malignant tumours and across various stages of prostate cancer.
Obtaining discriminative transcripts
The deliverables of our study are 2-fold. First, we aim to identify a gene signature that predicts prostate cancer by comparing cancer versus their matched normal counterparts. Second, we focus on the differential expression of gene transcripts in a pairwise analysis of various stages of prostate cancer progression; these transcripts are considered as discriminative transcripts for a specific stage. Using the latter, we anticipate that this type of analysis will reveal discriminative transcripts that are potential biomarkers for prediction of disease progression. The literature confirms that those discriminative transcripts are strongly related to cancer progression; however, a deeper investigation with wet-lab experiments are required to confirm them as predictive or biomarker transcripts. The products of these biomarkers may then be identified using routine blood or urine tests to predict progression.
Normal versus malignant
We consider the identification of differentially expressed transcripts in normal versus malignant prostate cells as a 2-class classification problem, where each transcript is used as a feature along with FPKM as feature value. After obtaining the transcripts using Cufflinks, we used minimum Redundancy Maximum Relevance (mRMR).20 mRMR tries to select a subset of features that maximize the relevance, which means to increase the correlation within a class and minimize the correlation between themselves (redundancy). The method incorporates the standard classifier and forward-selection the features that improve the classification measurements.
After feature selection, we used several standard classifiers to find the best accuracy for classifying the consecutive stages/sub-stages. The selected transcripts from the previous step were used to optimize the classification performance; it is also easier to validate a smaller subset of genes. The classifiers used for comparison include support vector machine (SVM)21 with the radial basis function (RBF), linear and polynomial kernels, random forest,22 decision tree,23 and naïve Bayes.24
Prostate cancer progression
We modeled the machine learning problem as binary class problems; for each 2 consecutive stages/sub-stages, we created a binary class problems. We considered the stages/sub-stages from Table 2 as the classes, so we selected T1c versus T2, T2 versus T2a, and so on to create the binary class problems. For each binary class problem, the reconstructed transcripts are the features and the quantified FPKM values for each sample’s transcript are the values of the features, and the labels are the stages/sub-stages of the samples from that pair of binary consecutive classes. To avoid overfitting, we merged all T3 and its sub-stage (T3a, T3b) samples with T4 samples, and then labeled the merged class samples with T3/T4 class label. The discriminative transcripts serve as differentially expressed transcripts because they are able to identify class from another.
Table 2.
Distribution of Long’s data set17 samples in various stages of prostate cancer.
| Prostate stages | Description | No. of patients |
|---|---|---|
| T1c | The tumor can be a needle biopsy due to the elevated PSA level. But still cannot be detected during imaging test. | 14 |
| T2 | The tumor is found only in the prostate. | 10 |
| T2a | The tumor exists in less than a half (or half at most) in only one of prostate glands. | 23 |
| T2b | The tumor exists in more than a half in only one of prostate glands. | 11 |
| T2c | The tumor exists in both sides of the prostate. | 30 |
| T3 | The tumor has grown through prostate tissue into the outside. | 2 |
| T3a | The tumor has grown through the prostate either on 1 or both sides of the prostate. | 6 |
| T3b | The tumor has spread into the seminal vesicles | 8 |
| T4 | The tumor has spread to other organs. | 1 |
Abbreviation: PSA, prostate-specific antigen.
We started the feature selection process on 43 497 reconstructed transcripts, and then the numbers were narrowed down at each binary classification problem to a few discriminative transcripts; we used Weka24 data mining tool to run mRMR on the features. We first normalized the features and then used mRMR on SVM with linear kernel as a classifier inside the wrapper method. The reason behind choosing the linear kernel is because of the heavy cost of applying forward-selection in the wrapper method using polynomial or RBF kernels.
Data Availability
We used 3 data sets, Kim’s,25 Ren’s,13 and Kannan’s,10 each containing matched normal versus malignant prostate cancer tumor samples. Ren’s data set used random hexamer primers, whereas the others’ data sets used oligo (DT) primers. All these data sets are in sequence read archive (SRA) file format and are publicly available from the National Center for Biotechnology Information (NCBI) repository. Table 1 shows the number of samples in each data set.
Table 1.
Data sets used in this study for malignant versus normal analysis with the number of samples in each data set.
In addition, we used the data set from Long et al26 which contains prostate cancer progression stages using 104 samples from 100 patients. Table 2 shows the distribution of samples across various stages of prostate cancer in this data set.
Results
Using the proposed model, we conducted 2 different experiments: first, on malignant tumors versus their matched normal counterparts, and second, on samples from various stages of prostate cancer progression.
Malignant versus matched normal comparison
We tested and validated our proposed wrapper-based feature-selection method on 3 different data sets (Kannan’s, Kim’s, and Ren’). Table 3 and Figure 2 show the differentially expressed transcripts (i.e., malignant versus normal) identified in each data set. Two of the identified transcripts (NM_019024 and NM_001242889; corresponding to genes HEATR5B and DDC, respectively) were common between Kannan’s and Kim’s data sets, whereas one identified transcript (NR_024490; corresponding to the gene GABPB1-A51) was common between both Kim’s and Ren’s data sets.
Table 3.
Differentially expressed transcripts identified in Kannan’s, Kim’s, and Ren’s data sets.
| Data set | Transcript ID | Gene name | Gene description |
|---|---|---|---|
| Kannan et al10 | NM_019024 | HEATR5B | HEAT repeat containing 5B |
| NM_001242889 | DDC | Dopa decarboxylase, transcript variant 6 | |
| NM_152228 | TAS1R3 | Taste 1 receptor member 3 | |
| NM_001204401 | XIAP | X-linked inhibitor of apoptosis, transcript variant 2 | |
| Kim et al18 | NR_024490 | GABPB1-AS1 | GABPB1 antisense RNA 1 |
| NM_001242889 | DDC | Dopa decarboxylase, transcript variant 6 | |
| NM_019024 | HEATR5B | HEAT repeat containing 5B | |
| NM_032415 | CARD11 | Caspase recruitment domain family member 11, transcript variant 2 | |
| Ren et al13 | NR_024490 | GABPB1-AS1 | GABPB1 antisense RNA 1 |
| NM_000424 | KRT5 | Keratin 5 | |
| NM_001128826 | NCS1 | Neuronal calcium sensor 1, transcript variant 2 | |
| NM_000494 | COL17A1 | Collagen type XVII alpha 1 chain | |
| NM_000700 | ANXA1 | Annexin A1 | |
| NM_005567 | LGALS3BP | Galectin 3 binding protein |
Transcripts that start with prefix NM are mRNAs, whereas the ones that start with NR are lncRNAs.
Figure 2.
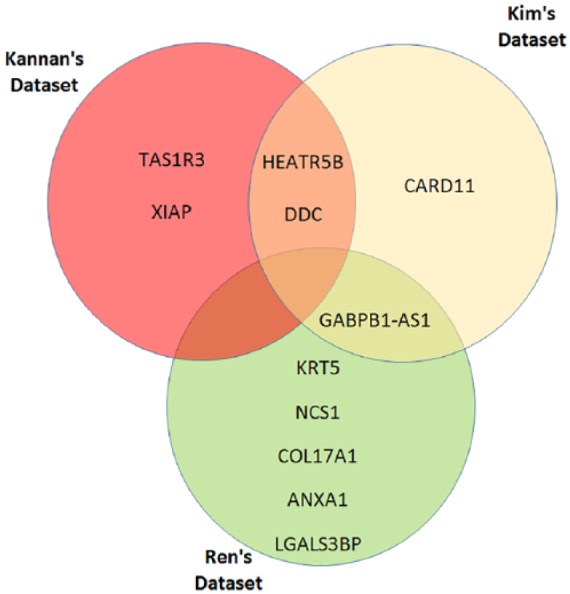
Genes corresponding to the differentially expressed transcripts identified in Kannan’s, Kim’s, and Ren’s data sets.
Figure 3 shows the average of transcript abundance for malignant versus matched normal samples. The bars represent mean FPKM values for the 3 common transcripts selected. The averages of FPKM values were calculated for both malignant and matched normal samples in the 3 data sets in such a way that the result of each data set is comparable on an uneven field. Transcript NM_001242889 (DDC) was found to be differentially expressed in malignant samples compared with matched normal samples. DDC has previously been shown to be over-expressed in cancer samples compared with their matched normal samples.27 Similar patterns were observed in our results, which suggest that DDC gene is a relevant biomarker for prostate cancer.
Figure 3.
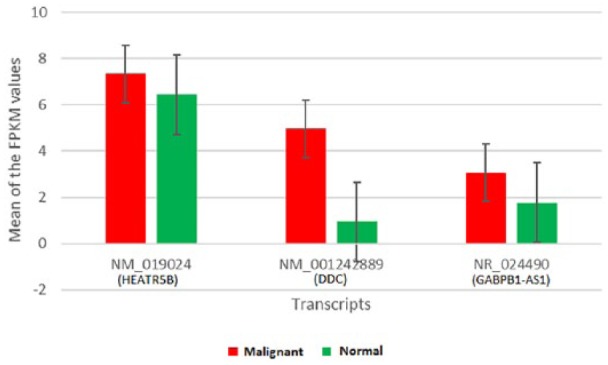
Expression of transcripts in malignant versus matched normal samples.
Figure 4 shows the performance of 5 different classifiers on discriminating malignant samples from their matched normal counterparts in the 3 data sets. The classifiers were trained with default parameters and validated via the 10-fold cross-validation approach. We used accuracy (ACC) and area under receiver operating characteristic curve (AUC) to evaluate the performance of the classifiers, which show that the SVM classifier with a linear kernel outperformed all other classifiers for the 3 data sets. These classification results show that using a handful of transcripts—less than 10 for each data set—malignant tumors can be easily identified with almost perfect accuracy, in most cases. This has an important implication in clinical contexts, by virtue of the fact that effective and simple tools for diagnosis and prognosis of the disease can be developed.
Figure 4.
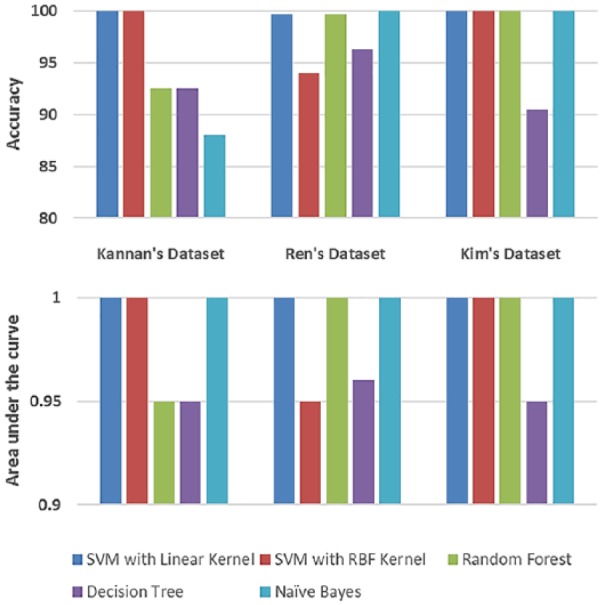
Performance of 5 different classifiers for matched normal versus malignant classification.
Prostate cancer progression
We applied the proposed method to compare different stages of prostate cancer using the data set from Long et al26 for this comparison. Our method identified 44 transcripts expressed differentially between pairs of stages (e.g., T1, T2, T3, and T4) or sub-stages of prostate cancer progression (e.g., T2a, T2b, and T2c), collectively. Each pair of consecutive stages, namely, T1c-T2, T2-T2a, T2a-T2b, T2b-T2c, T2c-T3a, T3a-T3b, and T2c-T3/T4 was fed to a classifier, modeled as a 2-class dichotomizer that distinguishes stage A versus stage B, for an A–B pair. Then, mRMR as a wrapper-based feature selection approach was applied to the data set. SVM was used as a classifier with default parameters to obtain the best set of features, where the performance measure is accuracy.
As a result of applying the feature selection and classification algorithms, each pair of consecutive stages led to 6, 7, 6, 5, 5, 3, and 12 differentially expressed transcripts, respectively. Tables 4 to 10 provide a list and the corresponding description of the top discriminative transcripts between different pairs of stages/sub-stages of prostate cancer progression. As shown in the tables, the largest number of discriminative transcripts was found between the T2c-T3/T4 pairwise stages.
Table 4.
The list of the transcripts that differentiate stage T1C from T2.
| Transcript | Chr. | Gene | Gene description |
|---|---|---|---|
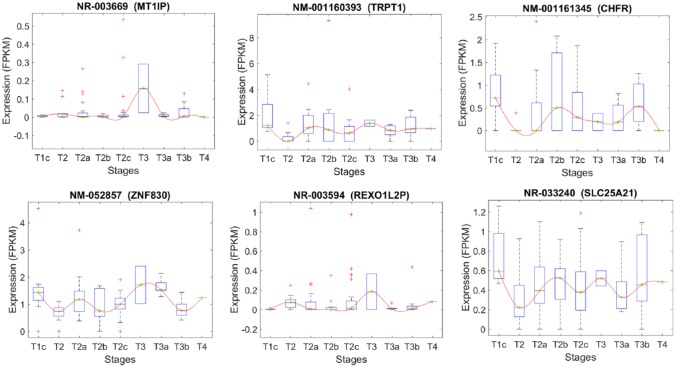
| NR_003669 | 16 | MT1IP | Metallothionein 1I, pseudogene (MT1IP), transcript variant 1 |
| NM_001160393 | 11 | TRPT1 | tRNA phosphotransferase 1 (TRPT1), transcript variant 6 |
| NM_001161345 | 12 | CHFR | Checkpoint with forkhead and ring finger domains, E3 ubiquitin protein ligase (CHFR), transcript variant 2 |
| NM_052857 | 17 | ZNF830 | Zinc finger protein 830 |
| NR_003594 | 8 | REXO1L2P | RNA exonuclease one homolog (S. cerevisiae)-like 2 |
| NR_033240 | 14 | SLC25A21 | SLC25A21 antisense RNA 1 |
Table 10.
The list of the transcripts that differentiate stage T2C from T3/T4.
| Transcript | Chr. | Description | Gene |
|---|---|---|---|
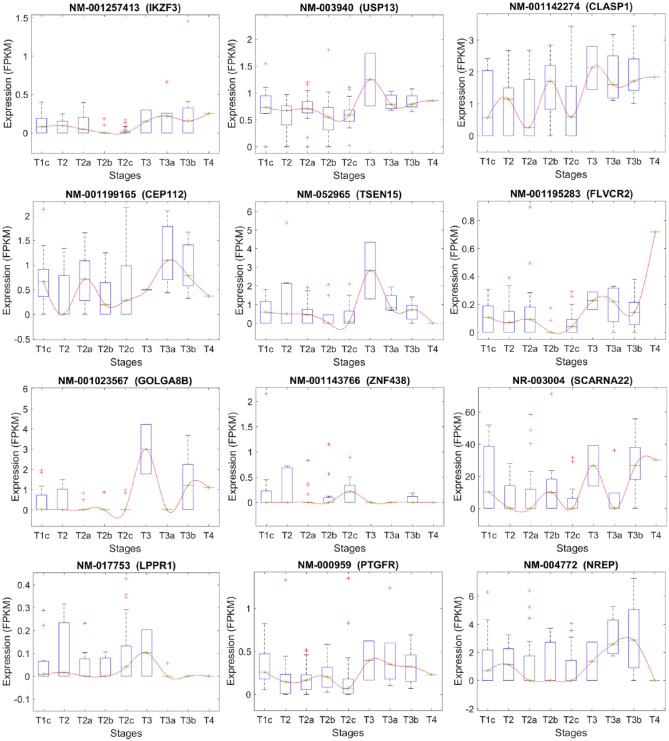
| NM_001257413 | 17 | IKAROS family zinc finger 3 (Aiolos), transcript variant 12 | IKZF3 |
| NM_003940 | 3 | Ubiquitin-specific peptidase 13 (isopeptidase T-3) | USP13 |
| NM_001142274 | 2 | Cytoplasmic linker associated protein 1, transcript variant 3 | CLASP1 |
| NM_001199165 | 17 | Centrosomal protein 112kDa, transcript variant 3 | CEP112 |
| NM_052965 | 1 | tRNA splicing endonuclease subunit, transcript variant 1 | TSEN15 |
| NM_001195283 | 14 | Feline leukemia virus subgroup C cellular receptor family, member 2, transcript variant 2 | FLVCR2 |
| NM_001023567 | 15 | Golgin A8 family, member B, transcript variant 1 | GOLGA8B |
| NM_001143766 | 10 | Zinc finger protein 438, transcript variant 1 | ZNF438 |
| NR_003004 | 4 | Small Cajal body-specific RNA 22 | SCARNA22 |
| NM_017753 | 9 | Lipid phosphate phosphatase-related protein type 1, transcript variant 2 | LPPR1 |
| NM_000959 | 1 | Prostaglandin F receptor (FP), transcript variant 1 | PTGFR |
| NM_004772 | 5 | Neuronal regeneration related protein, transcript variant 1 | NREP |
Table 5.
The list of the transcripts that differentiate stage T2 from T2A.
| Transcript | Chr. | Gene | Gene description |
|---|---|---|---|
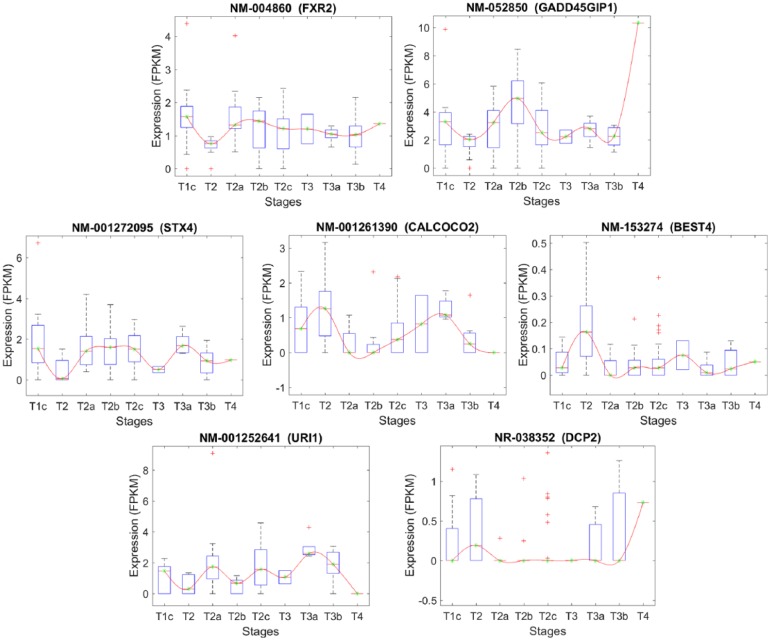
| NM_004860 | 17 | FXR2 | Fragile X mental retardation, autosomal homolog 2 |
| NM_052850 | 19 | GADD45GIP1 | Growth arrest and DNA-damage-inducible, gamma interacting protein 1 |
| NM_001272095 | 16 | STX4 | Syntaxin 4, transcript variant 1 |
| NM_001261390 | 17 | CALCOCO2 | Calcium binding and coiled-coil domain 2, transcript variant 1 |
| NM_153274 | 1 | BEST4 | Bestrophin 4 |
| NM_001252641 | 19 | URI1 | Prefoldin-like chaperone, transcript variant 3 |
| NR_038352 | 5 | DCP2 | Decapping mRNA 2, transcript variant 3 |
Table 6.
The list of the transcripts that differentiate stage T2A from T2B.
| Transcript | Chr. | Gene | Gene description |
|---|---|---|---|
| NM_032023 | 10 | RASSF4 | Ras association (RalGDS/AF-6) domain family member 4 |
| NM_080792 | 20 | SIRPA | Signal-regulatory protein alpha (SIRPA), transcript variant 3 |
| NM_000095 | 19 | COMP | Cartilage oligomeric matrix protein |
| NM_003102 | 4 | SOD3 | Superoxide dismutase 3, extracellular |
| NM_080797 | 20 | DIDO1 | Death inducer-obliterator 1, transcript variant 3 |
| NM_002725 | 1 | PRELP | Proline/arginine-rich end leucine-rich repeat protein, transcript variant 1 |
Table 7.
The list of the transcripts that differentiate stage T2B from T2C.
| Transcript | Chr. | Gene | Gene description |
|---|---|---|---|
| NM_001711 | X | BGN | Homo sapiens biglycan |
| NM_032023 | 10 | RASSF4 | Ras association (RalGDS/AF-6) domain family member 4 |
| NM_001014443 | 1 | USP21 | Ubiquitin-specific peptidase 21, transcript variant 3 |
| NM_021724 | 17 | NR1D1 | Nuclear receptor subfamily 1 group D, member 1 |
| NM_012098 | 9 | ANGPTL2 | Angiopoietin-like 2 |
Table 8.
The list of the transcripts that differentiate stage T2C from T3A.
| Transcript | Chr. | Description | Gene |
|---|---|---|---|
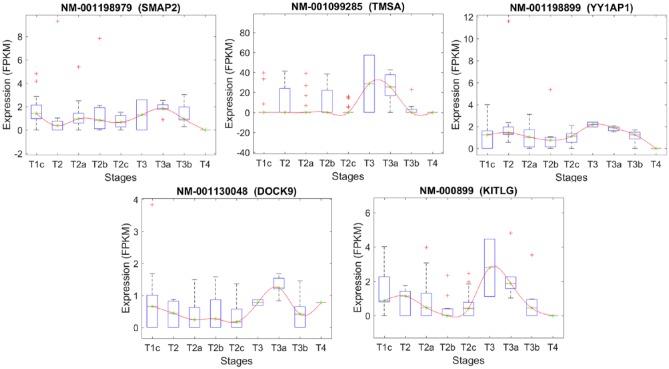
| NM_001198979 | 1 | Small ArfGAP2 (SMAP2), transcript variant 2 | SMAP2 |
| NM_001099285 | 2 | Prothymosin, alpha (PTMA), transcript variant 1 | TMSA |
| NM_001198899 | 1 | YY1 associated protein 1 (YY1AP1), transcript variant 6 | YY1AP1 |
| NM_001130048 | 13 | Dedicator of cytokinesis 9 (DOCK9), transcript variant 2 | DOCK9 |
| NM_000899 | 12 | KIT ligand (KITLG), transcript variant b | KITLG |
Table 9.
The list of the transcripts that differentiate stage T3A from T3B.
The results of applying mRMR feature selection method to identify the most differentially expressed transcripts between pairs of consecutive classes were compared with the results obtained after applying CuffDiff,6 a tool that uses statistical methods to identify differentially expressed transcripts. The reason for selecting CuffDiff rather than the other state-of-art differential expression analysis tools is that it outperforms the other tools when it comes to isoforms analysis despite reports that it is less accurate and performs slower than other tools.28 In each pair of consecutive stages, the proposed model identified fewer selected transcripts as compared with the CuffDiff model (Table 11). We evaluated the performance of the 2 models above using different performance measures that include ACC, F-measure (FM), Matthews correlation coefficient (MCC), and AUC. For classification, we used the cost-sensitive meta-classifier model along with random forest classifier (100 trees) with the same settings for both models. In each case, we obtained a much higher performance using transcripts selected from our feature-selection method as compared to CuffDiff. Importantly, we observed no overlap between transcripts detected by the 2 models, stressing the importance of the new method for isolating hits as biomarkers for progression of prostate cancer.
Table 11.
Comparison between CuffDiff and our feature-selection method for identifying differentially expressed transcripts between each pair of consecutive stages of prostate cancer.
| Stage | Method | No. of selected transcripts | No. of common transcripts | ACC | FM | MCC | AUC |
|---|---|---|---|---|---|---|---|
| T1C-T2 (14 versus 10) | CuffDiff | 21 | 0 | 70.8% | 0.710 | 0.410 | 0.846 |
| Proposed method | 6 | 95.8% | 0.958 | 0.917 | 0.971 | ||
| T2-T2A (10 versus 23) | CuffDiff | 43 | 0 | 69.7% | 0.650 | 0.159 | 0.580 |
| Proposed method | 7 | 93.9% | 0.939 | 0.857 | 0.970 | ||
| T2A-T2B (23 versus 11) | CuffDiff | 35 | 0 | 64.7% | 0.601 | 0.068 | 0.634 |
| Proposed method | 6 | 85.3% | 0.851 | 0.657 | 0.826 | ||
| T2B-T2C (11 versus 30) | CuffDiff | 38 | 0 | 65.8% | 0.647 | 0.078 | 0.645 |
| Proposed method | 5 | 87.8% | 0.880 | 0.699 | 0.885 | ||
| T2C-T3A (30 versus 8) | CuffDiff | 29 | 0 | 73.7% | 0.722 | 0.130 | 0.612 |
| Proposed method | 5 | 89.4% | 0.895 | 0.683 | 0.948 | ||
| T3A-T3B (8 versus 9) | CuffDiff | 27 | 0 | 58.8% | 0.588 | 0.181 | 0.750 |
| Proposed method | 3 | 94.1% | 0.941 | 0.887 | 1.000 | ||
| T2C-T3/T4 (30 versus 17) | CuffDiff | 49 | 0 | 57.4% | 0.568 | 0.055 | 0.483 |
| Proposed method | 12 | 95.7% | 0.957 | 0.908 | 0.988 |
Abbreviations: ACC, accuracy; FM, F-measure; MCC, Matthews correlation coefficient; AUC, area under receiver operating characteristic curve.
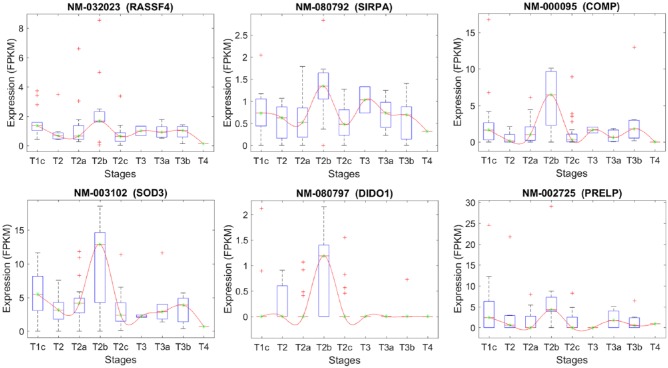
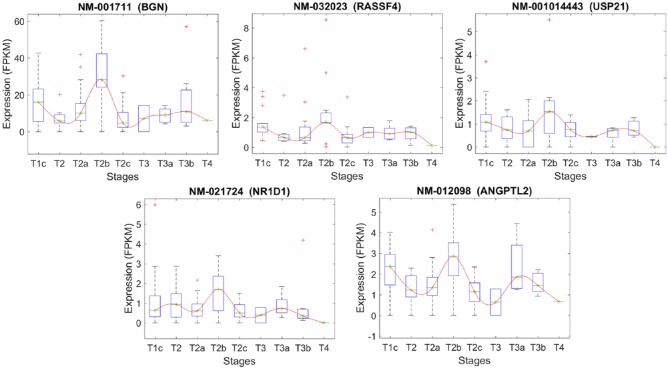
Figures 5 to 11 depict transcripts listed in Tables 4 to 10, respectively, across different stages of prostate cancer. The x-axis shows the stages of prostate cancer, whereas the y-axis shows the median of FPKM values of samples in each stage. Of particular interest are transcripts that are significantly altered at the critical transition from stage T2 to T3/T4 (Figures 9 and 11). DOCK9 (Figure 9) and FLVCR2 IK2F3, USP13, PTGFR, CLASP1 (Figure 11) are all transcripts that significantly increase at the T2 transition and remain elevated in advanced prostate cancer stages. These may represent novel biomarkers—either individually or combined as a signature. They may also represent novel targets for therapeutic intervention.
Figure 5.
Stage-specific expression level of transcripts that have been selected based on their significant expression changes between stages T1c and T2.
Figure 11.
Stage-specific expression level of transcripts that have been selected based on their significant expression changes between stages T2c and T3/T4.
Figure 9.
Stage-specific expression level of transcripts that have been selected based on their significant expression changes between stages T2c and T3a.
Figure 6.
Stage-specific expression level of transcripts that have been selected based on their significant expression changes between stages T2 and T2a.
Figure 7.
Stage-specific expression level of transcripts that have been selected based on their significant expression changes between stages T2a and T2b.
Figure 8.
Stage-specific expression level of transcripts that have been selected based on their significant expression changes between stages T2b and T2c.
Figure 10.
Stage-specific expression level of transcripts that have been selected based on their significant expression changes between stages T3a and T3b.
Discussion
Identifying novel biomarkers to clearly distinguish between low and high-risk prostate cancer progression is a significant step toward directing treatment strategies that are efficacious yet minimally invasive. Using the power of NGS and machine learning techniques, we found several transcripts that have the potential to serve as prognostic indicators in guiding treatment decisions. These transcripts constitute a genomic and transcriptomic signature of prostate cancer and its progression, which has never been characterized before. Further studies using wet-lab experiments and clinical assays will be essential to confirm the presence of these biomarkers in particular biological processes involved in the disease and its progression.
Some of our isolated genes have previously been linked to other forms of cancer. For example, NREP (P311) is a transcript upregulated in stages T3 to T4 as compared with T2c. Although there are no published reports on the role of NREP on prostate cancer, it has been shown to be involved in glioma motility and invasion via the reorganization of the actin cytoskeleton at the periphery of these cells.29 Upregulation of NREP expression from stages T3 to T4 is consistent with the invasion of prostate cancer cells extending beyond the prostatic capsule during this stage. Our results also revealed upregulation of the gene expression of the small Cajal body-specific RNA (SCARNA22) from stages T2c to T3/T4. SCARNA22 is a noncoding RNA involved in the maturation of other RNA molecules, and along with other small nucleolar RNA, it has been linked to human cancers.30 Typically located in the introns of host genes, upregulation of SCARNA22 was found in multiple myeloma harboring chromosomal translocations and may suppress oxidative stress, facilitate cell proliferation, and protect cells from the effects of chemotherapy.31 Our study is the first to link SCARNA22 with prostate cancer and progression of the disease.
In particular, we have isolated a set of transcripts that are significantly altered at the critical transition between stages T2 and T3/4 and remain elevated. These are transcripts from the genes DOCK9, FLVCR2, IK2F3, USP13, PTGFR, and CLASP1. In the human protein atlas, Dock9, Clasp1, and USP13 protein levels are highly expressed in prostate cancer tissues. Dock9 is a Rho GEF responsible for activating Rho-GTPases and known to be implicated in tumorigenesis,32,33 Although the protein atlas has not detected PTGFR as highly stained in prostate cancer, gene expression of PTGFR is associated with cell proliferation and in vivo progression to castration-recurrent prostate cancer, an end stage of the disease.34 PTGFR is a membrane receptor for the prostaglandin F2alpha and a potent luteolytic agent. It has previously been shown to be highly expressed in endometrial adenocarcinomas.35 In ovarian cancer, overexpression of PTGFR stimulates the spontaneous development and secretion of autoantibodies against the protein, as detected in the serum samples of patients with cancer.36 Autoantibodies against PTGFR may serve as biomarkers for early serological detection of the disease. Overexpression of PTGFR has also been reported in human tumor-endothelial cells of renal cell carcinoma where it is believed to be involved in tumor angiogenesis.37 Whether these transcripts or their protein products can be used alone or in combination as a prognostic indicator for prostate cancer is an important next step of this work. It is also interesting to consider that these protein products may represent novel drug targets for advanced disease.
Footnotes
Declaration of conflicting interests:The author(s) declared no potential conflicts of interest with respect to the research, authorship, and/or publication of this article.
Funding:The author(s) disclosed receipt of the following financial support for the research, authorship, and/or publication of this article: The research on data analysis has partially been funded by the Natural Sciences and Engineering Research Council of Canada, grant RGPIN/05084-2014 and 290550, a Seeds4Hope grant from the Windsor-Essex County Cancer Center Foundation, and the University of Windsor.
Author Contributions: AA has contributed in the discussions, pre-processing, and machine learning methods. IR and SR have contributed in the discussions, machine learning and writing the manuscript, whereas LR is the one who suggested the idea with the implementation design and also contributed in the discussions and writing. DC and LP have contributed in the discussion, writing, and the biological validation of the found biomarkers. AA, IR, SS, and LR contributed equally to this work.
ORCID iD: Abedalrhman Alkhateeb  https://orcid.org/0000-0002-1751-7570
References
- 1. GLOBOCAN. http://globocan.iarc.fr/. Up-dated 2012. Accessed March 10, 2017.
- 2. Garber M, Grabherr MG, Guttman M, Trapnell C. Computational methods for transcriptome annotation and quantification using RNA-seq. Nat Methods. 2011;8:469–477. [DOI] [PubMed] [Google Scholar]
- 3. Wang Z, Gerstein M, Snyder M. RNA-Seq: a revolutionary tool for transcriptomics. Nat Rev Genet. 2009;10:57–63. [DOI] [PMC free article] [PubMed] [Google Scholar]
- 4. Venables JP, Klinck R, Koh C, et al. Cancer-associated regulation of alternative splicing. Nat Struct Mol Biol. 2009;16:670–676. [DOI] [PubMed] [Google Scholar]
- 5. Steijger T, Abril JF, Engström PG, et al. Assessment of transcript reconstruction methods for RNA-seq. Nat Method. 2013;10:1177–1184. [DOI] [PMC free article] [PubMed] [Google Scholar]
- 6. Trapnell C, Williams BA, Pertea G, et al. Transcript assembly and quantification by RNA-Seq reveals unannotated transcripts and isoform switching during cell differentiation. Nat Biotechnol. 2010;28:511–515. [DOI] [PMC free article] [PubMed] [Google Scholar]
- 7. Mezlini AM, Smith EJ, Fiume M, et al. iReckon: simultaneous isoform discovery and abundance estimation from RNA-seq data. Genome Res. 2013;23:519–529. [DOI] [PMC free article] [PubMed] [Google Scholar]
- 8. Engstrom PG, Steijger T, Sipos B, et al. Systematic evaluation of spliced alignment programs for RNA-seq data. Nat Methods. 2013;10:1185–1191. [DOI] [PMC free article] [PubMed] [Google Scholar]
- 9. Feng H, Qin Z, Zhang X. Opportunities and methods for studying alternative splicing in cancer with RNA-Seq. Cancer Lett. 2013;340:179–191. [DOI] [PubMed] [Google Scholar]
- 10. Kannan K, Wang L, Wang J, Ittmann MM, Li W, Yen L. Recurrent chimeric RNAs enriched in human prostate cancer identified by deep sequencing. Proc Natl Acad Sci U S A. 2011;108:9172–9177. [DOI] [PMC free article] [PubMed] [Google Scholar]
- 11. Pflueger D, Terry S, Sboner A, et al. Discovery of non-ETS gene fusions in human prostate cancer using next-generation RNA sequencing. Genome Res. 2011;21:56–67. [DOI] [PMC free article] [PubMed] [Google Scholar]
- 12. Tomlins SA, Laxman B, Varambally S, et al. Role of the TMPRSS2-ERG gene fusion in prostate cancer. Neoplasia. 2008;10:177–188. [DOI] [PMC free article] [PubMed] [Google Scholar]
- 13. Ren S, Peng Z, Mao JH, et al. RNA-seq analysis of prostate cancer in the Chinese population identifies recurrent gene fusions, cancer-associated long noncoding RNAs and aberrant alternative splicings. Cell Res. 2012;22:806–821. [DOI] [PMC free article] [PubMed] [Google Scholar]
- 14. Xu X, Zhu K, Liu F, et al. Identification of somatic mutations in human prostate cancer by RNA-Seq. Gene. 2013;519:343–347. [DOI] [PubMed] [Google Scholar]
- 15. Prensner JR, Iyer MK, Balbin OA, et al. Transcriptome sequencing across a prostate cancer cohort identifies PCAT-1, an unannotated lincRNA implicated in disease progression. Nat Biotechnol. 2011;29:742–749. [DOI] [PMC free article] [PubMed] [Google Scholar]
- 16. Singireddy S, Alkhateeb A, Rezaeian I, Rueda L, Cavallo-Medved D, Porter L. Identifying differentially expressed transcripts associated with prostate cancer progression using RNA-Seq and machine learning techniques. Paper presented at: The Computational Intelligence in Bioinformatics and Computational Biology (CIBCB); Niagara Falls, ON, Canada; August 12-15, 2015. [Google Scholar]
- 17. Alkhateeb Rueda AL. Zseq: an approach for preprocessing next-generation sequencing data. J Comput Biol. 2017;24:746–755. [DOI] [PMC free article] [PubMed] [Google Scholar]
- 18. Kim D, Pertea G, Trapnell C, Pimentel H, Kelley R, Salzberg SL. TopHat2: accurate alignment of transcriptomes in the presence of insertions, deletions and gene fusions. Genome Biol. 2013;14:R36. [DOI] [PMC free article] [PubMed] [Google Scholar]
- 19. Refseq Transcript Annotation. ftp://ftp.ncbi.nlm.nih.gov/refseq/H_sapiens/RefSeqGene/. Up-dated 2015. Accessed March 20, 2017.
- 20. Peng H, Long F, Ding C. Feature selection based on mutual information criteria of max-dependency, max-relevance, and min-redundancy. IEEE Trans Pattern Anal Mach Intell. 2005;27:1226–1238. [DOI] [PubMed] [Google Scholar]
- 21. Cortes C, Vapnik V. Support-vector networks. Mach Learn. 1995;120:273–297. [Google Scholar]
- 22. Breiman L. Random forests. Mach Learn. 2001;45:5–32. [Google Scholar]
- 23. Maimon O, Rokach L. Data Mining with Decision Trees: Theory and Applications. Singapore: World Scientific; 2014. [Google Scholar]
- 24. Pazzani M, Domingos P. On the optimality of the simple Bayesian classifier under zero-one loss. Mach Learn. 1997;29:103–130. [Google Scholar]
- 25. Kim J, Dhanasekaran S, Prensner X, et al. Deep sequencing reveals distinct patterns of DNA methylation in prostate cancer. Genome Res. 2011;21:1028–1041. [DOI] [PMC free article] [PubMed] [Google Scholar]
- 26. Long Q, Xu J, Osunkoya AO, et al. Global transcriptome analysis of formalin-fixed prostate cancer specimens identifies biomarkers of disease recurrence. Cancer Res. 2014;74:3228–3237. [DOI] [PMC free article] [PubMed] [Google Scholar]
- 27. Avgeris M, Koutalellis G, Fragoulis EG, Scorilas A. Expression analysis and clinical utility of L-Dopa decarboxylase (DDC) in prostate cancer. Clin Biochem. 2008;41:1140–1149. [DOI] [PubMed] [Google Scholar]
- 28. Zhao L, Wu W, Feng D, Jiang H, Nguyen XL. Bayesian analysis of RNA-seq data using a family of negative binomial models. Bayesian Anal. 2018;13:411–436. [DOI] [PMC free article] [PubMed] [Google Scholar]
- 29. McDonough W, Tran N, Berens M. Regulation of Glioma cell migration by seri ne-phosphorylated P311. Neoplasia. 2005;7:862–872. [DOI] [PMC free article] [PubMed] [Google Scholar]
- 30. Williams GT, Farzaneh F. Are snoRNAs and snoRNA host genes new players in cancer? Nat Rev Cancer. 2012;12:84–88. [DOI] [PubMed] [Google Scholar]
- 31. Chu L, Su M, Maggi L, Jr, et al. Multiple myeloma-associated chromosomal translocation activates orphan snoRNA ACA11 to suppress oxidative stress. J Clin Invest. 2012;22:2793–2806. doi: 10.1172/JCI63051. [DOI] [PMC free article] [PubMed] [Google Scholar]
- 32. Bos JL, Rehmann H, Wittinghofer A. GEFs and GAPs: critical elements in the control of small G proteins. Cell. 2007;129:865–877. [DOI] [PubMed] [Google Scholar]
- 33. Rossman KL, Der CJ, Sondek J. GEF means go: turning on RHO GTPases with guanine nucleotide-exchange factors. Nat Rev Mol Cell Biol. 2005;6:167–180. [DOI] [PubMed] [Google Scholar]
- 34. Romanuik T, Wang G, Morozova O, Delaney A, Marra M, Sadar M. LNCaP atlas: gene expression associated with in vivo progression to castration-recurrent prostate cancer. BMC Med Genomics. 2010;3:43. [DOI] [PMC free article] [PubMed] [Google Scholar]
- 35. Sales KJ, Milne SA, Williams AR, Anderson RA, Jabbour HN. Expression, localization, and signaling of prostaglandin F2α receptor in human endometrial adenocarcinoma: regulation of proliferation by activation of the epidermal growth factor receptor and mitogen-activated protein kinase signaling pathways. J Clin Endocrinol Metabol. 2004;89:986–993. [DOI] [PubMed] [Google Scholar]
- 36. Anderson KS, Sibani S, Wallstrom G, et al. Protein microarray signature of autoantibody biomarkers for the early detection of breast cancer. J Proteome Res. 2010;10:85–96. [DOI] [PMC free article] [PubMed] [Google Scholar]
- 37. Akiyama KK, Ohga N, Maishi N, et al. The F-prostaglandin receptor is a novel marker for tumor endothelial cells in renal cell carcinoma. Pathol Int. 2013;63:37–44. [DOI] [PubMed] [Google Scholar]
Associated Data
This section collects any data citations, data availability statements, or supplementary materials included in this article.
Data Availability Statement
We used 3 data sets, Kim’s,25 Ren’s,13 and Kannan’s,10 each containing matched normal versus malignant prostate cancer tumor samples. Ren’s data set used random hexamer primers, whereas the others’ data sets used oligo (DT) primers. All these data sets are in sequence read archive (SRA) file format and are publicly available from the National Center for Biotechnology Information (NCBI) repository. Table 1 shows the number of samples in each data set.
Table 1.
Data sets used in this study for malignant versus normal analysis with the number of samples in each data set.
In addition, we used the data set from Long et al26 which contains prostate cancer progression stages using 104 samples from 100 patients. Table 2 shows the distribution of samples across various stages of prostate cancer in this data set.


