

Abstract
Objectives:
(1) To compare level of function, activity, health-related quality of life (HRQoL) and satisfaction in persons with a lower extremity amputation before surgery and 6- and 12-months after implantation of an osseointegration implant and (2) to report adverse events.
Design:
Prospective cohort study.
Setting:
University medical centre.
Subjects:
A total of 40 consecutive persons (median age: 56 years) who received a transfemoral (31) or transtibial (9) osseointegration implant, between April 2014 and March 2016.
Intervention:
Osseointegration implant surgery followed by a predefined rehabilitation programme.
Main measures:
Hip abductor strength, prosthetic use, back pain frequency, postoperative pain, mobility level (Timed-Up and Go (TUG) and wheelchair-boundedness), walking ability (6 minute walking test (6MWT) and walking distance in daily life), HRQoL, satisfaction regarding the prosthesis, and adverse events.
Results:
Strength, prosthetic use, walking distance, HRQoL, and satisfaction level increased significantly at 6- and 12-month follow-up compared to baseline (P ⩽ 0.002). The TUG showed no change at 6-month follow-up (P = 0.420) but improved significantly at 12-month follow-up compared to baseline (P = 0.005). Wheelchair-boundedness decreased from 12/40 participants at baseline to 0 at follow-ups. The 6MWT (P ⩾ 0.038) and back pain (P ⩾ 0.437) did not change over time. Stump pain was present in 28/39 and 22/40 of the participants at 6-and 12-month follow-up, respectively. The major adverse events were managed successfully and included three dual-cone breakages and four bone fractures. An uneventful course was completed by 19/31 transfemoral and 4/9 transtibial bone-anchored prostheses users.
Conclusion:
Bone-anchored prostheses lead to improved performance and appear to be safe, so they might be considered for persons with socket-related problems.
Keywords: Amputees, artificial limbs, osseointegration, functional outcomes, safety
Introduction
Socket-suspended prostheses users suffer frequently from socket-related problems. Bone-anchored prostheses using a transcutaneous osseointegration implant might be a solution.1 This technique is already used for persons with trauma- or tumour-related transfemoral amputation but might be also useful for persons with a transtibial amputation, and in persons with peripheral vascular disease.2–4 Especially in these populations, insight into the impact of osseointegration implant surgery on functional performance and the incidence of adverse events is scarce. Although it is hypothesized that bone-anchored prostheses facilitate early recovery of mobility level and walking ability, insight into the course within the first year is missing.
This prospective study focussed on patients with a lower extremity amputation who had problems with using a socket-suspended prosthesis, and therefore, were scheduled for implantation of a press-fit osseointegration and a predefined rehabilitation programme.4,5 The primary aim was to describe the change in the body functions or structures (hereafter referred to as level of function), level of activity, level of health-related quality of life (HRQoL), and level of satisfaction at 6 and 12 months after surgery compared to preoperative while using a socket-suspended prosthesis. We hypothesized that hip abductor strength, prosthetic use, back pain, mobility level, walking ability, HRQoL, and prosthetic comfort would improve over time.4 Outcomes are stratified by amputation level (i.e. transfemoral and transtibial), and we analysed the influence of wheelchair-boundedness prior osseointegration implant surgery on the course of the outcomes. The secondary aim of this study was to describe the number and severity of adverse events.
Methods
Study design
This is the first report of a prospective cohort study with a one-year follow-up. The detailed study protocol was published previously.4 Following the Strengthening the Reporting of Observational studies in Epidemiology (STROBE) statement, we present the results of the time trend analyses with follow-ups at 6 and 12 months.
Participants
All consecutive persons who received a transfemoral or transtibial press-fit osseointegration implant in our university medical centre (Radboudumc), between April 2014 and March 2016, were eligible for this study. Persons were eligible for this surgery if (1) they were adults with a lower extremity amputation suffering from socket-related problems contributing to limited prosthetic use,6 and (2) the cause of primary amputation was congenital or due to a trauma, tumour resection, or stable vascular disease. Exclusion criteria for surgery were the presence of severe cognitive or psychiatric disorders. Prior to the inclusion, a written informed consent was obtained from all participants. The study was conducted according to the principles of the Declaration of Helsinki (64th version, 19 October 2013). The protocol of this study (registration number 2014/196) was approved by the Ethics Committees of Radboudumc.
Intervention
Osseointegration implant implantation was performed in two surgeries six to eight weeks apart.2,6 First, a cementless intramedullary stem was press-fit inserted in the femur or tibia (either or not using locking screws), and the wound was closed. Second, a soft-tissue stoma was created, and a transcutaneous adapter (dual-cone with safety weak points) was attached into the intramedullary stem (Figure 1). For the femur, the osseointegrated prosthetic limb (Permedica s.p.a., Via Como, 38, 23807 Merate LC, Italy) or integral leg prosthesis (Orthodynamics GmbH, Grapengießerstraße Lübeck, Germany 34, 23556 ) implant was used, for the tibia, a patient-specific implant (Orthodynamics GmbH, Grapengießerstraße 34, 23556 Lübeck, Germany; AQ Implants GmbH, Kurt-Fischer-Straße 22, 22926 Ahrensburg, Germany) was developed.2 All persons started rehabilitation one week after the second surgery, using a full-length prosthesis with the same prosthetic components as prior to the osseointegration implant surgery. Rehabilitation focussed on improving hip abductor strength, core stability, symmetry of gait parameters, and level of activity.5 The duration of the predefined twice weekly rehabilitation programme depended on amputation level and ranged from four weeks (transtibial amputation) to 11 weeks (transfemoral amputation).4 An interlude was initiated if pain or limited muscle strength was an obstacle to reduce walking aid use. Rehabilitation was prolonged if a person was making progress but had not yet met the predefined goals.
Figure 1.

Radiographs of the used types of osseointegration implants: (a) integral leg prosthesis; (b) osseointegrated prosthetic limb; (c) patient-specific implant. Left: intramedullary stem immediately postoperatively and right: osseointegrated implant at the 12-month follow-up.
Study procedures and outcomes
Participants were measured by the treating physiotherapist preoperatively (baseline) and at the 6- and 12-month follow-up. The outcomes of this study were level of function, activity, HRQoL, and satisfaction (Table 1). The obtained gait kinematics were not reported in this study, in contrast to what we described in our study protocol,4 due to insufficient clinimetric properties of the used measurement systems.7 The adverse events during the study period were retrospectively extracted from the participants’ medical file using the classification described by Al Muderis et al.8 (Supplemental Table 1).
Table 1.
Functional outcome measures.
| Construct | Instrument |
|---|---|
| Level of function | |
| Hip abductor strength | Handheld dynamometer (Nm/kg)4,9 |
| Prosthesis wearing time | Questionnaire for persons with a transfemoral amputation Prosthetic use Scorea (0–100 points)10 |
| Back pain frequency | Single question A5: ‘Did you experience back pain within the previous month?’ with three response alternatives; ‘no’, ‘yes, with episodes’ and ‘yes, chronic (daily)’ |
| Postoperative stump pain | Numeric Rating Scale (0–10 points)11 |
| Pain location4 | |
| Level of activity | |
| Mobility level | Medicare Functional Classification Levelb (K0 K4)12 |
| Special Interest Group in Amputee Medicine Workgroup Amputation and Prosthetics mobility scorec (Grade A-F)13 | |
| Use of aids in daily life4 | |
| Timed Up and God (seconds)14 | |
| Walking ability | 6 minute walking teste (m and m/s)15,16 |
| Single question B5: ‘How far can you walk in one go in everyday life?’ representing a patient-reported estimation of the walking distance in daily life in metres | |
| Level of health-related quality of life | |
| Health-related quality of life | Questionnaire for persons with a transfemoral amputation Global Scoref (0–100 points)10 |
| Single question C10,17: ‘How would you summarize your overall situation as an amputee?’, with five response alternatives; ‘extremely poor’, ‘poor’, ‘average’, ‘good’ or ‘extremely good’ | |
| Level of satisfaction | |
| Prosthetic comfort | Prosthetic Comfort Scoreg (0–10 points)5 |
| Global perceived effect of bone-anchored prosthesis | Single question D4: ‘Would you, with your current knowledge, choose for a BAP again?’ with five response alternatives; ‘strongly disagree’, ‘disagree’, ‘neutral’, ‘agree’ or ‘strongly agree’ |
A higher score means longer wearing time.
Known as ‘K-levels’ (0–4) in which ‘K0’ represents a non-ambulator and ‘K4’ a high-level prosthesis user.
‘Grade A’ represents an abandoned prosthesis user and ‘grade F’ a prosthesis user with a normal gait without aids.
Level of physical mobility.
A self-paced test on a 10-m course, representing the submaximal level of functional capacity.
A higher score means a better health-related quality of life. The global score is not applicable for wheelchair-bound persons with the exception of the overall situation item (Question C).
Level of satisfaction of the participant in regards to their prosthesis, including the socket or bone-anchored part of the prosthesis.
Statistical analysis
Categorical descriptive data were presented as exact numbers. Percentages were calculated for the various levels. For the continuous descriptive data, means and standard deviations were calculated for normally distributed variables. For data not-normally distributed median, 25th and 75th percentile were used. Demographic and participant characteristics were used for descriptive statistics.
First, we analysed changes over time in the entire cohort. Generalized estimating equations with an exchangeable correlation matrix was used to analyse binary outcomes (back pain) and normally distributed continuous outcomes (hip abductor strength, mobility level: Timed Up and Go (TUG) test, walking ability: 6 minute walking test (6MWT), HRQoL, and prosthetic comfort). Back pain was dichotomized for this analysis into ‘no back pain’ and ‘back pain’ (representing the classes ‘yes, with episodes’ and ‘yes, chronic (daily)’). The mean change-over time of the continuous outcomes and the odds ratio of the dichotomized outcome were presented with 99% confidence intervals. A 99% confidence interval was used to reduce the risk of type I errors due to multiple testing. Not-normally distributed continuous outcomes (prosthetic use and walking ability: walking distance in daily life) were visualized with histograms, and change over time was tested using the Wilcoxon signed-rank test with an alpha level of 0.01. Wheelchair-bound participants were completely excluded in the complete case time-trend analysis of prosthetic use and walking ability using the Wilcoxon signed-rank test. In the generalized estimating equations analysis, participants were only excluded from the follow-up moment in which they were wheelchair-bound with the exception of the time-trend analysis of hip abductor strength which involved all participants.
Second, the change over time of the other categorical outcomes were analysed using descriptive statistics by calculating the change in levels at both follow-ups compared to baseline expressed as a percentage.
Third, stump pain (intensity and location) and global perceived effect of bone-anchored prosthesis were only obtained postoperatively, the course of both were analysed using descriptive statistics.
Moreover, outcomes are presented for subgroups stratified by amputation level using descriptive statistics. Within the subgroups, we also present the results stratified by the presence of wheelchair-boundedness before surgery.
All analyses were performed using SPSS version 23 (SPSS Inc, Chicago, Illinois, USA).
Results
All 40 eligible participants were included in the study; 31 participants received a transfemoral osseointegration implant and nine a transtibial osseointegration implant (Table 2 and Figure 2). The median time from primary amputation was eight years (range: 1–46 years). A total of 12 participants were wheelchair-bound at baseline (Figure 3). The median rehabilitation duration was 24 weeks (range: 6–62 weeks, 7–71 sessions) and nine weeks (range: 3–22 weeks, 7–21 sessions) for participants with a transfemoral and transtibial bone-anchored prosthesis, respectively. No participants were lost to follow-up. The 6- and 12-month follow-up measurements were completed by 39 and 40 participants, respectively (Table 3 and Figure 3). In the following paragraphs, we will first detail the impact of the intervention at the 12-month follow-up; second, we present the six-month follow-up results to increase the insight into the course within the first year; third, we describe the results for the stratified cohorts; and finally, the adverse events within the study period will be detailed.
Table 2.
Demographic, participant, and rehabilitation characteristics.
| Entire cohort | Transfemoral cohort | Transtibial cohort | |
|---|---|---|---|
| Participants, n | 40 | 31 | 9 |
| Sex (male), n (%) | 22 (55) | 17 (55) | 5 (56) |
| Age at inclusion (years), median (25th PCTL; 75th PCTL) | 55.5 (43.3; 59.0) | 56.0 (45.0; 59.0) | 43.0 (29.5; 57.5) |
| Time from primary amputation to inclusion (years), median (25th PCTL; 75th PCTL) | 8.0 (3.0; 19.8) | 6.0 (3.0; 26.0) | 11.0 (3.0; 17.5) |
| BMI (kg/m2), mean (SD) | 29.0 (5.7) | 29.0 (5.7) | 28.9 (5.8) |
| Amputation | |||
| Unilateral, n (%) | 38 (95) | 19 (94) | 9 (100) |
| Bilateral, n (%) | 2 (5) | 2 (7) | 0 (0) |
| Cause of primary amputation | |||
| Trauma, n (%) | 22 (55) | 17 (55) | 5 (56) |
| Tumour, n (%) | 7 (18) | 7 (23) | 0 (0) |
| Vascular, n (%) | 5 (13) | 3 (10) | 2 (22) |
| Other, n (%) | 6 (15) | 4 (13) | 2 (22) |
| Wheelchair-bound at baseline, n (%) | 12 (30) | 10 (32) | 2 (22) |
| Primary amputation levela | |||
| Transfemoral amputation, n (%) | 31 (74) | 30 (97) | |
| Knee disarticulation, n (%) | 1 (2) | 1 (3) | |
| Transtibial amputation, n (%) | 9 (21) | 9 (90) | |
| Foot amputation, n (%) | 1 (2) | 1 (10) | |
| Stump characteristics (cm) | |||
| Proximal circumference, mean (SD) | 57.0 (7.2) | 55.7 (6.1) | 61.7 (9.1) |
| Length | |||
| Transfemoral amputation, mean (SD) | 22.1 (4.7) | 22.1 (4.7) | |
| Knee disarticulation, mean (SD) | 40.5 | 40.5 | |
| Transtibial amputation, mean (SD) | 51.8 (4.8) | 51.8 (4.8) | |
| Foot amputation | 74.0 | 74.0 | |
| Extremities treated, nb | 41 | 32 | 9 |
| Integral leg prosthesis (chromium-cobalt-molybdenum), n (%) | 17 (41) | 17 (53) | |
| Osseointegrated prosthetic limb (titanium), n (%) | 15 (37) | 15 (47) | |
| Patient-specific implant (chromium-cobalt-molybdenum), n (%) | 1 (2) | 1 (11) | |
| Patient-specific implant (titanium), n (%)c | 8 (20) | 8 (89) | |
| Rehabilitation duration (weeks), median (25th PCTL; 75th PCTL) | 19.7 (10.1; 25.9) | 23.7 (14.0; 28.0) | 9.0 (5.4; 16.3) |
| Rehabilitation sessions (n), median (25th PCTL; 75th PCTL) | 20.0 (12.3; 30.0) | 26.0 (15.0; 31.0) | 10.0 (8.5; 17.0) |
BMI: body mass index accounting for the limb loss using the adjusted body weight; PCTL: percentile; SD: standard deviation.
Total extremities = 42: one participant had a bilateral transfemoral amputation, and one participant had a bilateral amputation of which right on transfemoral level and left on transtibial level.
The participant with bilateral transfemoral amputation was treated with a titanium implant on two limbs, the other bilateral participant was treated with a titanium implant on the transfemoral residual limb.
Two participants received the osseointegration implant and dual-cone in a single-stage surgical procedure because closure of the wound after inserting the osseointegration implant was not possible due to marginal coverage of the tibia with soft tissue.
Figure 2.
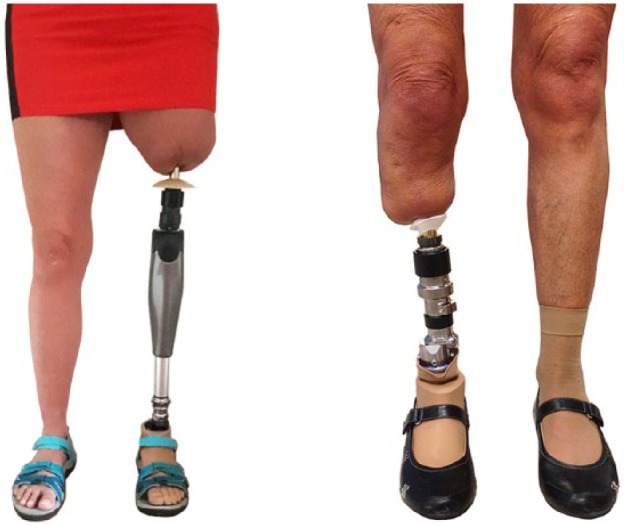
Bone-anchored prostheses. Left: transfemoral bone-anchored prosthesis and right: transtibial bone-anchored prosthesis.
Figure 3.

Flow chart illustrating the number of participants within the study.
Table 3.
Results entire group.
| Baseline (T0) (n = 40) | Six-month (T1) (n = 39)a | 12-month (T2) (n = 40) | Mean change T1–T0 (SE)b | 99% confidence interval (T1–T0) | Mean change T2–T0 (SE)b | 99% confidence interval (T2–T0) | |
|---|---|---|---|---|---|---|---|
| Function-level | |||||||
| Hip abductor strength (Nm/kg)c | |||||||
| Residual limb, beta (SE) | 0.71 (0.04) | 0.85 (0.06) | 0.87 (0.05) | 0.14 (0.03) | 0.06−0.22* | 0.16 (0.03) | 0.08−0.25* |
| Sound limb, beta (SE) | 0.86 (0.04) | 0.96 (0.05) | 1.03 (0.05) | 0.10 (0.03) | 0.02−0.18* | 0.17 (0.03) | 0.10−0.24* |
| Q-TFA Prosthetic use score (0–100), median (25th PCTL; 75th PCTL) | 81 (0; 100) | 90 (90; 100) | 100 (90; 100) | NA | NA | NA | NA |
| Back pain, OR (SE) | −0.1 (0.3) | 0.2 (0.3) | 0.2 (0.3) | 0.3 (0.4) | −0.7–1.3 | 0.3 (0.4) | −0.7–1.3 |
| No, n (%) | 21 (53) | 18 (46) | 18 (45) | ||||
| Yes, with episodes, n (%) | 7 (18) | 14 (36) | 14 (35) | ||||
| Yes, chronic, n (%) | 12 (30) | 7 (18) | 8 (20) | ||||
| Stump pain | |||||||
| Pain (0–10), mean (SD) | NA | 3.2 (2.8) | 2.1 (2.7) | NA | NA | NA | NA |
| Pain location, n (%)d | NA | NA | NA | NA | |||
| No location | NA | 11 (24) | 18 (40) | ||||
| Soft tissue stoma | NA | 13 (28) | 9 (20) | ||||
| Circular distal side residual limb | NA | 6 (13) | 7 (16) | ||||
| Ventral side residual limb | NA | 2 (4) | 4 (9) | ||||
| Inguinal area | NA | 3 (7) | 2 (4) | ||||
| Greater trochanteric area | NA | 6 (13) | 4 (9) | ||||
| Other | NA | 5 (11) | 1 (2) | ||||
| Activity-level | |||||||
| Mobility level | |||||||
| MFC-level, n (%) | NA | NA | NA | NA | |||
| Level 0 | 12 (30) | 0 (0) | 0 (0) | ||||
| Level 1 | 3 (8) | 1 (3) | 2 (5) | ||||
| Level 2 | 1 (3) | 6 (15) | 3 (8) | ||||
| Level 3 | 16 (40) | 14 (36) | 16 (40) | ||||
| Level 4 | 8 (20) | 18 (46) | 19 (48) | ||||
| SIGAM-WAP score, n (%) | NA | NA | NA | NA | |||
| Grade A | 12 (30) | 0 (0) | 0 (0) | ||||
| Grade B | 0 (0) | 0 (0) | 0 (0) | ||||
| Grade C | 1 (3) | 0 (0) | 1 (3) | ||||
| Grade D | 8 (20) | 14 (36) | 9 (23) | ||||
| Grade E | 6 (15) | 6 (15) | 11 (28) | ||||
| Grade F | 13 (33) | 19 (49) | 19 (48) | ||||
| Use of aids in daily life: Indoors, n (%) | NA | NA | NA | NA | |||
| Wheelchair-bound | 12 (30) | 0 (0) | 0 (0) | ||||
| Walking frame/rollator | 0 (0) | 0 (0) | 0 (0) | ||||
| Two crutches/canes | 3 (8) | 3 (8) | 3 (8) | ||||
| One crutch/cane | 2 (5) | 1 (3) | 2 (5) | ||||
| None | 23 (58) | 35 (90) | 35 (88) | ||||
| Use of aids in daily life: Outdoors, n (%) | NA | NA | NA | NA | |||
| Wheelchair-bound | 12 (30) | 0 (0) | 0 (0) | ||||
| Walking frame/rollator | 1 (3) | 0 (0) | 0 (0) | ||||
| Two crutches/canes | 4 (10) | 8 (21) | 6 (15) | ||||
| One crutch/cane | 5 (13) | 6 (15) | 7 (18) | ||||
| None | 18 (45) | 25 (64) | 27 (68) | ||||
| TUG (s), Beta (SE)e | 12.0 (1.2) | 11.4 (0.9) | 10.0 (0.8) | −0.5 (0.6) | −2.2–1.1 | −1.9 (0.7) | −3.7–−0.2* |
| Walking ability | |||||||
| 6MWT (m), beta (SE)f | 319 (16) | 309 (18) | 344 (18) | −10 (13) | −43–23 | 25 (12) | −6–56 |
| 6MWT (m/s), beta (SE)f | 0.89 (0.04) | 0.86 (0.05) | 0.96 (0.05) | −0.03 (0.04) | −0.12–0.06 | 0.07 (0.03) | −0.02–0.16 |
| Walking distance in daily life (m), median (25th PCTL; 75th PCTL) | 400 (0; 1000) | 1000 (400; 2000) | 1900 (1000; 3500) | NA | NA | NA | NA |
| Health-related quality of life-level | |||||||
| Q-TFA Global Score (0–100), beta (SE)g | 46 (3) | 69 (3) | 71 (3) | 23 (3) | 15–31* | 25 (4) | 16–34* |
| Overall situation, n (%) | NA | NA | NA | NA | |||
| Extremely poor | 1 (3) | 0 (0) | 0 (0) | ||||
| Poor | 7 (18) | 2 (5) | 3 (8) | ||||
| Average | 7 (18) | 5 (13) | 6 (15) | ||||
| Good | 23 (58) | 23 (59) | 20 (50) | ||||
| Extremely good | 2 (5) | 9 (23) | 11 (28) | ||||
| Satisfaction-level | |||||||
| Global perceived effect of BAP | NA | NA | NA | NA | |||
| Strongly disagree | NA | 1 (3) | 1 (3) | ||||
| Disagree | NA | 0 (0) | 0 (0) | ||||
| Neutral | NA | 1 (3) | 0 (0) | ||||
| Agree | NA | 2 (5) | 5 (13) | ||||
| Strongly agree | NA | 35 (90) | 34 (85) | ||||
| Prosthetic comfort score (0–10), Beta (SE)h | 5.1 (0.4) | 8.2 (0.3) | 8.4 (0.2) | 3.1 (0.4) | 1.9–4.2* | 3.2 (0.5) | 2.1–4.5* |
Q-TFA: Questionnaire for persons with a transfemoral amputation; MFC-level: Medicare Functional Classification Level; SIGAM-WAP score: Special Interest Group in Amputee Medicine Workgroup Amputation and Prosthetics mobility score; TUG: Timed Up and Go; 6MWT: 6 minute walking test; BAP: bone-anchored prosthesis; NA: Not applicable; n: number of participants; SE: standard error; OR: Odds ratio; PCTL: percentile.
At six-month follow-up, one participant was recovering from a pertrochanteric fracture after a fall accident, hence resulting in lower number of participants at six-month follow-up: n = 39.
Continuous outcomes: mean change (standard error); dichotomized back pain outcome: odds ratio (standard error).
The mean strength of both limbs from the participant with a bilateral transfemoral amputation who was treated bilaterally was used as value for residual limb strength, hence resulting in lower number of participants for the residual limb strength. At 6 and 12-month follow-up, one participant and two participants, respectively, did not perform the residual limb strength test due to stump pain resulting in a lower number of participants. Residual limb test: baseline: (n = 40), six-month follow-up (n = 38), 12-month follow-up (n = 38). Sound limb test: baseline: (n = 39), six-month follow-up (n = 38), 12-month follow-up (n = 39).
Some participants experienced pain in multiple location, hence resulting in higher numbers of scores than the number of participants.
Wheelchair-bound participants did not perform the TUG, hence resulting in lower number of participants at baseline: n = 28.
Wheelchair-bound participants did not perform the 6MWT, hence resulting in lower number of participants at baseline: n = 28. At six-month follow-up, one participant did not perform the 6MWT (due to stump pain), and at 12-month follow-up, two participants did not perform the 6MWT (one due to stump pain and one due to wrist complaints), which resulted in a lower number of participants: n = 38 at both follow-ups.
The Q-TFA global score is not applicable for wheelchair-bound participants with the exception of the overall situation item, hence resulting in lower number of participants at baseline: n = 28.
The Prosthetic Comfort score is not applicable for wheelchair-bound participants, hence resulting in lower number of participants at baseline: n = 28.
The 99% confidence interval does not contain 0, thus the change over time was statistically significant.
Functional outcomes: 12-month follow-up
At level of function, hip abductor strength increased significantly (P ⩽ 0.002) at 12-month follow-up (residual limb: β = 0.16, standard error = 0.03 (23%), sound limb: β = 0.17, standard error = 0.03 (20%) compared to baseline. Prosthesis wearing time increased significantly (P < 0.001) at 12-month follow-up compared to baseline (Appendix A). Back pain did not change statistically significant over time (P = 0.437). Stump pain was present in 22/40 (55%) of the participants at 12-month follow-up. Of these participants, 14/22 (64%) experienced on average a mild stump pain on the distal part of the stump (circular or the soft-tissue stoma) at 12-month follow-up.
At the level of activity patient-reported mobility level increased at 12-month follow-up relative to baseline represented by an increased percentage of participants classified as Medicare Functional Classification Level K3–4 and Special Interest Group in Amputee Medicine Workgroup Amputation and Prosthetics mobility score grade E–F at 12-month follow-up (K3–4: 11/40 (28%), grade E–F: 11/40 (28%). None of the participants were wheelchair-bound at 12-month follow-up. The percentage of unaided walkers increased at 12-month follow-up (indoors: 12/40 (30%), outdoors: 9/40 (23%) compared to baseline. The physical performance measurement (i.e. TUG) increased significantly (P = 0.005) by β = −1.9, standard error = 0.7 (17%) at 12-month follow-up compared to baseline. Walking ability represented by the 6MWT increased, although non-significant (P = 0.038), by β = 25, standard error = 12 (8%) at 12-month follow-up compared to baseline. Patient-reported walking distance in daily life increased significantly (P ⩽ 0.001) at 12-month follow-up compared to baseline (Appendix A).
HRQoL increased significantly (P < 0.001) by β = 25, standard error = 4 (54%) at 12-month follow-up compared to baseline. The overall situation as an amputee improved at 12-month follow-up, illustrated by the increased proportion (6/40 (15%) of the participants that scored good or extremely good on question C at follow-up compared to baseline.
At the level of satisfaction prosthetic comfort increased significantly (P < 0.001) by β = 3.2, standard error = 0.5 (65%) at 12-month follow-up compared to baseline. Of all participants, 39/40 (98%) would again opt for the bone-anchored prosthesis at 6- and 12-month follow-up, respectively.
Functional outcomes: six-month follow-up
At six-month follow-up, all the above presented outcomes measures improved significantly as well compared to baseline with the exception of the TUG test (P = 0.420) and the 6MWT (P = 0.429). The outcome measures which were only analysed with descriptive statistics revealed at six-month follow-up similar trends as at 12-months follow-up compared to baseline. The number of participants experiencing stump pain was higher at six-month follow up (28/39 (72%) compared to the 12-month follow-up (22/40 (55%). At six-month follow-up 37/39 (95%), participants would again opt for the bone-anchored prosthesis.
Functional outcomes: stratified cohorts
Stratification based on amputation level revealed the following insights. In the transtibial bone-anchored prosthesis users, we observed higher baseline values compared to transfemoral bone-anchored prosthesis users, with the exception of walking distance in daily life and prosthetic comfort (Supplemental Tables 2 and 3). The increase over time, in percentages, was larger in transtibial bone-anchored prosthesis users compared to transfemoral bone-anchored prosthesis users, with the exception of hip abductor strength and prosthesis wearing time. At the 12-month follow-up less transtibial bone-anchored prosthesis users experienced stump pain than transfemoral bone-anchored prosthesis users (transfemoral: 20/31 (65%), transtibial: 2/9 (22%), and the intensity of the pain was the lowest in transtibial bone-anchored prosthesis users (transfemoral: 3.8 points and transtibial: 1.2 points).
Stratification on both amputation level and wheelchair-boundedness revealed that in transfemoral bone-anchored prosthesis users (Supplemental Table 2), all outcomes of the non-wheelchair-bound participants were superior compared to wheelchair-bound participants, with the exception of HRQoL at 12-month follow-up and prosthesis comfort at six-month follow-up. Contrary to the entire cohort, the residual limb hip abductor strength decreased by 10% at six-month follow-up (0.57 Nm/kg, SD = 0.19) and showed no change at 12-month follow-up (0.63 Nm/kg, SD = 0.23) compared to baseline (0.63 Nm/kg, SD = 0.21) in the wheelchair-bound subgroup. In both transfemoral and transtibial bone-anchored prosthesis users, there was a trend that non-wheelchair-bound participants had less back pain at the follow-ups compared to baseline, while back pain frequency increased over time in wheelchair-bound participants (Supplemental Table 4).
Adverse events
The major adverse events that occurred are as follows: (1) three breakages of the dual-cone, all successfully replaced and (2) four bone fractures (caused by a fall accident in daily use), all successfully treated. No breakage of the intramedullary stem, bone infection, or (a)septic implant loosening occurred. Minor adverse events concerned in particular low-grade soft-tissue infections; 8/18 (44%) of the participants with a chromium-cobalt-molybdenum osseointegration implant and 5/22 (23%) participants with a titanium osseointegration implant had one of more low-grade soft-tissue infections. In total, 19/31 (61%) and 4/9 (44%) of the participants with a transfemoral bone-anchored prosthesis and transtibial bone-anchored prosthesis, respectively, had an uneventful course (Supplemental Table 5).
Discussion
Outcomes on the level of function, activity, HRQoL, and satisfaction improved significantly after 12-months use of a bone-anchored prosthesis compared to the use of a socket-suspended prosthesis with the exception of the 6MWT. Six-months after surgery, this improvement was already visible in majority of the outcomes, including a complete absence of wheelchair-boundedness. All our a priori hypotheses were correct with the exception of the expected decrease of back pain frequency which was only found in the subgroup of participants who were non-wheelchair-bound at baseline.
Stratification based on amputation level showed that stump pain was in particular a persistent problem in participants with a transfemoral bone-anchored prosthesis and seemed to be related to the soft-tissue stoma. A possible explanation for this finding could be that transfemoral bone-anchored prosthesis users experience more mechanical friction between the soft tissue and the dual-cone due to more excessive soft tissue in the stump than transtibial bone-anchored prosthesis users.2 At least, 95% of the participants would again opt for a bone-anchored prosthesis, demonstrating that the functional improvements and the absence of socket-related problems outweighs the presence of stump pain and adverse events.
Stratification based on wheelchair-boundedness revealed that wheelchair-boundedness negatively influenced the ability of transfemoral bone-anchored prosthesis users to recover and generally influence the presence of back pain.
The incidence of implant-related major adverse events was 8%. An uneventful course was more common in transfemoral bone-anchored prosthesis user than in transtibial bone-anchored prosthesis users.
The previously reported improvement in prosthesis wearing time6,18 and HRQoL6,18,19 are comparable to our findings. In the 12-month and 22-month follow-up study by Van de Meent et al.6 and Muderis et al.,19 respectively, participants with a transfemoral bone-anchored prosthesis improved on the TUG test (32%–49%) and the 6MWT (40%–46%) compared to baseline. Our transfemoral cohort performed only 14% and 4% better on the TUG and 6MWT, respectively, despite comparable baseline values and participant characteristics. This discrepancy in results might be explained by the difference in the length of the 6-minute walking course between the studies and the decreased walking aid use over time found in our study.20,21 We used a 10-m 6MWT course, while Van de Meent et al.6 and Muderis et al.19 used a 20-m and 12.5-m 6MWT course, respectively (obtained by contacting the authors). Both authors did not report the used walking aids during the tests. It is easier to improve on a long 6MWT course than on a short 6MWT course.20,21 In our study, walking aid use decreased over time. Although, this is beneficial for daily life activities, it does not implicate that unaided walking improves walking speed.
Similar to our finding, Hagberg et al.22 found no change in back pain after transfemoral osseointegration implant surgery. However, wheelchair-boundedness stratification revealed that back pain frequency of non-wheelchair-bound participants decreased over time compared to baseline while wheelchair-bound participants showed an opposite trend. This trend in change of back pain is possibly associated with the change in hip abductor strength as observed in the transfemoral bone-anchored prosthesis users. The level of satisfaction was high in our cohort which is similar as found in another cohort of transfemoral bone-anchored prosthesis users.23
To our knowledge, this study is the first to report (1) functional outcomes and adverse events of a consecutive cohort of transtibial bone-anchored prosthesis users, (2) a six-month follow-up, (3) hip abductor strength outcomes, (4) the prevalence and intensity of postoperative stump pain, and (5) the real rehabilitation duration and intensity of a cohort of bone-anchored prosthesis users using a press-fit osseointegration implant. In literature, various rehabilitation programmes are described, ranging from 4 to 14 weeks5,6,19,24 for persons with a press-fit osseointegration implant and six months for persons with a screw-type osseointegration implant.17 This cohort study showed that there are differences in the predefined duration of the rehabilitation programmes and daily clinical practice, while the number of rehabilitation sessions is comparable. In our study, 19/31 (61%) of the transfemoral and 4/9 (44%) of the transtibial bone-anchored prosthesis users needed an interlude in their rehabilitation programme due to pain or limited muscle strength which can explain the observed difference in rehabilitation duration. A recently published study of persons with a screw-type osseointegration implant revealed also a variability in rehabilitation duration despite a predefined rehabilitation programme.25
This study contains some limitations. First, the adverse events were extracted from the participants’ Radboudumc medical file. Minor adverse events (e.g. infection grade 1A and 2A) typically treated by participants’ general practitioners could have been missed resulting in an underestimation of these minor adverse events. Second, the sample size of the presented subgroups was small due to stratification on two levels, consequently only descriptive statistics were used to analyse the time trend of these strata. In future reports of this ongoing study,4 we will present larger samples of each stratum thereby increasing the generalisability of the stratified results. Third, the outcome measures were collected by the treating physiotherapist as part of usual care. A blinded assessor is preferable to decrease the risk of measurement bias. This was not an eligible option in this study because blinding for the type of prosthesis is not possible. Fourth, self-reported outcomes could have been biased by response shift resulting in an overestimation of the benefits of bone-anchored prostheses compared to socket-suspended prostheses.26 We measured mobility level and walking ability both with patient-reported outcome measures as with performance tests, which is important because they measure different aspects of the construct and may vary in responsiveness.27,28 The findings at six-month follow-up and in part at 12-month follow-up were inconclusive because the patient-reported outcomes improved while the performance tests did not change significantly compared to baseline. In future research, the use of an activity tracker can be of added value to gain insight into this discrepancy.27 Fifth, we used a robust measure to investigate back pain. Because of this, insight into back pain intensity and influence of back pain on the level of functional difficulties is still missing. Future research should include more sensitive measures such as an NRS11 and the Revised Oswestry Low Back Pain Disability Questionnaire,29,30 and should explore possible underlying mechanisms by measuring gait kinematic parameters. Finally, because this is an observational study, we are not able to determine the relative effectiveness of the bone-anchored prosthesis compared to the socket-suspended prosthesis. Controlled clinical studies are necessary although this provides an ethical challenge, while currently osseointegration implant surgery is not used as a primary intervention after amputation but as a last resort for persons suffering from socket-related problems.
Besides insight into health benefits, it is important to gain insight into the cost-effectiveness before implementation on a larger scale is initiated. A recent cost-effectiveness analysis31 showed that bone-anchored prostheses had an incremental cost per quality-adjusted life-year gained of €83,374 compared with socket-suspended prostheses. However, a decline in utility values for persons with a socket-suspended prosthesis, which is common in the target population for a bone-anchored prosthesis, resulted in a substantial reduction of the cost per quality-adjusted life-year up to €18,952 per quality-adjusted life-year. These results are gathered in persons using a screw-type osseointegration implant, which has a different treatment procedure compared to the press-fit osseointegration implants. Cost-effectiveness should be included in future research in persons using a press-fit osseointegration implant to gain insight into the impact of the type of implant, the treatment regimens, and the country in which the care is given on the cost-effectiveness of bone-anchored prosthesis.
Clinical messages.
Ratio between functional benefits of bone-anchored prosthesis and adverse events appears sufficient, and therefore, an eligible alternative for socket-suspended prostheses in persons with socket-related problems.
Wheelchair-boundedness decreased to zero, walking distance increased.
Around 98% of the participants would again opt for the bone-anchored prosthesis.
Adverse events occurred frequently but could be managed with relatively simple measures.
Supplemental Material
Supplemental material, Supplemental_Material for Functional performance and safety of bone-anchored prostheses in persons with a transfemoral or transtibial amputation: a prospective one-year follow-up cohort study by Ruud A Leijendekkers, Gerben van Hinte, Jan Paul Frölke, Hendrik van de Meent, Femke Atsma, Maria WG Nijhuis-van der Sanden and Thomas J Hoogeboom in Clinical Rehabilitation
Acknowledgments
The authors acknowledge the contribution of Shanna Bloemen and Charlotte Bockting for participating in the measurements, Tom Langenhuijzen, Marco Papenburg and Stefan Claassen as participating prosthetists. All authors contributed to the idea and the design of the study, contributed to drafting the article including discussions regarding the analyses and results, and read and approved the final manuscript. R.A.L., G.V.H. and H.V.D.M. had the main responsibility for the data collection. R.A.L. processed the raw data, performed all statistical analyses, and had the main responsibility for writing the manuscript. All relevant data are within the paper. The data sets generated during and/or analysed during this study are available from the corresponding author on reasonable request.
Footnotes
Declaration of conflicting interests: The author(s) declared the following potential conflicts of interest with respect to the research, authorship, and/or publication of this article: H.V.D.M. reports personal fees from OTN Implants, grants from OTN Netherlands, non-financial support from Amputee Osseointegration Foundation Europe, and grants from Amputee Osseointegration Foundation Europe, outside the submitted work.
Funding: The author(s) received no financial support for the research, authorship, and/or publication of this article.
Supplemental material: Supplemental material for this article is available online.
ORCID iD: Ruud A Leijendekkers  https://orcid.org/0000-0002-6158-6901
References
- 1. Leijendekkers RA, van Hinte G, Frolke JP, et al. Comparison of bone-anchored prostheses and socket prostheses for patients with a lower extremity amputation: a systematic review. Disabil Rehabil 2017; 39: 1045–1058. [DOI] [PubMed] [Google Scholar]
- 2. Frolke JP, Leijendekkers RA, van de Meent H. Osseointegrated prosthesis for patients with an amputation: multidisciplinary team approach in the Netherlands [Osseointegrierte Prothese fur Patienten nach Amputation: Multidisziplinarer Behandlungsansatz in den Niederlanden]. Unfallchirurg 2017; 120: 293–299. [DOI] [PMC free article] [PubMed] [Google Scholar]
- 3. Atallah R, Li JJ, Lu W, et al. Osseointegrated transtibial implants in patients with peripheral vascular disease: a multicenter case series of 5 patients with 1-year follow-up. J Bone Joint Surg Am 2017; 99(18): 1516–1523. [DOI] [PubMed] [Google Scholar]
- 4. Leijendekkers RA, Staal JB, van Hinte G, et al. Long-term outcomes following lower extremity press-fit bone-anchored prosthesis surgery: a 5-year longitudinal study protocol. BMC Musculoskelet Disord 2016; 17(1): 484. [DOI] [PMC free article] [PubMed] [Google Scholar]
- 5. Leijendekkers RA, van Hinte G, Nijhuis-van der Sanden MW, et al. Gait rehabilitation for a patient with an osseointegrated prosthesis following transfemoral amputation. Physiother Theory Pract 2017; 33(2): 147–161. [DOI] [PubMed] [Google Scholar]
- 6. Van de Meent H, Hopman MT, Frolke JP. Walking ability and quality of life in subjects with transfemoral amputation: a comparison of osseointegration with socket prostheses. Arch Phys Med Rehabil 2013; 94(11): 2174–2178. [DOI] [PubMed] [Google Scholar]
- 7. Leijendekkers RA, Hoogeboom TJ, van Hinte G, et al. Reproducibility and discriminant validity of two clinically feasible measurement methods to obtain coronal plane gait kinematics in participants with a lower extremity amputation [submitted]. [DOI] [PMC free article] [PubMed] [Google Scholar]
- 8. Al Muderis M, Khemka A, Lord SJ, et al. Safety of osseointegrated implants for transfemoral amputees: a two-center prospective cohort study. J Bone Joint Surg Am 2016; 98(11): 900–909. [DOI] [PubMed] [Google Scholar]
- 9. Leijendekkers RA, Hinte GV, Sman AD, et al. Clinimetric properties of hip abduction strength measurements obtained using a handheld dynamometer in individuals with a lower extremity amputation. PLoS ONE 2017; 12(6): e0179887. [DOI] [PMC free article] [PubMed] [Google Scholar]
- 10. Hagberg K, Branemark R, Hagg O. Questionnaire for Persons with a Transfemoral Amputation (Q-TFA): initial validity and reliability of a new outcome measure. J Rehabil Res Dev 2004; 41(5): 695–706. [PubMed] [Google Scholar]
- 11. Englbrecht M, Tarner IH, van der Heijde DM, et al. Measuring pain and efficacy of pain treatment in inflammatory arthritis: a systematic literature review. J Rheumatol Suppl 2012; 90: 3–10. [DOI] [PubMed] [Google Scholar]
- 12. Centers for Medicare and Medicaid Services. U.S. Department of Health and Human Services. HCFA Common Procedure Coding System (HCPCS) 2001 (ed. National Technical Information Service). Springfield, VA: U.S. Department of Commerce, 2001. [Google Scholar]
- 13. Rommers GM, Ryall NH, Kap A, et al. The mobility scale for lower limb amputees: the SIGAM/WAP mobility scale. Disabil Rehabil 2008; 30(15): 1106–1115. [DOI] [PubMed] [Google Scholar]
- 14. Schoppen T, Boonstra A, Groothoff JW, et al. The Timed ‘up and go’ test: reliability and validity in persons with unilateral lower limb amputation. Arch Phys Med Rehabil 1999; 80(7): 825–828. [DOI] [PubMed] [Google Scholar]
- 15. Gailey RS, Roach KE, Applegate EB, et al. The amputee mobility predictor: an instrument to assess determinants of the lower-limb amputee’s ability to ambulate. Arch Phys Med Rehabil 2002; 83(5): 613–627. [DOI] [PubMed] [Google Scholar]
- 16. Steffen TM, Hacker TA, Mollinger L. Age- and gender-related test performance in community-dwelling elderly people: Six-Minute Walk Test, Berg Balance Scale, Timed Up & Go Test, and gait speeds. Phys Ther 2002; 82(2): 128–137. [DOI] [PubMed] [Google Scholar]
- 17. Hagberg K, Branemark R, Gunterberg B, et al. Osseointegrated trans-femoral amputation prostheses: prospective results of general and condition-specific quality of life in 18 patients at 2-year follow-up. Prosthet Orthot Int 2008; 32(1): 29–41. [DOI] [PubMed] [Google Scholar]
- 18. Branemark R, Berlin O, Hagberg K, et al. A novel osseointegrated percutaneous prosthetic system for the treatment of patients with transfemoral amputation: a prospective study of 51 patients. Bone Joint J 2014; 96-B(1): 106–113. [DOI] [PubMed] [Google Scholar]
- 19. Muderis MA, Tetsworth K, Khemka A, et al. The Osseointegration Group of Australia Accelerated Protocol (OGAAP-1) for two-stage osseointegrated reconstruction of amputated limbs. Bone Joint J 2016; 98-B(7): 952–960. [DOI] [PubMed] [Google Scholar]
- 20. Beekman E, Mesters I, Hendriks EJ, et al. Course length of 30 metres versus 10 metres has a significant influence on six-minute walk distance in patients with COPD: an experimental crossover study. J Physiother 2013; 59(3): 169–176. [DOI] [PubMed] [Google Scholar]
- 21. Barnett CT, Bisele M, Jackman JS, et al. Manipulating walking path configuration influences gait variability and six-minute walk test outcomes in older and younger adults. Gait Posture 2016; 44: 221–226. [DOI] [PubMed] [Google Scholar]
- 22. Hagberg K, Hansson E, Branemark R. Outcome of percutaneous osseointegrated prostheses for patients with unilateral transfemoral amputation at two-year follow-up. Arch Phys Med Rehabil 2014; 95(11): 2120–2127. [DOI] [PubMed] [Google Scholar]
- 23. Hoffmeister T, Schwarze F, Aschoff HH. The endo-exo prosthesis treatment concept: improvement in quality of life after limb amputation [Das Endo-Exo-Prothesen-Versorgungskonzept: Verbesserung der Lebensqualitat nach Extremitatenamputation]. Unfallchirurg 2017; 120(5):371–377. [DOI] [PubMed] [Google Scholar]
- 24. Aschoff HH, Kennon RE, Keggi JM, et al. Transcutaneous, distal femoral, intramedullary attachment for above-the-knee prostheses: an endo-exo device. J Bone Joint Surg Am 2010; 92(suppl. 2): 180–186. [DOI] [PubMed] [Google Scholar]
- 25. Matthews DJ, Arastu M, Uden M, et al. UK trial of the osseointegrated prosthesis for the rehabilitation for amputees: 1995–2018. Prosthet Orthot Int. Epub ahead of print 16 August 2018. DOI: 10.1177/0309364618791616. [DOI] [PubMed] [Google Scholar]
- 26. Howard JS, Mattacola CG, Howell DM, et al. Response shift theory: an application for health-related quality of life in rehabilitation research and practice. J Allied Health 2011; 40(1): 31–38. [PubMed] [Google Scholar]
- 27. Shephard RJ. Limits to the measurement of habitual physical activity by questionnaires. Br J Sports Med 2003; 37(3): 197–206 [DOI] [PMC free article] [PubMed] [Google Scholar]
- 28. Wittink H, Rogers W, Sukiennik A, et al. Physical functioning: self-report and performance measures are related but distinct. Spine (Phila Pa 1976) 2003; 28(20): 2407–2413. [DOI] [PubMed] [Google Scholar]
- 29. Denteneer L, Stassijns G, Truijen S, et al. The Modified Low Back Pain Disability Questionnaire: reliability, validity, and responsiveness of a Dutch language version. Spine (Phila Pa 1976) 2018; 43: E292–E298. [DOI] [PubMed] [Google Scholar]
- 30. Fritz JM, Irrgang JJ. A comparison of a modified Oswestry Low Back Pain Disability Questionnaire and the Quebec Back Pain Disability Scale. Phys Ther 2001; 81(2): 776–788. [DOI] [PubMed] [Google Scholar]
- 31. Hansson E, Hagberg K, Cawson M, et al. Patients with unilateral transfemoral amputation treated with a percutaneous osseointegrated prosthesis. Bone Joint J 2018; 100-B(4): 527–534. [DOI] [PMC free article] [PubMed] [Google Scholar]
Associated Data
This section collects any data citations, data availability statements, or supplementary materials included in this article.
Supplementary Materials
Supplemental material, Supplemental_Material for Functional performance and safety of bone-anchored prostheses in persons with a transfemoral or transtibial amputation: a prospective one-year follow-up cohort study by Ruud A Leijendekkers, Gerben van Hinte, Jan Paul Frölke, Hendrik van de Meent, Femke Atsma, Maria WG Nijhuis-van der Sanden and Thomas J Hoogeboom in Clinical Rehabilitation