Abstract
Purpose.
Interaction is the process of behavior adaption between two or more participants primarily based on what they visually perceive. It is an important aspect of traffic participation and supports a safe and efficient flow of traffic. However, prior driving simulator studies investigating the effects of vision impairment have typically used pre-programmed pedestrians that did not interact with the human driver. In the current study we used a linked pedestrian and driving simulator setting to increase the ecological validity of the experimental paradigm. We evaluated the effects of mild vision loss on interactions between drivers and human-controlled, interactive pedestrians compared to preprogrammed, non-interactive pedestrians.
Method.
Young subjects (mean age 31 years) wore safety goggles with diffusing filters that reduced visual acuity to 20/50 Snellen and contrast sensitivity to 1.49 log units. Two types of crossings (zebra vs. free lane) and two types of pedestrians (non-interactive vs. interactive) were presented to the driver using a multiple simulator setting. Gaze, safety and time series measures were analyzed to quantify the behavior of the participants during the different crossing situations.
Results.
Simulated vision impairment significantly increased the time taken to first fixate on the pedestrian, but only had mild adverse effects on safety measures and subsequent interactions. By comparison, pedestrian type and crossing type were found to significantly affect interaction measures. In crossings with the interactive pedestrians the behavior adaption between the driver and the pedestrian took longer and was less correlated in contrast to the situations with the non-interactive pedestrian.
Conclusion.
Mild vision impairment (slightly worse than the common 20/40 requirement for driving) had little effect on interactions with pedestrians once they were detected and only had mild adverse consequences on driving safety. Time series measures were sensitive to differences in behavior adaption between road users depending on the level of interaction and type of crossing situation.
Keywords: simulated vision impairment, social interaction in traffic, driver pedestrian interaction, time series analysis
1. INTRODUCTION
The car, since its development in the late 19th century, is still one of the most important technical developments for humanity. It enables the individual human being to be part of society and travel from place to place thus helping to maintain independence. Humans have to be mobile and this individual mobility cumulates in traffic. People become traffic participants with all their abilities and disabilities, which likely affect the traffic system. One major aspect of traffic participation is the ability of drivers to sense, perceive and interact safely with other road users. Interaction usually involves externally visible and goal-oriented behavior adaptation of traffic participants relative to one another when they intend to use the same space, a road segment which might become the conflict zone (see appendix C and D), e.g., adapting speed to the traffic flow when merging onto a freeway or in response to a pedestrian about to step onto a crosswalk. Given that the number of pedestrian fatalities in the United States has risen by 27% between 2007 and 2016 (Retting & Schwartz, 2018), it is important to investigate factors that might impede safe interactions between drivers and pedestrians.
Exchange of non-verbal visual cues is an important component of interactions between drivers and pedestrians. For example, hand gestures, body pose, walking/driving speed and gaze/head direction are all visual cues that may be used to express intention in a potential driver-pedestrian encounter (Sucha, Dostal, & Risser, 2017; Guéguen, Meineri, & Eyssartier, 2015; Katz, Zaidel, & Elgrishi, 1975; Rasouli, Kotseruba, & Tsotsos, 2017; Ren, Jiang, & Wang, 2016; Schmidt & Färber, 2009). In fact, it has been estimated that up to 90 % of the necessary information during driving is visual (Bubb, Bengler, Grünen, & Vollrath, 2015; Hills, 1980; Olson & Farber, 1996). Given the potential importance of visual cues, the goal of the current study was to evaluate the effects of mild vision impairment (reduced visual acuity and reduced contrast sensitivity) on driver-pedestrian interactions.
Prior studies investigating interactions between normally-sighted drivers and pedestrians have mostly been conducted in on-road settings and have highlighted the importance of both visual cues and other situational factors in driver-pedestrian interactions. Katz et al. (1975), for example, showed that the type of crossing (marked vs. unmarked), orienting of pedestrian (i.e. looking at the driver), distance of vehicle (and its speed) and pedestrian as well as the number of crossing pedestrians all played significant roles. Further, in the interaction, behavior initiated by the driver at the time the pedestrian started to cross, was dominant. In 2009, Schmidt and Färber studied how the crossing intention of pedestrians can be perceived by the driver from different pedestrian movement patterns. Most of the information related to the crossing intention was conveyed by the pedestrian’s head orientation (28%) and walking dynamics (24%). Two similar studies (Guéguen et al., 2015; Ren et al., 2016) also focused on gaze behavior of pedestrians and its effect on driver’s stopping rate. They found that pedestrians who looked at oncoming drivers forced more drivers to stop compared to pedestrians who did not. Similarly, Rasouli et al. (2017) reported that 90% of the pedestrians in their study gazed at the driver before they crossed the road, especially at unmarked crossings, and Sucha et al. (2017) reported that 84% of pedestrians sought eye contact with the driver at zebra crossings. In a recent on-road study by Schneemann and Gohl (2016) the authors found that, in ambiguous crossing situations in particular, drivers based their behavior mainly on two things: (1) the gaze of the pedestrian and (2) the reaction of the pedestrians in regard to the speed reduction of the driver. The authors concluded that in line with prior studies (e.g. Schmidt & Färber, 2009) mutual eye-contact is important for a successful and hence a safe interaction between pedestrians and drivers.
In a questionnaire survey, Papadimitriou, Lassarre, and Yannis (2017) found two main opposite groups of pedestrian behaviors. Group one with a negative unmotivated attitude and behavior was characterized by high risk-taking and impatience; illegal crossing behavior was not perceived as wrong or unsafe by this group. The second, positive and compliant group, with a strong walking motivation scored higher on risk perception and reported less risk-taking behaviors in the questionnaire. This group usually walked for pleasure and health.
Although open-road settings provide the most realistic situations for studying the effects of vision impairment on drivers’ responses to pedestrians, there are several challenges with little control over the experimental and environmental conditions. The precise location and timing of where and when pedestrians cross the road is likely to vary widely even when driving along a standardized route, and most importantly, safety of both road users is a concern. By comparison, a driving simulator provides a safe, controlled and repeatable test environment. We are not aware of any driving simulator studies investigating interactions between visually impaired drivers and pedestrians. Prior driving simulator studies have evaluated the reactions of visually impaired drivers to pedestrians using paradigms in which drivers responded by pressing the horn whenever they saw a pedestrian (Alberti, Horowitz, Bronstad, & Bowers, 2014; Alberti, Peli, & Bowers, 2014; Bowers, Ananyev, Mandel, Goldstein, & Peli, 2014; Bronstad, Albu, Bowers, Goldstein, & Peli, 2015; Bronstad, Bowers, Albu, Goldstein, & Peli, 2013). Drivers with impaired visual acuity and contrast sensitivity (from macular degeneration) had increased response times compared to normally-sighted drivers (Alberti, Horowitz et al., 2014; Bronstad et al., 2013; Bronstad et al., 2015). However, in real traffic situations, drivers do not just press the horn when they detect pedestrians (or other road users) on a collision course. Both parties negotiate the situation under the given circumstances and regulations – they look at each other, evaluate the other road user’s behaviors and intentions and respond accordingly; i.e., they interact, as discussed previously.
Given this fundamental need for drivers and pedestrians to interact, the current study used a linked driving simulator setting. A pedestrian simulator and a driving simulator were linked so that both the pedestrian and driver could meet and interact within the same virtual environment. This method has successfully been used in different combinations in prior studies investigating mutual behavior adaption processes (i.e. social interaction) among different types of normally-sighted road users for example pedestrians, motorcycles and vehicles, (Hancock & de Ridder, 2003; Lehsing, Benz, & Bengler, 2016; Lehsing, Kracke, & Bengler, 2015; Mühlbacher, Preuk, Lehsing, Will, & Dotzauer, 2017; Will, 2017). The behavior adaption between two individuals takes time; hence, a time series analysis approach was used. This allowed a quantification of the degree of mutual adaption, how long the adaptation took and which road user was dominating the adaption process (Lehsing et al., 2015).
In the current study, we investigated how a mild vision loss comprising reduced visual acuity and reduced contrast sensitivity affected the behavior adaption between a driver and a pedestrian in pedestrian crossing situations with respect to gaze behaviors, driving safety (criticality) measures and social interaction metrics. We were specifically interested in the situation of a person with visual acuity around 20/50, who would likely still be driving. (Visual acuity of 20/50 is just slightly worse than the 20/40 requirement for an unrestricted license in many states and countries). Simulated rather than real vision impairment was used to ensure a relatively homogeneous degree of impairment, which can be difficult to achieve with a heterogeneous sample of people with real vision loss. This approach has been implemented in prior studies investigating the effects of vision loss on closed-road driving performance (Higgins & Wood, 2005), hazard detection in driving videos (Lee, Black, Lacherez, & Wood, 2016) and pedestrian detection in a driving simulator (Swan, Shahin, Albert, Herrmann, & Bowers, 2018).
Our primary hypothesis was that the mild vision loss would delay the initial stage of an interaction (i.e., the first glance toward the pedestrian), which might in turn delay subsequent interactions and behavior modifications such as braking. In addition we evaluated how behaviors differed in interactions with the human-controlled pedestrians (Lehsing et al., 2015; Lehsing & Feldstein, 2017) compared to preprogrammed computer-controlled pedestrians (bots), similar to those used in prior studies of drivers with real vision loss (Alberti, Horowitz et al., 2014; Bronstad et al., 2013). We hypothesized that mutual adaptation would take longer for the human-human than the human-bot interactions and that the mild vision loss might exacerbate differences in mutual adaptation between human-human and human-bot situations.
2. METHOD
The study followed protocols approved by the institutional review board (IRB) at the Schepens Eye Research Institute. The study was conducted in accordance with the tenets of the Declaration of Helsinki.
2.1. Participants
Twenty-four subjects participated (mean age = 31 years, SD = 7 years, 13 female), mainly recruited from a database of people who had previously participated in studies at the Schepens Eye Research Institute. (This was the minimum number of subjects needed to counterbalance all factors across participants.) All had normal or corrected-to-normal vision and were current drivers. They drove on median 5 days per week (IQR = 3 days) and 22.5 miles per week (IQR = 96.8 miles).
2.2. Materials and Apparatus
2.2.1. Simulated vision impairment
Vision loss was simulated by diffusing filters (0.1 opacity Bangerter filters, Fresnel Prism & Lens Co., Eden Prairie, MN) mounted on the back surface of plano carrier lenses in a pair of safety goggles (Guardian Pro Over-The Glass, Safety Glasses USA Inc., Three Rivers, MI). The goggles were worn over the participants’ own glasses if they needed to wear glasses in the simulator. On average visual acuity (Freiburg Acuity Test; Bach, 2007) was reduced from 20/12 (−0.22 ± 0.13 logMAR) without to 20/50 (0.40 ± 0.06 logMAR) with the filter goggles and letter contrast sensitivity (Mars Letter Contrast Sensitivity Test, The Mars Perceptrix Corporation, Chappaqua, NY) was reduced from 1.71 ± 0.07 to 1.49 ± 0.06 log units.
2.2.2. The Driving Simulator
The technical setup consisted of a driving simulator and a control station. The participant sat in a car seat built into a frame construction. The virtual world was displayed on three Samsung CF791 curved monitors mounted next to each other. Each monitor had a screen size of 34” with a 21:9 widescreen ratio, a 3440×1440 resolution and a 4 ms response time. Having a curvature of 1500R, the monitors enabled an immersive experience giving the participant a realistic 180° field-of-view. Participants’ eye movements were tracked by means of a remote Tobii 4C eye tracker1 which allowed subjects to move their head freely. The tracker was installed underneath the center screen (see Figure 1) and tracked at 90 Hz over the full width of that screen, covering the view through the front windshield and the instrument panel. Gazes through the side windows and on the wing mirrors, which were displayed on the outer monitors, were not captured as they were not relevant to the research questions.
Figure 1:
Scene from the driver's point of view through the virtual windshield, with rear view mirror, side view mirrors and a simple dashboard including speedometer and rpm as well as a pedestrian target on the far right of the center screen.
In the simulation, participants drove a mid-range vehicle with automatic transmission. The steering wheel was mounted on a Fanatec ClubSport Wheel Base V2 (Landshut, Germany), consisting of a brushless servomotor with hall sensors on the motor and on the axis. A belt drive mechanism provided a force feedback when driving, creating overall a realistic driving experience. The setup allowed up to 900° steering wheel rotation, which corresponded to the rotation freedom in real cars. For the pedals, a Fanatec ClubSport Pedals V3 was used, though the clutch pedal was dismounted. The accelerator pedal was equipped with contactless and magnetic sensors as well as a vibration motor indicating over steer and rear wheel spin. The scenery was created using the driving simulator software SILAB 5.1 (WIVW GmbH, Würzburg, Germany) which allowed the projection of an immersive driving environment and implementation of realistic vehicle dynamics.
2.2.3. The Pedestrian Simulator
A pedestrian simulator, also running SILAB 5.1 software, was linked to the driving simulator, making it possible to control the behavior of a pedestrian within the virtual world in real time (Lehsing et al., 2016). This human-controlled pedestrian was operated by a trained research assistant who sat at a control station with three screens (two Samsung Model LS34E79CNS/KR and one LG 34UM88C-P) in front of him allowing a 180° view into the virtual world from the perspective of the pedestrian (Figure 2). This set up enabled an evaluation of natural interactions between a pedestrian and driver as they might occur during real-world driving i.e., between the assistant operating the human-controlled pedestrian and the participant driving the virtual vehicle.
Figure 2:
Assistant's point of view at a zebra crossing from the perspective of the intelligent pedestrian waiting to cross the road with the approaching vehicle of the participant on the left (same situation as in Figure 1)
Importantly, the assistant could see neither the participant nor the participant’s view of the road and could only use information from the pedestrian’s perspective. The assistant controlled the movements of this pedestrian by predefined motion patterns launched using buttons on the keyboard, including “head turning” and “walking”, such that the pedestrian behaved and interacted with the participant in the virtual car as a cognisant human being would.
2.2.4. Driving Scenarios, Pedestrian Types and Crossing Situations
The test track consisted of four city (C1-C4) and short rural highway (H1-H4) sections, which were included to relieve participants from possible simulator sickness caused by the city portions of the drive. The city sections included other road users: trucks, cars, motorcycles, pedestrians on the sidewalk and pedestrians that crossed the road. The driver was guided through the cities by an auditory navigation system. Traffic signs at the beginning of the city indicated a speed limit of 25 mph which participants were instructed to maintain. On the highway, participants were allowed to drive at 75mph.
In the four city sections, participants encountered a variety of pedestrian crossing situations which were modelled on the findings of prior studies of driver-pedestrian interactions (Katz et al., 1975; Papadimitriou et al., 2017; Rasouli et al., 2017; Schmidt & Färber, 2009; Sucha et al., 2017). There were two types of crossings: zebra crossings, where it might be expected that a pedestrian would cross, and free lane crossings simulating a situation in which a pedestrian unexpectedly crosses the road at a location not specifically marked as a crossing. The driver had to respond to pedestrians according to the normal rules of the road, which included yielding to pedestrians at the zebra crossings.
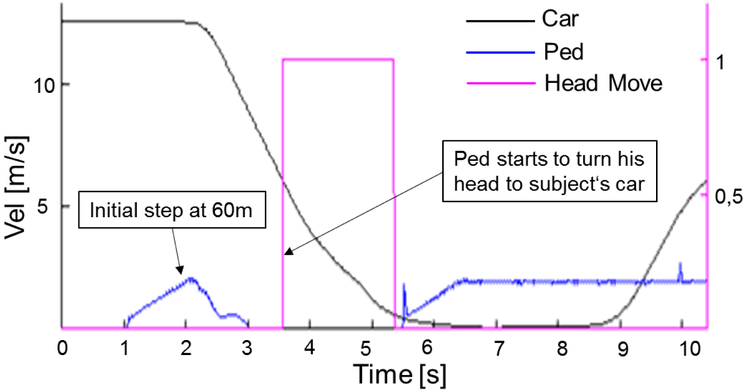
There were two types of pedestrians: preprogrammed, computer controlled pedestrians (bot), similar to those used in prior driving simulator studies to evaluate the effects of vision impairment on pedestrian hazard detection (Alberti, Horowitz et al., 2014; Alberti, Peli et al., 2014; Bronstad et al., 2013; Bronstad et al., 2015) and intelligent, human-controlled pedestrians (ped) (Lehsing et al., 2015; Lehsing et al., 2016), as described above. The bot was controlled by a preprogrammed script which triggered it to start moving when the participant’s vehicle was 46 meters from the predefined crossing point (see Appendix A). After being triggered, the bot ran across the street ahead of the driver without changing speed at 1.6 m/s, slightly faster than the average crossing speed of 1.5 m/s reported for marked and unmarked pedestrian crossings in a real world study (Kotte & Pütz, 2017). Thus the bot simulated a pedestrian totally unaware of the approaching car, similar to the group-one, high-risk-taker pedestrians identified in the questionnaire study by Papadimitriou et al. (2017). The behaviors of the intelligent pedestrians (peds) were controlled by a trained research assistant through the pedestrian simulator. It was always the same assistant who controlled the pedestrian. The assistant activated the ped to start moving always at the same distance (60 m) to the participant’s vehicle (see Appendix B). A standardized crossing behavior was used: the ped first took a step toward the road to signal its intention to cross and then turned its head from side to side as if checking for approaching traffic (according to Rasouli et al., 2017). The ped only started to walk across the road if the assistant believed that it was safe to do so (similar to group 2 of Papadimitriou et al., 2017 or the majority of the pedestrians in the study of Sucha et al., 2017), based on the behavior of the approaching car. Thus, the ped (unlike the bot) was able to interact with the driver and adapt its behavior as necessary with respect to the driving behavior of the participant.
Within each of the four city sections, there were 4 bots and 4 peds that each crossed the road from right to left, with equal numbers of zebra and free-lane crossings. Responses to these pedestrians (32 total across the 4 city sections) were analyzed. To provide variety and reduce the predictability of crossing situations, there were a total of 16 pedestrians crossing from left to right (some free lane and some zebra crossings) that were not analyzed, and other non-crossing pedestrians that either stood at the side of the road or walked along the sidewalk alone or in groups.
2.3. Driving Simulator Procedures
Before driving on the experimental track, subjects completed an acclimatization drive (about 10 minutes). This practice drive included similar traffic situations to those encountered in the main drive. Participants also wore the simulated vision impairment goggles during the acclimatization to become used to the effects of the blurring filter on their vision and driving. After the practice drive, the eye tracker was calibrated in a two-step process. In the first step, the original software of the manufacturer was used to calibrate the system. In step two, the accuracy of the system was measured using a custom-built stimulus array with 9 fixation targets covering the height and width of the center monitor of the driving simulator. Accuracy of the eye tracking at each fixation location was then computed and reviewed before experimental data collection commenced. Over all participants the average accuracy of the eye tracker was 1.8° (SD= 0.3°).
After the eye tracker calibration the participant started the experimental run, which lasted approximately 50 minutes. Two of the city sections were completed while wearing the goggles (vision loss condition) and two without the goggles (normal vision condition). The order of the two conditions was counterbalanced across participants. All drivers took a short break (Figure 3 – location B - solid) at the rest stop after the second city section so that the goggles could be taken off or put on (depending on the order of the conditions). If needed, drivers could also take a break at a highway rest stop between the other city sections (Figure 3 – location B - dashed). The experimental track ended after the last pedestrian crossing at a stop sign.
Figure 3:
Scheme of the test track (S - Start, H1 -Highway 1, C1 - City 1, B (dashed) possible break, B (solid) − planned break on Highway 3, E -End), the order of C1-C4 was counterbalanced across participants.
2.4. Data analyses and performance measures
Data were analyzed for each pedestrian crossing event starting from the time when the participant’s vehicle was 100 m away from the predefined crossing point to the time when the participant’s car passed by the pedestrian. Performance was categorized using three main groups of metrics: gaze measures, driving safety measures and time series measures (social interaction).
2.4.1. Gaze Measures
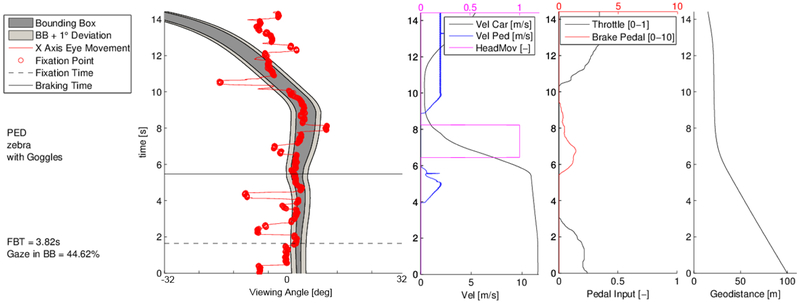
The first group of measures was derived from the recorded gaze data to quantify how simulated vision impairment affected gaze behaviors that might in turn affect interactions with the pedestrians. To better understand gaze behaviors with respect to the pedestrian, lateral gaze position and lateral pedestrian position were plotted as a function of time for each event (see Figure 4). The velocity profiles of the car and pedestrian, the head turn signal of the pedestrian, the geo-distance between the two entities, and accelerator and brake pedal use were also plotted alongside to fully capture the interactions (see Figure 4). Three measures were used to quantify gaze behaviors: 1) The time from the start of the event to the first fixation on the pedestrian (Time-to-First-Fixation); 2) The time between the first fixation and the braking response, if braking occurred (Fixation-to-Braking-Time, FBT); and 3) The proportion of time for which gaze was on the pedestrian (computed as the proportion of the total time for the event). Eye-movement data points were classified as fixations when the driver's gaze was within a 17 pixel distance on the simulator's monitor to the previous data point and was below this threshold for a duration of over 100 ms (Salvucci & Goldberg, 2000). A digital bounding box, 1° larger than the pedestrian’s dimensions in the simulation, was placed around the pedestrian. Gaze was considered to be on the pedestrian if it fell within this bounding box (Figure 4 light grey area).
Figure 4:
Gaze behavior for one subject for a human-controlled pedestrian event where the pedestrian appeared on the right at a zebra crossing in the normal vision (without goggles) condition; Left: gaze (red filled circles = fixations) in regard to the bounding box around the pedestrian (grey zone); Right: corresponding vehicle and pedestrian dynamics in the crossing situation to link driving with gaze behavior - velocity of car and pedestrian, accelerator/brake pedal use and geodistance between them. The first fixation on the pedestrian occurred soon after the start of the event (at 1.7 s) after which the subject fixated the pedestrian (red circles within the pedestrian bounding box) almost continuously (with just a few glances away) until the pedestrian had crossed to the far side of the road (at about 12s). The pedestrian made his first step toward the road at 4.0 s and turned its head towards the driver at 6.5 s. The brake pedal was first applied at 5.5 s, suggesting that the driver interpreted the step toward the road as signaling the intention to cross. The time from the first fixation to the brake pedal use (FBT) was 3.8 s. Around 10 s the driver started to accelerate again once the pedestrian had safely crossed the driver’s lane.
2.4.2. Classical Driving Safety Measures
Driving safety measures included Time-To-Collision (TTC), Post-Encroachment-Time (PET) and Deceleration-to-Safety-Time (DST), three of the most well-known metrics to assess the criticality of traffic conflicts (Hupfer, 1997; Kraay, J.H. Horst, A.R.A. van der & Oppe, S., 1986; Laureshyn, Svensson, & Hydén, 2010; van der Horst, A. R. A. & Hogema, 1993). See Appendices C - E for formulas and graphical visualization.
In the current study, the minimum TTC (TTC_min) was calculated, providing a measure of the severity (criticality) of a potential traffic conflict (Laureshyn et al., 2010; van der Horst, 1990). TTC less than 1.5 s was considered critical (van der Horst, 1984). For situations where the TTC cannot be computed, the PET can help to assess traffic conflict by determining the time span between the first road user leaving the conflict zone and the second conflict partner entering this area. PETs smaller than 1 s were considered as serious conflicts (Hupfer, 1997; Kraay, van der Horst, & Oppe, 2013). Finally, the DST measure quantified the effort (i.e. the deceleration) the driver had to apply to ensure a specific safety margin (safety time) between the point in time when the first road user (pedestrian) left the conflict area and the second road user (driver) entered this area (see Appendix E for formulas); the higher the DST, the more critical the situation.
2.4.3. Time Series Analysis
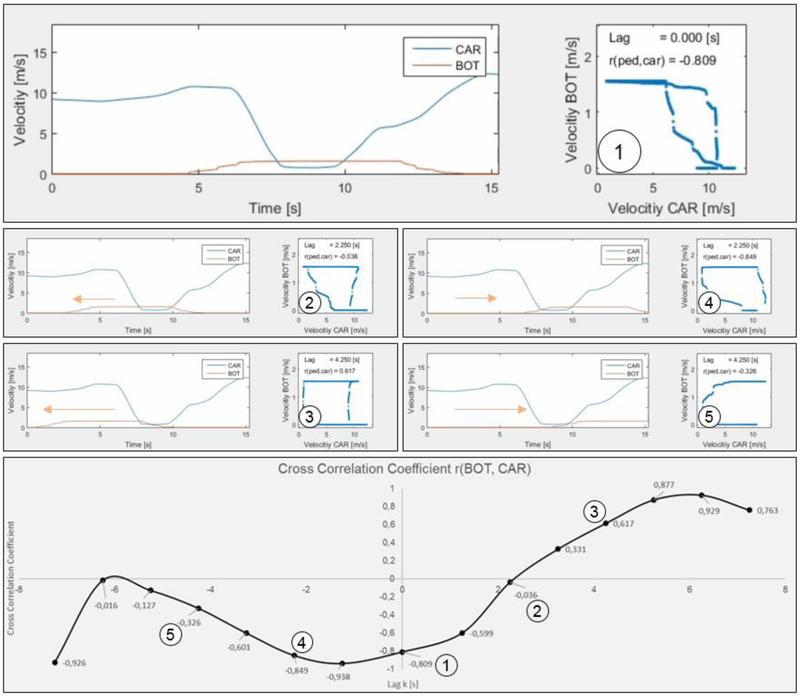
As the interaction between road users is fundamentally a time-related process to avoid or at least decrease the impact of critical situations, time series analysis methods have to be used in addition to classical safety measures to adequately reveal potentially underlying factors that contribute to the criticality of a situation. Thus the third group of measures was based on a time-series analysis involving cross correlations to quantify the interactions between driver and pedestrians (see Figure 5). The speed signals of the interaction partners (car and pedestrian) were shifted against each other (time shift = lag, for half of the signal length in both positive and negative directions) in order to obtain the highest correlation (Pearson’s r - Field, Miles, & Field, 2014).
Figure 5:
Time-series analysis. The speed signals of the road users (Car and PED or BOT) are the basis of the cross correlation in the respective crossing situations. The figure shows the data for one subject in one crossing situation. Upper chart①: The two speed signals of the subject's car and the pedestrian (BOT), not shifted against each other (Lag = 0 s). Middle left charts ② and ③: plots with positive Lag = 2.25 s and 4.25 s and corresponding correlation (r = −0.36 and r = 0.617). Middle right charts ④ and ⑤: the same two speed signals shifted negatively against each other for 2.25 s and 4.25 s with r= −0.849 and r = −0.326. Lower chart: Complete cross correlation graph for selected Lags and correlations with the highest (negative) value for r (−0.938) at around −1 s.
The formula used to compute the Pearson correlation between the two signals is the following, where X and Y are the velocity signals of the two road users (car and pedestrian, respectively):
| (1) |
The cross correlation coefficient (CCC) describes the relationship between the two road users as values between −1 (perfect negative correlation; i.e. the behavior of both road users is contrary: e.g. one brakes while the other accelerates) and +1 (perfect positive correlation; i.e. both road users are doing exactly the same: e.g. both accelerate). If the correlation is zero, there is no relationship between the speed signals (i.e. the behavior) of the conflict partners (e.g. one stops and the other one keeps on driving). Both measures, CCC and Lag, contribute to the understanding of traffic conflict and were already successfully used in a prior study (Lehsing et al., 2015). The CCC shows the extent of the mutual adaption between driver and pedestrian. The lag can be interpreted as the necessary amount of time that is needed to reach the peak in the behavior adaption (CCC) and is the time the less dominant road user needs to adapt his behavior to that of the more dominant road user during the crossings (Lehsing et al., 2015).
3. RESULTS
The results section is divided into gaze, driving and time series measures. Where appropriate a pirate plot (Phillips, 2017) is used to visualize the data that went into the analysis and descriptive statistics (mean, standard deviation and distribution of the data). To evaluate the effects of the three fixed factors eyewear (goggles vs. no goggles), type of crossing (zebra crossing vs. free lane) and type of pedestrian (bot vs. ped) on the gaze, driving and time series measures, we constructed a series of Linear Mixed Models (LMM) in R Studio v1.0.143 (R Core Team, 2017). To account for individual differences, we entered subject as a random effect structure. P-values for any interactions between the three fixed factors were calculated by means of model comparisons. For each interaction, we compared a baseline model (with all interactions between the fixed factors removed) with the same model plus the interaction of interest by means of analyses of variance (ANOVAs). The resulting X2 values represented the significance of the interaction of interest.
3.1. Gaze Measures
3.1.1. Time-to-First-Fixation
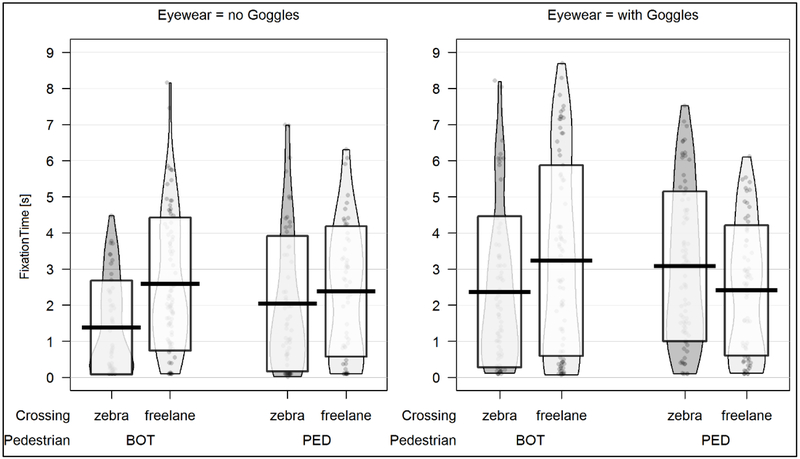
The time to the first fixation was the time from the start of the crossing situation to the first fixation on the pedestrian. Overall (see Figure 6), drivers were significantly faster in making their first fixation on the pedestrian at zebra than freelane crossings (β = − 0.218; SE = 0.087; t = −2.504; p = 0.013) but significantly slower in making their first fixation on the pedestrian with than without the goggles (β = −0.338; SE = 0.087; t = − 3.876; p < 0.001). Although the type of pedestrian had no effect on the time to first fixation, the interaction between crossing and pedestrian was significant (χ2 (6, 7) = 12.766; p < 0.001). Specifically, the difference between zebra and freelane was greater for the bot than the ped situations.
Figure 6:
Pirate plot for Time-to-First-Fixation (thick black lines represents the mean, vertical boxes represent ± 1 SD, pirate patch shows distribution of data)
3.1.2. Fixation-to-Braking-Time
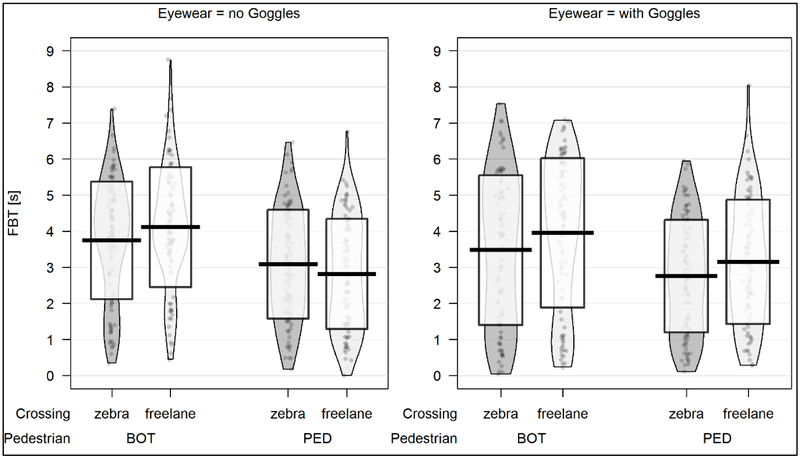
Fixation to braking time (FBT) was computed as the time between the first fixation on the pedestrian and the time when the brake was first applied (when used). Fixation-to-Braking-Times were significantly longer for bots than peds (β = 0.436; SE = 0.064; t = 6.767; p < 0.001) (Figure 7). However, there were no significant effects of either crossing type or wearing goggles on braking times.
Figure 7:
Pirate plot for Fixation-to-Braking-Time
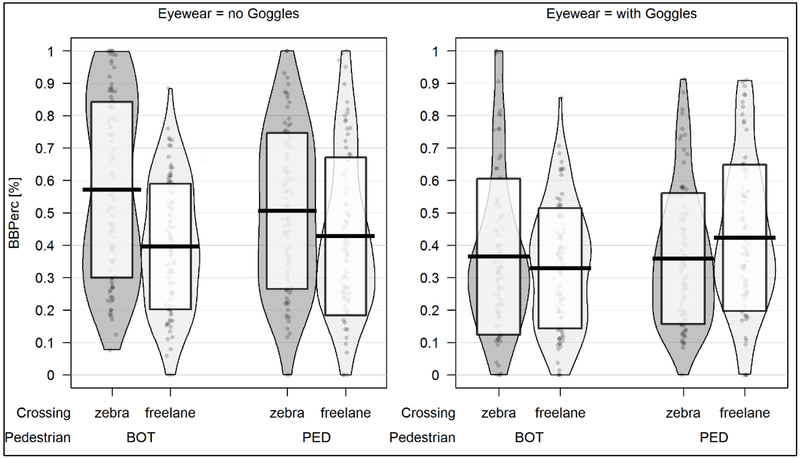
3.1.3. Gaze in Bounding Box
The amount of time for which the driver looked at the pedestrian was computed for each of the crossing situations. As the pedestrian was a moving object in the simulation, a bounding box which included the pedestrian avatar was digitally placed around the pedestrian and the time for which gaze was on the pedestrian was computed. The duration of each event varied across participants dependent on the velocity at which they were driving. In order to account for this, the time for which gaze was in the pedestrian bounding box was expressed as a proportion of the total time for each event. The type of pedestrian had no effect on this gaze metric. The factor eyewear on the other hand showed a highly significant effect (β = 0.053; SE = 0.008; t = 6.449; p < 0.001). The factor crossing had a significant effect, too (β = 0.028; SE = 0.008; t = 3.384; p < 0.001). Overall, participants spent a greater proportion of time looking at the pedestrian without than with the goggles and spent a larger proportion of time looking at the pedestrian in the zebra as compared to the freelane crossing situations (Figure 8). However, there was a significant interaction between the factors eyewear and crossing that prevents a single interpretation of the effects (χ2 (6, 7) = 17.544; p < 0.001). Specifically, when not wearing the goggles, there was a clear difference in the proportion of time looking at the pedestrian between freelane and zebra crossings; however, this difference was either much reduced or even slightly in the opposite direction when wearing the goggles.
Figure 8:
Pirate plot for proportion of time gaze was in the pedestrian bounding box
3.2. Driving Safety Measures
3.2.1. Time-To-Collision
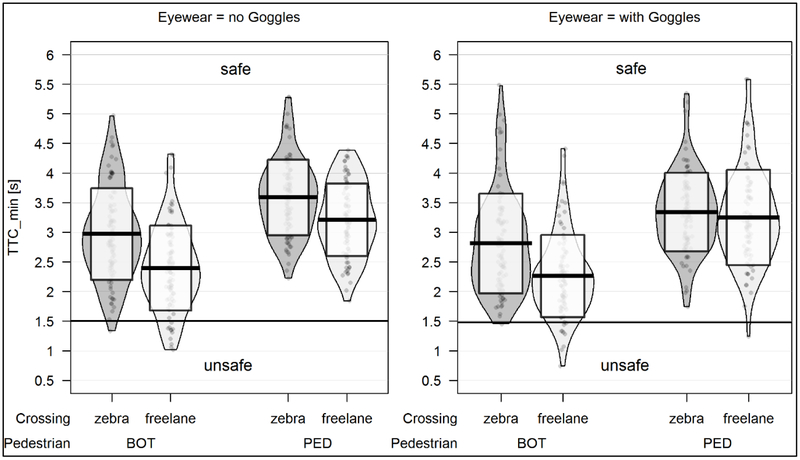
There were significant main effects of all three factors. The TTC_min was significantly smaller (less safe) in bot situations (β = −0.363; SE = 0.024; t = −15.281; p < 0.001). The goggles also significantly reduced the TTC_min (β = 0.062; SE = 0.024; t = 2.618; p = 0.009) as well as the type of crossing (β = 0.205; SE = 0.024; t = 8.645; p < 0.001), where zebra crossings had higher TTC_mins and were less critical. The lowest TTC_min was observed in bot, freelane situations with goggles (see Figure 9, TTC_min = 2.26 s) but compared to literature (van der Horst, 1984) the vast majority of those crossings were not critical (TTCcrit < 1.5 s). Of the bot freelane events, only 10% with goggles and 10% without goggles resulted in TTC_mins below the critical threshold.
Figure 9:
Pirate plot for minimum Time-To-Collision (line indicates safety threshold)
3.2.2. Post-Encroachment-Time
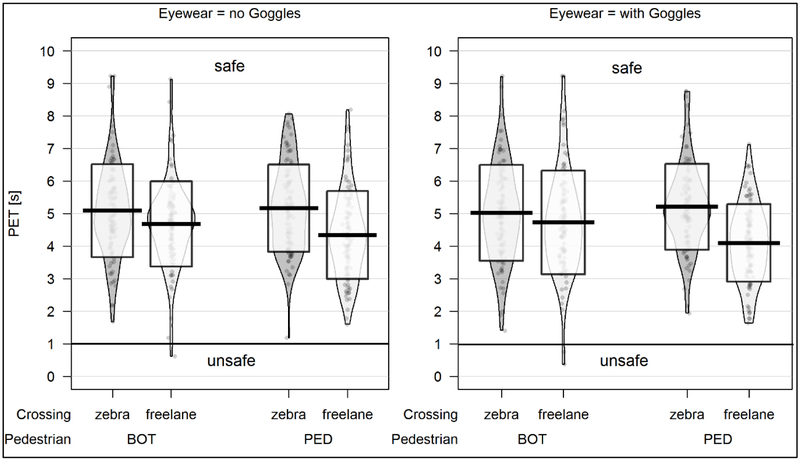
There were significant main effects of crossing and pedestrian but not goggles on PET. The PETs for the freelane situations were always smaller (less safe) than those for the zebra crossings (Figure 10) (β = 0.330; SE = 0.039; t = 8.388; p < 0.001). The differences between bot and ped were significant (β = 0.089; SE = 0.039; t = 2.263; p = 0.0239) with smaller (less safe) PETs for bots. The interaction between pedestrian and crossing was also significant (χ2 (6, 7) = 15.235; p < 0.001) indicating that the difference in PET between the crossing types was greater for peds than bots. An interesting finding was the lowest average PET (4.1s) in the condition with a human-controlled pedestrian (ped) in a freelane crossing while wearing the goggles (Figure 10). However, in comparison to the literature (Kraay et al., 2013) the average PETs for each condition in this study were not critical (PETcrit < 1s). Only 1.5% of the events (1 in bot freelane without the goggles and 2 events in bot freelane with the goggles) showed PETs below that threshold.
Figure 10:
Pirate plot for Post-Encroachment-Time
3.2.3. Deceleration-to-Safety-Time
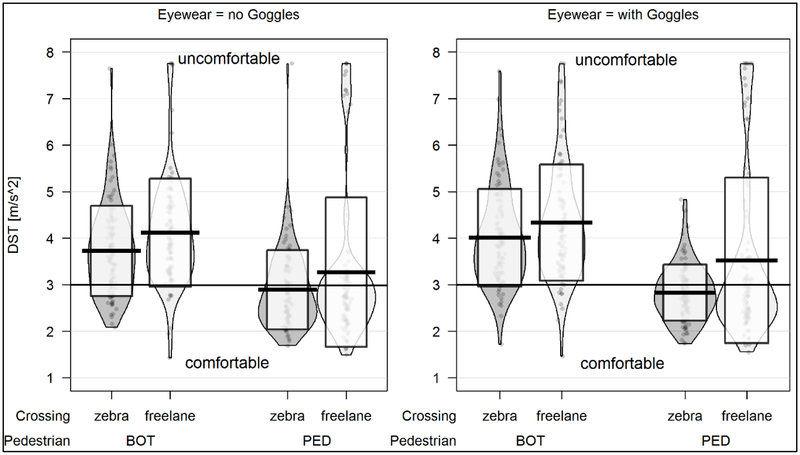
The DST was computed for each event based on a safety margin of 3 s (representing the PET (Kotte & Pütz, 2017)) where the DST was the deceleration that the driver needed to apply to ensure that safety time. There were highly significant main effects of both pedestrian (β = 0.450; SE = 0.041; t= 11.171; p < 0.001) and crossing (β = − 0.223; SE = 0.041; t = −5.427; p < 0.001) on the DST. Deceleration rates were higher (less safe) for bots than peds and slightly higher for freelane than zebra crossings (Figure 11). Wearing the blurring goggles also significantly increased deceleration rates (β = −0.086; SE = 0.041; t = −2.079; p = 0.038). Additionally, the average DST for peds, especially at zebra crossings (with and without the goggles), was in comparison to literature (Schroeder, 2008) comfortable, for freelane crossing slightly above. In contrast, bot crossings show on average more uncomfortable deceleration rates.
Figure 11:
Pirate plot for Deceleration-to-Safety-Time
3.3. Time Series Analyses
3.3.1. Cross Correlation Coefficient
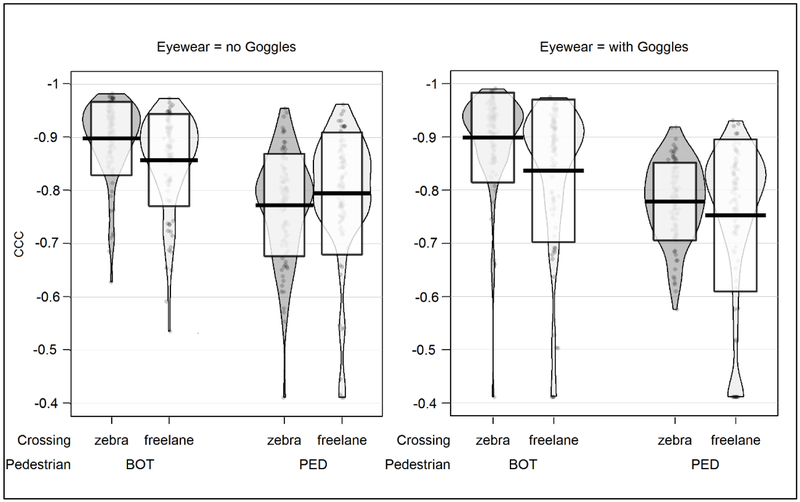
For bot situations, the range of the CCC was between −.84 and −.90 and for ped situations between −.75 and −.80 (Figure 12). Both the type of pedestrian (β = −0.049; SE = 0.004; t = −13.540; p < 0.001) and type of crossing (β = −0.013; SE = 0.004; t = − 3.706; p < 0.001) had significant effects on the CCCs. Specifically, the velocities of the driver and pedestrian were more highly correlated for bots than peds and for zebra than freelane crossings. There was a significant interaction between crossing and pedestrian suggesting that the differences between zebra and freelane crossings were greater for bot than ped situations (χ2 (6, 7) = 11.609; p < 0.001). Finally, the goggles had a significant effect (β = −0.007; SE = 0.004; t = −1.988; p = 0.047) with correlation coefficients that were slightly lower when wearing the blurring goggles (Figure 12).
Figure 12:
Pirate plot for Cross Correlation Coefficient (CCC)
3.3.2. Corresponding Lags
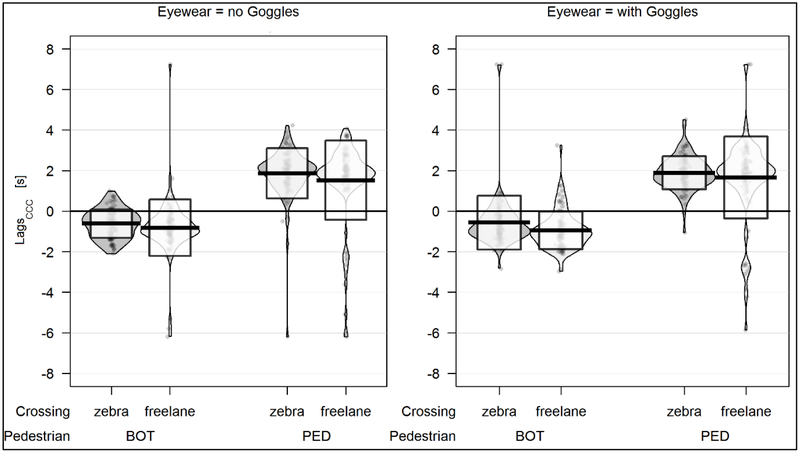
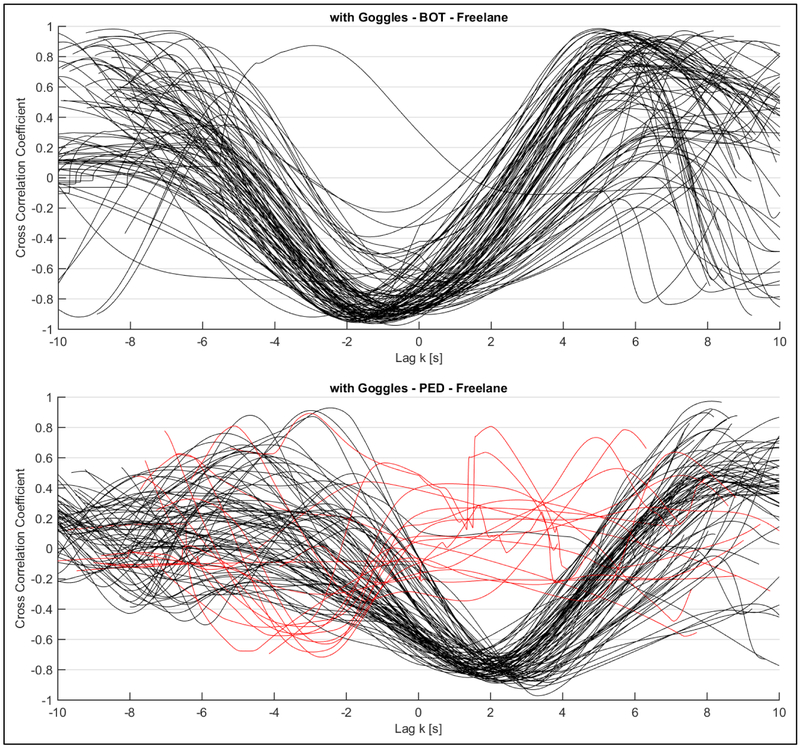
The corresponding lag is the necessary time shift of the two velocity signals of the two road users to get the maximum CCC. One time series is fixed (car) and the other time series (pedestrian) is shifted against the other for half of its length in the positive and negative direction (see Figure 5). It can be interpreted as the time one road user needs to adapt to the behavior of the dominant user in a bilateral traffic situation. In the current study, the strongest factor was the type of pedestrian that crossed the road (β = −1.235; SE = 0.048; t = −25.614; p < 0.001). There was also a significant effect of crossing type (β = 0.145; SE = 0.048; t = 3.015; p = 0.003); however, no effects of the goggles were observed (Figure 13). The most obvious finding for the lag was the fact that all bot situations resulted in a negative lag whereas the ped situations produced a positive lag (see example in Figure 14). Thus, in bot situations, the bot was the dominant road user leading the time series and the driver reacted to its behavior. In contrast, in the human-human traffic situation (driver vs. human controlled pedestrian) the car was the dominant road user and led the series (visualized in two example conditions in Figure 14). The other noteworthy difference is that the lags were longer for the human-human interaction than the human-bot interaction.
Figure 13:
Pirate plot for Corresponding Lag
Figure 14:
Functional relation between Cross Correlation Coefficient CCC and Lag for freelane crossing situations while driving with the blurring goggles. Upper plot: all freelane encounters between computer-controlled pedestrians (bots) and participants. Lower plot: all encounters between human-controlled pedestrians (peds) and participants. Each line represents data for one encounter for one participant. Red lines in the lower graph represent situations where the driver did not yield to the pedestrian
4. DISCUSSION
In this study the effect of simulated mild vision impairment on interactions between drivers and pedestrians was investigated within the safe environment of a driving simulator. The level of vision impairment (20/50) was just slightly worse than the 20/40 visual acuity required for an unrestricted license in many states and countries. The goal was to simulate a level of vision impairment at which a person with mild vision impairment (mildly reduced visual acuity and contrast sensitivity e.g., from developing cataracts) might still be driving. A novel aspect of the study was the use of a human-controlled pedestrian which enabled naturalistic human-to-human interaction behaviors between the participant driving the virtual vehicle and the trained assistant operating the pedestrian to be investigated and compared to interactions with computer-controlled bot pedestrians.
4.1. Gaze Data
The simulated vision loss significantly increased the time it took for participants to make their first fixation on the pedestrian. This delay in first noticing the pedestrian was likely related to the fact that the diffusing filters reduced contrast sensitivity as well as visual acuity (Swan et al., 2018) and the simulation affected peripheral as well as central vision (the diffusing filters were placed across the full extent of the goggle lenses). Peripheral vision can act as an early warning system which helps guide eye movements (Yamamoto & Philbeck, 2013). Thus one possible explanation for our results is that the simulated vision impairment reduced the visibility of the pedestrian in peripheral vision thereby delaying peripheral detection and the first eye movement toward the pedestrian. As a consequence of the delay in making the first fixation, the proportion of time spent looking at the pedestrian (bounding box) was also significantly reduced when driving with the vision impairment.
By comparison, the Fixation-to-Braking-Time was not affected by the simulated vision impairment. Once the driver fixated the pedestrian using their central vision, the mild level of vision impairment did not delay recognition of the pedestrian as a potential hazard and initiation of the braking response (fixate→if hazard: brake) was not affected. Thus our results suggest that the processing of features in peripheral vision to find the pedestrian were more affected by the simulated vision impairment than the processing of features in central vision required to determine the intention of the pedestrian to cross the road.
In a recent study, Lee et al. (2016) tracked eye movements while normally-sighted participants performed a video-based hazard detection task. Consistent with our results, they also found an increase in the time to the first fixation on a hazard for young participants (mean 27 years) when their vision was blurred (+2.00 D lenses) to 20/70 on average. To our knowledge, no studies have quantified whether real vision loss impairs the time to the first fixation on a hazard and/or the time from first fixation to the initiation of a response. In prior simulator studies (Bronstad et al., 2013; Bronstad et al., 2015), drivers with real vision loss (reduced acuity and contrast sensitivity) had longer reaction times than normally-sighted drivers, but a detailed analysis of gaze movements was not conducted.
It is interesting to note that the gaze metrics were sensitive to the different crossing types as well as the simulated vision impairment. Participants were quicker to make their first fixation on pedestrians at zebra than free lane crossings and spent a greater proportion of time looking at them, suggesting that prior expectations about pedestrian behaviors (that they might cross at a zebra crossing) influenced gaze behaviors. However, the effects of crossing type on the proportion of time spent looking at the pedestrian was reduced when wearing the blurring goggles, suggesting that the simulated vision impairment may have made it more difficult to notice the zebra crossing (markings on the road and sign) as well as more difficult to detect the pedestrian.
In the current study, the human-controlled pedestrian always looked toward the approaching driver, and the driver always fixated upon the pedestrian. By comparison, in their observational study of pedestrian-driver interactions in real-world situations, Sucha et al. (2017) reported that 84% of pedestrians sought to make eye-contact with the approaching driver but only 34% of drivers tried to make eye-contact with the pedestrian. Thus the behavior of our human-controlled pedestrian was highly consistent with real-world pedestrians, but the behavior of our drivers seems to differ from those in the real world. One important methodological difference between the two studies should be considered. In the study by Sucha et al., observers stood near pedestrian crossings and looked for “evident and intended eye contact”; however, the eye position of the driver was not recorded and the driver might have been more likely to look at other parts of the body to infer the intention to cross. It would have been difficult for the observers to see the eye positions of the approaching driver when they were some distance away from the car so they most likely relied on head position rather than eye position to infer intention to make eye contact. Hence, it is quite possible that a higher percentage of drivers looked toward the pedestrian than was observed, especially if gaze toward the pedestrian involved only an eye movement by the driver and not a head movement. A recent driving simulator study reported that eye movements (without accompanying head movements) occur much more frequently when driving than eye movements with head movements (Savage, Zhang, Swan, & Bowers, 2019). By comparison to the observational study of Sucha et al, in the current study eye position was tracked so we captured every fixation on every pedestrian.
4.2. Driving Safety Data
The driving safety measures (TTC, PET, DST) are typically indicators of how critical a situation is in which two road users are on a collision course and no avoiding action (slow down, brake, swerve) is performed. In this study the crossing situations were on average safe. As might be expected, situations with the human-controlled pedestrians were generally safer than with the bot pedestrians and zebra crossings were safer (Katz et al., 1975) than free lane crossings (for both types of pedestrians). However, although most interactions were safe, the raw data in the respective plots (TTC_min Figure 9 and PET Figure 10) shows that a few situations were critical. In particular, the situations with the preprogrammed bot pedestrians resulted in TTC less than 1.5 s. These situations also resulted in higher DSTs, above 3 m/s2 (Figure 11), which are experienced as uncomfortable by drivers (Schroeder, 2008). The simulated vision impairment intensified the criticality in the crossings but compared to Kotte and Pütz (2017) who reported an average PET of 3 s, the crossings in this study were safer (average PET 4.76 s with simulated vision impairment). We found only 1 out of 95 situations where the driver did not yield to a pedestrian at a zebra crossing (a situation with the human-controlled ped and a driver without the goggles). In contrast, in the real-world observational study of pedestrian-driver interactions by Sucha et al. (2017), 36% of the drivers did not yield to pedestrians at a zebra crossing. This difference is likely because drivers in the Sucha et al. study did not know that their driving behaviors were being observed whereas in the current study participants were obviously aware that their behaviors were being recorded and there were signs at the start of every city reminding them to yield to pedestrians at crossings.
4.3. Linear Time Series Measures
A time series approach, usually applied to economic (Tsay, 2005), climate (Mudelsee, 2014), medical (Pincus & Goldberger, 1994) or macro traffic data (Ghosh, Basu, & O'Mahony, 2009), was used to examine the behavior adaption processes between the two road users involved in the crossings. The cross correlation coefficient (CCC) quantifies the extent of the mutual adaption and showed a less perfect adaption for the human-human than the human-bot interactions in the simulated crossings. One reason to account for this may be that the behavior does not need to be perfectly adapted but only enough to solve the respective traffic situation in a safe way.
The mutual adaptation in the human-human interaction took longer than in the one-sided human-bot interaction where the bot crossed the road without paying attention to other road users and it was the participant who was forced to modify his driving accordingly. This was quantified by the lag (time shift) between the two signals to gain the maximum CCC. Here the absolute amount among the bot situations was on average between .56 s and .96 s whereas the adaption between the human road users took between 1.52 s and 1.88 s. As expected, the bot was the dominant road user in the human-bot interactions, but the car driver was the dominant road user in the human-human interactions. This was clearly demonstrated by the different directions of the lags (negative in human-bot interactions and positive in human-human interactions; Figure 13). Consistent with the on road study of Katz et al. (1975) where the driver behavior was found to be the dominant one in the interaction, we also found that the driver was the dominant road user in the situations with the human-controlled pedestrian.
The simulated vision impairment had no noteworthy effects on the time-series measures. The dominance of the preprogrammed pedestrian, once detected, resulted in the same behavior adaptation by participants as when vision was unimpaired. The same was true for the passive and safety-oriented behavior of the human-controlled pedestrian. One of the fundamental prerequisites of interhuman (social) interaction is that it depends on externally visible cues to be triggered. Our results suggest that although vision was impaired in the current study, it was not severe enough to modify interactions with the pedestrians once they were detected. We anticipate that a more severe level of vision impairment would have a greater effect on the time series measures. In the extreme case, where a visually impaired driver might not even see a pedestrian, we would expect the CCC between the bot and the driver to approximate zero (r ~ 0) such that a corresponding lag could not be calculated (no perception→no interaction→no correlation).
Compared to a prior study with normally sighted young drivers (mean age 24.2 years), the results for the CCCs and the lags of the current study show similar trends with negative lags for preprogrammed bots, positive lags for human-controlled pedestrians, as well as higher correlations and shorter lags for human-bot encounters (Lehsing et al., 2015)
4.4. Methodological considerations
Although all independent variables were counterbalanced over the experimental track, the relatively large number of pedestrian crossings might have influenced driving behavior. Participants could have become more alert to pedestrian crossings than might be the case in real traffic. To avoid this, distracting pedestrians that looked alike but did not cross were placed along the sidewalk.
While simulating vision impairment has the advantage of creating a relatively homogenous level of vision loss, it does not capture all aspects of real vision impairment. For example, people with real vision impairment will have had time to adapt to their impairment whereas the participants in this study had only about 10 minutes experience with the vision loss before completing the experimental drives. Thus we might overestimate the effects of the vision impairment.
In the current study, only young participants were included. However, older drivers are more likely to have mild vision impairment than younger drivers e.g., from age-related eye diseases such as early cataracts or age-related macular degeneration. It might be expected that vision loss would have a greater effect on gaze behaviors and driving performance of older than younger drivers (e.g. due to slower motor responses and/or a smaller cognitive resource pool).
Driving simulators provide a safe, controlled environment for evaluation of the effects of vision impairment on driving; however, they have been criticized for lack of external validity (Fisher, Rizzo, Caird, & Lee, 2011; Godley, Triggs, & Fildes, 2002; Kaptein, Theeuwes, & van der Horst, 1996; Owsley, Wood, & McGwin, 2015; Yan, Abdel-Aty, Radwan, Wang, & Chilakapati, 2008). We partly addressed this concern by using a linked-simulator setting that enabled human-human interaction between the driver and the assistant that controlled the intelligent pedestrian via the pedestrian simulator (see Figure 2). Both could see their representation (i.e. the pedestrian avatar and the vehicle the subject was controlling) in the crossing situations. And in contrast to a single simulator setting where the surrounding traffic is preprogrammed, both road users in our setting were able to mutually adapt their behavior. They were able to observe the actions and corresponding reactions (i.e. slowing down, accelerating, making a step, turning one’s head) of the other and adapt their own. This can be considered a much more natural, externally more valid, paradigm than used in prior simulator studies investigating the effects of real vision loss on pedestrian detection, where subjects were only required to press the horn upon detection of pre-programmed bot pedestrians (Alberti, Horowitz et al., 2014; Bronstad et al., 2013; Bronstad et al., 2015).
5. CONCLUSION
Simulated vision impairment of about 20/50 Snellen visual acuity was found to significantly affect gaze behaviors in pedestrian crossing situations. When vision was impaired, participants were slower to make their first fixation on the pedestrian and spent a smaller proportion of time looking at it. However, the time from the first fixation to the application of the brake was not affected by the simulated vision impairment. Similarly, there was only a slight adverse effect of the vision impairment on the interaction measures and the criticality of the situations. In the vast majority of cases, the responses of the drivers would have been classified as safe even with the vision impairment. These results suggest that vision loss, just below the legal requirement for driving, might have only mild adverse consequences for driving safety in pedestrian crossing situations. However, a follow up study with more severe levels of simulated vision impairment is needed.
The handling of the linked simulator setting was more complex than with a single simulator and technically challenging in ensuring smooth operation of the simulation on six screens. Furthermore implementation of the behavior of the human-controlled pedestrian was not straightforward. Care had to be taken to ensure that there was standardization of the first stage of the behavior (i.e., the timing of the first step and head turn) while allowing natural interactions in the second stage (deciding when it was safe to cross the road based on the driving behavior of the participant). Finally, the goal of characterizing interaction behaviors required a data analysis that was sensitive enough to detect differences between our conditions (bot vs. ped, zebra vs. freelane, goggles vs. no goggles) and to operationalize human traffic behavior. Our results suggest that our methodology is robust and provides a promising approach for future studies investigating interactions between drivers with real vision impairment and other road users.
HIGHLIGHTS.
Visual impairment increased the time to the first fixation on a pedestrian
Visual impairment did not affect the time from first fixation to pressing the brake
Classical driving safety measures showed on average safe crossing situations
Interaction measures revealed significant effects of pedestrian type
Time series analysis quantified behavior adaption between two road users
ACKNOWLEDGMENTS
The authors would like to thank the following companies that donated important parts of the simulator: BMW AG (seat), Bosch Rexroth (aluminum parts) and Samsung (monitors). In addition, Fanatec and Tobii supported the study by providing their high quality products at a reduced cost. SILAB GmbH provided a free software license for the preparation and conduct of the study. Without the aforementioned support, this study would have not been possible. Also supported in part by National Institutes of Health grant R01-EY025677 (ARB).
APPENDICES
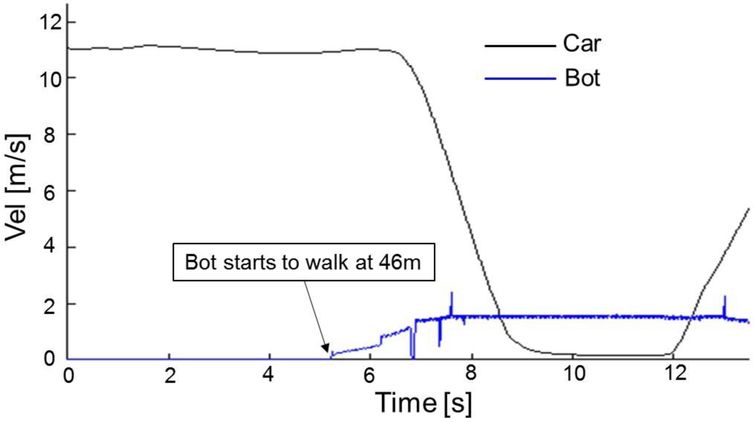
A). Walking scheme example of programmed pedestrian (Bot)
Figure A-1:
Velocity-Time graph for human bot encounter. In this example the subject brakes after the bot starts to cross the road at a distance of 46m to the subject.
B). Walking scheme example of intelligent pedestrian (Ped)
Figure B-1:
Velocity-Time graph for human-human encounter. In this example the subject starts to brake as soon as the ped takes a step toward the road. The ped does not start to cross the road until after looking at the subject’s car to make sure that it is safe to cross the road.
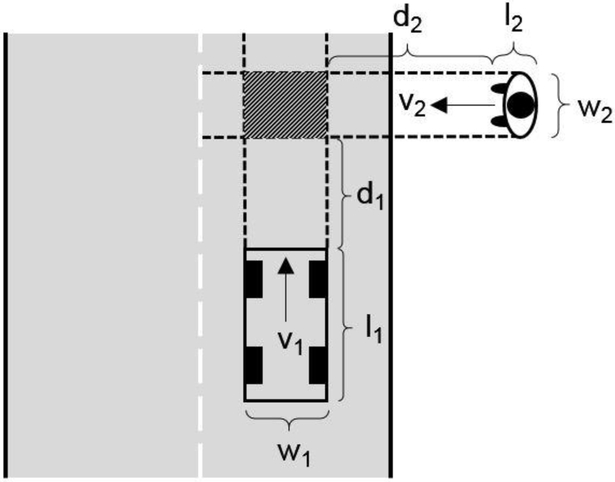
C). Time-To-Collision: scheme and relevant variables
Figure C-1:
Pedestrian crossing situation with TTC variables and conflict zone (textured rectangle)
The formula used to compute the TTC (if both conflict partners are on a collision course) for road user 1 is as follows:
| (2) |
For the second user it is:
| (3) |
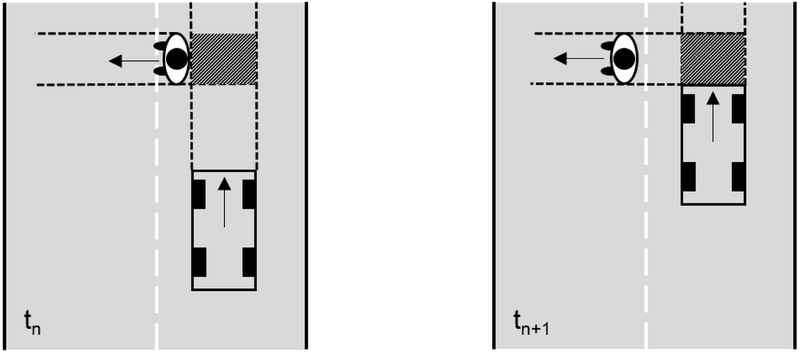
D). Post-Encroachment-Time: Scheme and relevant variable
Figure D-1:
Pedestrian crossing situation with PET variables and conflict zone (textured rectangle)
The formula to compute the PET is:
| (4) |
E). Deceleration to Safety Time DST
This measure quantifies the effort (i.e. the deceleration) one road user has to apply to ensure a safety time between the point in time the first road user (index f) leaves the conflict area and the second road user (index s) enters this area after the safety time tDSTx. X in this case indicates the time in seconds that needs to be added after the first road users just left the conflict zone and is similar to the post encroachment time PET. SDST, VTf is the distance of the first road user to the conflict zone, vVTf, 0 its velocity the current velocity. Solving the equations for the questioned deceleration DSTx produces formula 5-7. The formula used to compute the DST:
| (5) |
| (6) |
| (7) |
Footnotes
Publisher's Disclaimer: This is a PDF file of an unedited manuscript that has been accepted for publication. As a service to our customers we are providing this early version of the manuscript. The manuscript will undergo copyediting, typesetting, and review of the resulting proof before it is published in its final citable form. Please note that during the production process errors may be discovered which could affect the content, and all legal disclaimers that apply to the journal pertain.
Tobii Eye Tracker 4C leveraged for the purpose of this study via special Tobii Pro End User License Agreement and permission for analytical use. For more information, visit: http://www.tobiipro.com
Contributor Information
Christian Lehsing, Chair of Ergonomics, Technical University of Munich, Munich.
Florian Ruch, Technical University of Munich, Munich.
Felix M. Kölsch, Technical University of Munich, Munich
Georg N. Dyszak, Technical University of Munich, Munich
Christian Haag, Technical University of Munich, Munich.
Ilja T. Feldstein, Chair of Ergonomics, Technical University of Munich, Munich
Steven W. Savage, Schepens Eye Research Institute of Massachusetts Eye and Ear, Harvard Medical School, Boston, MA
Alex R. Bowers, Schepens Eye Research Institute of Massachusetts Eye and Ear, Harvard Medical School, Boston, MA
References
- Alberti CF, Peli E, & Bowers AR (2014). Driving with hemianopia: III. Detection of stationary and approaching pedestrians in a simulator. Investigative Ophthalmology & Visual Science, 55(1), 368–374. [DOI] [PMC free article] [PubMed] [Google Scholar]
- Alberti CF, Horowitz T, Bronstad PM, & Bowers AR (2014). Visual attention measures predict pedestrian detection in central field loss: A pilot study. Plos One, 9(2), e89381 10.1371/journal.pone.0089381 [DOI] [PMC free article] [PubMed] [Google Scholar]
- Bach M (2007). The Freiburg Visual Acuity Test-variability unchanged by post-hoc reanalysis. Graefe's Archive for Clinical and Experimental Ophthalmology = Albrecht Von Graefes Archiv Fur Klinische Und Experimentelle Ophthalmologie, 245(7), 965–971. https://doi.Org/10.1007/S00417-006-0474-4 [DOI] [PubMed] [Google Scholar]
- Bowers AR, Ananyev E, Mandel AJ, Goldstein RB, & Peli E (2014). Driving with hemianopia: IV. Head scanning and detection at intersections in a simulator. Investigative Ophthalmology & Visual Science, 55(3), 1540–1548. [DOI] [PMC free article] [PubMed] [Google Scholar]
- Bronstad PM, Bowers AR, Albu A, Goldstein R, & Peli E (2013). Driving with central field loss I: effect of central scotomas on responses to hazards. JAMA Ophthalmology, 131(3), 303–309. [DOI] [PMC free article] [PubMed] [Google Scholar]
- Bronstad PM, Albu A, Bowers AR, Goldstein R, & Peli E (2015). Driving with Central Visual Field Loss II: How Scotomas above or below the Preferred Retinal Locus (PRL) Affect Hazard Detection in a Driving Simulator. Plos One, 10(9), e0136517 10.1371/journal.pone.0136517 [DOI] [PMC free article] [PubMed] [Google Scholar]
- Bubb H, Bengler K, Grünen RE, & Vollrath M (Eds.). (2015). Automobilergonomie. ATZ/MTZ-Fachbuch. Wiesbaden: Springer Fachmedien. [Google Scholar]
- Field AP, Miles J, & Field Z (2014). Discovering statistics using R (Repr). London: Sage. [Google Scholar]
- Fisher DL, Rizzo M, Caird J, & Lee JD (2011). Handbook of Driving Simulation for Engineering, Medicine, and Psychology. Hoboken: CRC Press. [Google Scholar]
- Ghosh B, Basu B, & O'Mahony M (2009). Multivariate Short-Term Traffic Flow Forecasting Using Time-Series Analysis. IEEE Transactions on Intelligent Transportation Systems, 10(2), 246–254. 10.1109/TITS.2009.2021448 [DOI] [Google Scholar]
- Godley ST, Triggs TJ, & Fildes BN (2002). Driving simulator validation for speed research. Accident Analysis & Prevention, 34(5), 589–600. 10.1016/S0001-4575(01)00056-2 [DOI] [PubMed] [Google Scholar]
- Guéguen N, Meineri S, & Eyssartier C (2015). A pedestrian’s stare and drivers’ stopping behavior: A field experiment at the pedestrian crossing. Safety Science, 75, 87–89. https://doi.Org/10.1016/j.ssci.2015.01.018 [Google Scholar]
- Hancock PA, & de Ridder SN (2003). Behavioural accident avoidance science: understanding response in collision incipient conditions. Ergonomics, 46(12), 1111–1135. [DOI] [PubMed] [Google Scholar]
- Higgins KE, & Wood JM (2005). Predicting components of closed road driving performance from vision tests. Optometry and Vision Science, 82(8), 647–656. [DOI] [PubMed] [Google Scholar]
- Hills BL (1980). Vision, visibility and perception in driving. Perception, 9(2), 183–216. [DOI] [PubMed] [Google Scholar]
- Hupfer C (1997). Computergestützte Videobildverarbeitung zur Verkehrssicherheitsarbeit am Beispiel von Fuβgängerquerungen an städtischen Hauptverkehrsstraβen (Dissertation). Universität Kaiserslautern, Kaiserslautern. [Google Scholar]
- Kaptein N, Theeuwes J, & van der Horst R (1996). Driving Simulator Validity: Some Considerations. Transportation Research Record: Journal of the Transportation Research Board, 1550, 30–36. 10.3141/1550-05 [DOI] [Google Scholar]
- Katz A, Zaidel D, & Elgrishi A (1975). An Experimental Study of Driver and Pedestrian Interaction during the Crossing Conflict. Human Factors: the Journal of the Human Factors and Ergonomics Society, 17(5), 514–527. 10.1177/001872087501700510 [DOI] [Google Scholar]
- Kotte J, & Pütz A (2017). Methodology and Results for the Investigation of Interactions Between Pedestrians and Vehicles in Real and Controlled Traffic Conditions In Bengler K, Drüke J, Hoffmann S, Manstetten D, & Neukum A (Eds.), UR: BAN Human Factors in Traffic (pp. 291–310). Wiesbaden: Springer Vieweg. [Google Scholar]
- Kraay JH, van der Horst ARA, & Oppe S (2013). Manual conflict observation technique DOCTOR: Dutch Objective Conflict Technique for Operation and Research (No. 2013-1). Voorburg. [Google Scholar]
- Kraay JH van der Horst ARA & Oppe S (1986). Handleiding voor de Conflictobservatietechniek DOCTOR. (Dutch objective conflict technique for operation and research). Leidschendam: Stichting Wetenschappelijk Onderzoek Verkeersveiligheid SWOV. [Google Scholar]
- Laureshyn A, Svensson A, & Hydén C (2010). Evaluation of traffic safety, based on micro-level behavioural data: Theoretical framework and first implementation. Accident Analysis & Prevention, 42(6), 1637–1646. https://doi.Org/10.1016/j.aap.2010.03.021 [DOI] [PubMed] [Google Scholar]
- Lee SS-Y, Black AA, Lacherez P, & Wood JM (2016). Eye Movements and Road Hazard Detection: Effects of Blur and Distractors. Optometry and Vision Science : Official Publication of the American Academy of Optometry, 93(9), 1137–1146. 10.1097/OPX.0000000000000903 [DOI] [PubMed] [Google Scholar]
- Lehsing C, Benz T, & Bengler K (2016). Insights into interaction-effects of human-human interaction in pedestrian crossing situations using a linked simulator environment. IFAC-PapersOnline, 49(19), 138–143. [Google Scholar]
- Lehsing C, & Feldstein IT (2017). Urban Interaction-Getting Vulnerable Road Users into Driving Simulation In Bengler K, Drüke J, Hoffmann S, Manstetten D, & Neukum A (Eds.), UR: BAN Human Factors in Traffic (pp. 347–362). Wiesbaden: Springer Vieweg. [Google Scholar]
- Lehsing C, Kracke A, & Bengler K (2015). Urban Perception -- A Cross-Correlation Approach to Quantify the Social Interaction in a Multiple Simulator Setting. In 2015 IEEE 18th International Conference on Intelligent Transportation Systems (ITSC): 15 - 18 Sept. 2015, Las Palmas, Gran Canaria, Spain (pp. 1014–1021). Piscataway, NJ: IEEE; 10.1109/ITSC.2015.169 [DOI] [Google Scholar]
- Mudelsee M (2014). Climate time series analysis: Classical statistical and bootstrap methods (2 ed.). Atmospheric and oceanographic sciences library: Vol. 51 Cham: Springer. [Google Scholar]
- Mühlbacher D, Preuk K, Lehsing C, Will S, & Dotzauer M (2017). Multi-Road User Simulation: Methodological Considerations from Study Planning to Data Analysis In Bengler K, Drüke J, Hoffmann S, Manstetten D, & Neukum A (Eds.), UR: BAN Human Factors in Traffic (pp. 403–418). Wiesbaden: Springer Vieweg. [Google Scholar]
- Olson P, & Farber E (1996). Forensic aspects of driver perception and response. Tucson, AZ: Lawyers & Judges Publishing Company. [Google Scholar]
- Owsley C, Wood JM, & McGwin G (2015). A roadmap for interpreting the literature on vision and driving. Survey of Ophthalmology, 60(3), 250–262. https://doi.Org/10.1016/j.survophthal.2015.01.005 [DOI] [PMC free article] [PubMed] [Google Scholar]
- Papadimitriou E, Lassarre S, & Yannis G (2017). Human factors of pedestrian walking and crossing behaviour. Transportation Research Procedia, 25, 2002–2015. https://doi.Org/10.1016/j.trpro.2017.05.396 [Google Scholar]
- Phillips ND (2017). Yarrr! The pirate’s guide to R. APS Observer, 30(3). [Google Scholar]
- Pincus SM, & Goldberger AL (1994). Physiological time-series analysis: What does regularity quantify? The American Journal of Physiology, 266(4 Pt 2), H1643–56. https://doi.Org/10.1152/ajpheart.1994.266.4.H1643 [DOI] [PubMed] [Google Scholar]
- R Core Team. (2017). A Language and Environment for Statistical Computing. Vienna, Austria: R Foundation for Statistical Computing. [Google Scholar]
- Rasouli A, Kotseruba I, & Tsotsos JK (2017). Agreeing to cross: How drivers and pedestrians communicate. In 2017 IEEE Intelligent Vehicles Symposium (IV) (pp. 264–269). [Piscataway, New Jersey]: IEEE; 10.1109/IVS.2017.7995730 [DOI] [Google Scholar]
- Ren Z, Jiang X, & Wang W (2016). Analysis of the Influence of Pedestrians’ eye Contact on Drivers’ Comfort Boundary During the Crossing Conflict. Procedia Engineering, 137, 399–406. https://doi.Org/10.1016/j.proeng.2016.01.274 [Google Scholar]
- Retting R, & Schwartz S (2018). Pedestrian Traffic Fatalities by State: 2017 Preliminary Data (Spotlight on Highway Safety). Washington. [Google Scholar]
- Salvucci DD, & Goldberg JH (2000). Identifying fixations and saccades in eye-tracking protocols. In Duchowski AT (Ed.): ACM Digital Library, Proceedings of the 2000 symposium on Eye tracking research & applications (pp. 71–78). New York, NY: ACM; 10.1145/355017.355028 [DOI] [Google Scholar]
- Savage SW, Zhang L, Swan G, & Bowers AR (2019). How does age affect the contributions of head and eye movements to scanning at intersections? Invest Ophthalmol Vis Sci, 60(ARVO E-abstract). [Google Scholar]
- Schmidt S, & Färber B (2009). Pedestrians at the kerb – Recognising the action intentions of humans. Transportation Research Part F: Traffic Psychology and Behaviour, 12(4), 300–310. https://doi.Org/10.1016/j.trf.2009.02.003 [Google Scholar]
- Schneemann F, & Gohl I (2016). Analyzing driver-pedestrian interaction at crosswalks: A contribution to autonomous driving in urban environments. In 2016 IEEE Intelligent Vehicles Symposium (IV) (pp. 38–43). [Piscataway, NJ]: IEEE; 10.1109/IVS.2016.7535361 [DOI] [Google Scholar]
- Schroeder BJ (2008). A Behavior-Based Methodology for Evaluating Pedestrian-Vehicle Interaction at Crosswalks (Dissertation). North Carolina State University, Raleigh, NC. [Google Scholar]
- Sucha M, Dostal D, & Risser R (2017). Pedestrian-driver communication and decision strategies at marked crossings. Accident; Analysis and Prevention, 102, 41–50. https://doi.Org/10.1016/j.aap.2017.02.018 [DOI] [PubMed] [Google Scholar]
- Swan G, Shahin M, Albert J, Herrmann J, & Bowers A (2018). The effects of simulated acuity and contrast sensitivity impairments on detection of pedestrian hazards. Journal of Vision, 18(10), 1043. [DOI] [PMC free article] [PubMed] [Google Scholar]
- Tsay RS (2005). Analysis of financial time series (2nd ed.). Hoboken, N.J.: Wiley-Interscience. [Google Scholar]
- Van der Horst ARA (1984). The ICTCT calibration study at Malmoe: A quantitative analysis of video recording (No. Report IZF 1984-37). TNO Institute for Perception, Soesterberg. [Google Scholar]
- Van der Horst ARA (1990). A time based analysis of road user behavior in normal and critical encounters (PhD Thesis). Delft University of Technology, Delft. [Google Scholar]
- Van der Horst ARA, & Hogema J (1993). Time-to-collision and collision avoidance systems. In Proceedings of the 6th ICTCT Workshop (pp. 1–12). [Google Scholar]
- Will S (2017). A New Approach to Investigate Powered Two Wheelers’ Interactions with Passenger Car Drivers: the Motorcycle–Car Multi-Driver Simulation In Bengler K, Drüke J, Hoffmann S, Manstetten D, & Neukum A (Eds.), UR: BAN Human Factors in Traffic (pp. 393–402). Wiesbaden: Springer Vieweg. [Google Scholar]
- Yamamoto N, & Philbeck JW (2013). Peripheral vision benefits spatial learning by guiding eye movements. Memory & Cognition, 41(1), 109–121. 10.3758/s13421-012-0240-2 [DOI] [PubMed] [Google Scholar]
- Yan X, Abdel-Aty M, Radwan E, Wang X, & Chilakapati P (2008). Validating a driving simulator using surrogate safety measures. Accident; Analysis and Prevention, 40(1), 274–288. https://doi.Org/10.1016/j.aap.2007.06.007 [DOI] [PubMed] [Google Scholar]


