Abstract
Single molecule trajectories of lipids and proteins can yield valuable information about the nanoscopic organization of the plasma membrane itself. The interpretation of such trajectories, however, is complicated, as the mobility of molecules can be affected by the presence of immobile obstacles, and the transient binding of the tracers to these obstacles. We have previously developed a micropatterning approach that allows for immobilizing a plasma membrane protein and probing the diffusional behavior of a putative interaction partner in living cells. Here, we provide guidelines on how this micropatterning approach can be extended to quantify interaction parameters between plasma membrane constituents in their natural environment. We simulated a patterned membrane system and evaluated the effect of different surface densities of patterned immobile obstacles on the relative mobility as well as the surface density of diffusing tracers. In the case of inert obstacles, the size of the obstacle can be assessed from its surface density at the percolation threshold, which in turn can be extracted from the diffusion behavior of the tracer. For sticky obstacles, two-dimensional dissociation constants can be determined from the tracer diffusion or surface density.
Introduction
Since the advent of single particle tracking in the late nineteen-eighties, researchers have tried to use information from the recorded single molecule trajectories to draw conclusions about the underlying structure of the matrix [1]. Applications include synthetic membranes [2–4], the cellular plasma membrane [5–11], the cytosol [12], the nucleus [13–15], but also inorganic films [16]. Most studies took advantage of the high precision for determination of single particle localizations, which is far below the optical diffraction limit [17, 18]. Nanoscopic regions with peculiarities in the diffusion behavior could hence be directly imaged [5, 10], or features were characterized from pooled analysis of multiple trajectories [2].
To conduct such experiments, it is necessary to faithfully track the molecule of interest (e.g. a protein) over several frames with a sufficiently good time resolution. This, in turn, necessitates specific labeling of this molecule; common labels include fluorescent proteins, antibodies or antibody fragments, and scattering particles [19]. In living cells, the plasma membrane has become a favorite target for single particle tracking studies, partly because the recording of 2D compared to 3D diffusion data is much less experimentally challenging. For experiments, cells are typically interfaced with glass coverslips, allowing the use of total internal reflection fluorescence microscopy, which significantly improves signal quality due to background minimization.
In addition to morphological features, single molecule tracking allows for identifying co-diffusion of different membrane proteins [20], or transient immobilizations of proteins due to binding to immobile interaction partners [21]. In fact, immobilizations have also frequently been detected using alternative techniques such as spot-variation fluorescence correlation spectroscopy [22, 23] or fluorescence recovery after photobleaching [24]. It appears as if both lipids and proteins experience multiple mobility changes during their excursions at the membrane surface.
The complicated nature of the plasma membrane, however, hampers straightforward interpretation of protein and lipid diffusion. Deviations from free Brownian motion could be caused by multiple reasons, which need not be related to the hypothesized mechanism. For example, free diffusion on curved surfaces gives rise to apparent confined diffusion; the artifact arises from the projection of the actual three-dimensional trajectory onto the two-dimensional focal plane of the microscope [25]. Furthermore, partitioning into presumed lipid domains [20] is difficult to disentangle from other mechanisms of co-diffusion, as the domains are too small and too transient to be directly imaged.
In the last years, we and others have developed a method for deliberate rearrangement of plasma membrane proteins using a micropatterning approach [26–29]. Briefly, the surface of a glass coverslip is decorated with defined patterns of an antibody specific to an exoplasmic epitope of a membrane protein [30]. When cells are grown on such surfaces, the target protein in the plasma membrane (termed “obstacle”) is captured and immobilized within the antibody pattern. The adjustable enrichment of the obstacle then allows for quantitative assessment of the influence of the obstacle on the diffusional behavior of any other fluorescently labeled membrane protein (termed “tracer”) [27].
In this paper, we elucidate the effects of immobilized membrane proteins on the behavior of mobile membrane constituents with respect to their mobility and surface density in a micropatterning experiment. To this end, we employed Monte Carlo simulations to emulate two aspects, inert obstacles and sticky obstacles. Ratios between diffusion constants and surface densities of the probe molecules in obstacle-enriched versus -depleted regions were quantitatively analyzed. This study is based on investigations by Michael Saxton, who studied particularly the consequences of obstacles [31, 32] and binding sites [33] on anomalous subdiffusion. We focused here on the effects observed under ideal conditions and did neither consider sample heterogeneities nor localization errors [34], which may affect real-life experiments.
Methods
Obstacles masks were generated by random distribution of circular discs with radius R on quadratic binary arrays using MATLAB (R2013b, The MathWorks Inc., Natick, MA). Overlapping of individual circular discs was permitted, yielding arbitrarily shaped patterns of excluded area. The density of obstacles was measured either as the number density ρ or relative covered area C. Off-lattice random walks of tracers were simulated in MATLAB on a standard personal computer. The random walk was simulated by successive displacement of a point tracer for a defined length l at a random angle ϕ [35]. Tracers were placed on random positions within the accessible area, from where they started their random walk. For all scenarios, diffusional paths were simulated in parallel for N tracer molecules and interaction between different tracers was not allowed.
After each simulated step, tracer-obstacle overlap was interrogated by approximating the tracer positions to discrete pixel indices, which were then tested against the pixelated obstacle mask. In case of inert obstacles, a tracer that had moved into a pixel with value 1 (obstacle) at the time point t + Δt was set back to its initial position at time point t and allowed to continue its diffusional motion with the next step. In case of binding, an additional query was introduced: with a binding probability pbind the tracer molecule was transferred into a bound state and immobilized at its position at time point t. In each consecutive step, bound tracers were allowed to continue their random walk with the unbinding probability punbind. The relation between punbind and the average bond lifetime τ is given by
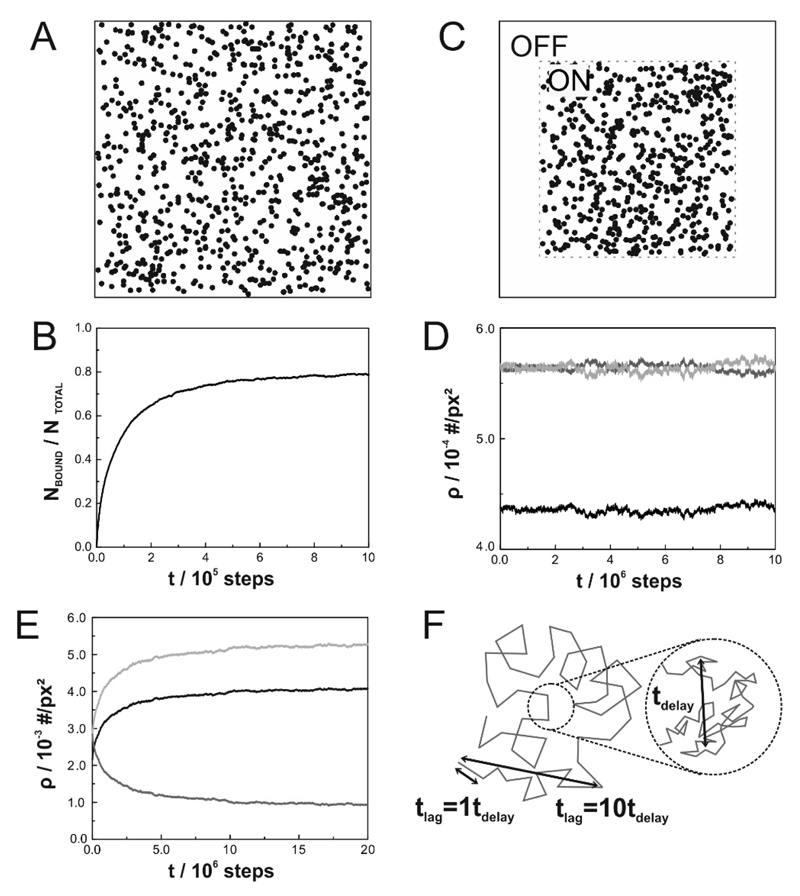
Masks for evaluating the effects of obstacles on tracer diffusion were 6,000 × 6000 pixel and contained obstacles with a radius R = 20 pixel. This pixelation was chosen to approximate circular obstacles reasonably well. The diffusion constant in areas without obstacles (“OFF”-regions) DOFF was unaffected by the presence of obstacles in areas containing obstacles (“ON”-regions) and therefore equivalent to free diffusion (Fig. 1A). The tracer step length was set to which is reasonably small compared to the obstacle size and the free space between obstacles; the number of simulated tracers was set to N=10,000. In case of sticky obstacles, the system was allowed to equilibrate before recording the trajectories. Plotting the fraction of bound molecules versus the number of simulated steps allowed to choose an appropriate equilibration time of 106 steps (Fig. 1B).
Figure 1. Obstacle masks and equilibration criteria.
(A) A 2000 × 2000 pixel detail of an obstacle mask used for simulations to determine DON at C = 0.22. (B) Fraction of tracers bound to obstacles as a function of equilibration time t. (C) Obstacle mask used for simulations to determine the ratio of tracer density ρON/ρOFF. (D and E) Surface densities of tracers outside the obstacle field ρOFF (dark gray), inside the obstacle field ρON (black) and in the accessible area of the obstacle field ρON,acc (light gray) plotted as a function of equilibration time t for inert (D) or sticky (E) obstacles at C = 0.22. (F) Schematic representation of the relationship between simulated steps, tdelay and tlag.
Trajectories were analyzed by interrogating the tracer position every n steps; n thus defines the delay time between two consecutive observations via tdelay = n · Δt. Square displacements and mean square displacements (msd) were calculated via and respectively, for a large range of delays and time lags tlag. We typically varied tlag in a range of tdelay < tlag < 50 · tdelay (Fig. 1F). Different delay times were tested by varying the number of steps from nmin = 102 to nmax = 106. To reduce computation time, the number of simulated tracers was reduced to N = 5,000 for larger delays corresponding to high numbers of steps (n = 105 and n = 106). To analyze the effects of continuous sample illumination, tracer positions were recorded by averaging over all n steps.
In contrast to the diffusion DOFF, the surface density of tracers in OFF-regions ρOFF is expected to be affected by the presence of obstacles in ON-regions because the overall number of tracers N = NON + NOFF is kept constant. Thus, we used masks consisting of a square field with a given obstacle surface density and a surrounding area without obstacles (Fig. 1C). Both, for simulations with inert and sticky obstacles, binary masks of the size 2,000 × 2,000 pixel containing obstacles with radius R = 20 pixel were used and the number of simulated tracers was set to N = 10,000. The tracer step length was set to Before interrogating the surface densities of tracers, equilibration of the system was assessed (Fig. 1D and E).
According to Saxton [32] the situation of circular obstacles and tracers with radii Robs and Rtrac, respectively, can be simplified by assuming point tracers diffusing through a course of obstacles with modified radius R = Robs + Rtrac. In our previous micropatterning experiments [27] on CD59 diffusing in an obstacle course of immobilized mGFP-GPI we found a tracer radius of Rtrac = 2.5 nm and an obstacle radius of Robs = 1.25 nm. To make the simulations comparable with our previous experimental findings, we used here point tracers and obstacles with a radius R = 4 nm. The tracer diffusion constant in the absence of obstacles was set to DOFF = 0.25 μm2/s which agrees with free CD59 mobility in T24 cells at room temperature [27]. The average delay time corresponding to a single simulated step, Δt, can thus be related to the single step length via Periodic boundary conditions were used for all simulated scenarios.
Results
We were interested in the behavior of molecules moving on matrices that consist of two distinct regions: a square containing the micropattern (“ON”-region), and a ring around the square containing the undisturbed membrane (“OFF”-region; see Fig. 1). To study the random walk, we employed off-lattice Monte Carlo simulations: in all simulations, tracers were distributed uniformly over the accessible space, where they started their random walk. With time, the surface densities of tracers equilibrated, as assessed by plateaus in ON- and OFF-surface densities; the recording of trajectories was started after the equilibration phase. We characterized the different simulation scenarios by two experimentally accessible figures of merit:
-
i)
The mobility ratio reports on changes in tracer diffusion behavior due to the presence of obstacles. Unless noted, we determined the diffusion constants in the ON-regions, DON, by analysis of the mean square displacement (msd) as a function of the time lag (tlag) according to The diffusion constant in the OFF-region, DOFF, is undisturbed and hence assumed to be known.
-
ii)
The surface density ratio measures whether tracers get enriched or depleted in response to increasing surface densities of obstacles. For this, we determined the number of ON-localizations (NON) and OFF-localizations (NOFF) divided by the total ON- and OFF-area (AON and AOFF, respectively), yielding the tracer surface densities ρON = NON/AON and ρOFF = NOFF/AOFF. Throughout this paper, we specify obstacle concentrations by number density, ρ, or by area coverage, C. Area coverage can be converted to number density by C = ρπR2 (non-overlapping obstacles) or C = 1 − exp(−ρπR2) (overlapping obstacles), with R being the radius of the obstacle [36]; the two expressions get identical for C ≪ 1. We also calculated the tracer surface density in accessible parts of the ON-regions by ρON,acc = NON/AON,acc. Note that this parameter usually cannot be determined experimentally.
Inert obstacles
First, we addressed the question how inert immobile obstacles in ON-regions affected tracer mobility. Therefore, we randomly added increasing numbers of impenetrable circular obstacles, which were allowed to overlap, to the ON-region. At a low obstacle concentration, continuous paths exist for the tracers to move over long distances. With increasing density, however, such movements are impeded, until – above the percolation threshold – long range paths are completely blocked. Since the percolation threshold is controlled by the excluded area experienced by the tracers, the obstruction of a tracer of radius R by point obstacles is equivalent to the obstruction of a point tracer by obstacles of radius R; even more so, we can reduce the general scenario of obstacles with radius Robst and tracers with radius Rtrac to the scenario of point tracers moving through a course of obstacles with radius R = Robs + Rtrac [32]. For overlapping discs and moving point tracers, the percolation threshold is known and given by an area coverage CP ≈ 0.676 [37], which translates to an obstacle radius with ρP the number density of obstacles at the percolation threshold [32].
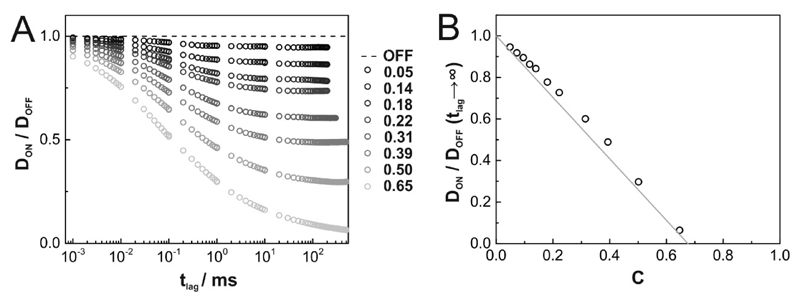
We confirmed simulations by Michael Saxton [31], which revealed anomalous subdiffusion according to with α < 1, over three orders of magnitude in tlag. In Fig. 2A we plotted the tlag-dependence of for various obstacle densities C. Free diffusion hence corresponds to constant DON/DOFF, anomalous subdiffusion to negative slopes. For tlag → 0, our simulations yield convergence to unhindered diffusion with mobility DOFF. Also for tlag → ∞ diffusion becomes Brownian, yet with reduced mobility. In between, diffusion is anomalous, particularly for high obstacle densities. The limit tlag → ∞ reflects the situation typically accessible in experiments. Plotting DON/DOFF at tlag → ∞ yields a rather linear behavior with DON/DOFF(tlag → ∞) = 1 − C/CP (Fig. 2B), as also observed in our previous experimental study [27]. Note a slight but notably increased mobility ratio compared to the linear model, particularly at intermediate surface coverage, which was also observed by Saxton [31].
Figure 2. Tracer diffusion at different concentrations of inert obstacles.
(A) Ratio of diffusion constants in the presence (DON) and absence (DOFF) of inert obstacles as a function of time lag for various obstacle densities C (grayscale color code). (B) Mobility ratios DON/DOFF (tlag → ∞) are plotted as a function of the obstacle concentration C. DON was measured at tlag = 200ms, tlag = 300ms, tlag = 500ms for obstacle concentrations of C ≤ 0.14, C = 0.18 and C ≥ 0.22, respectively. In grey we show the linear relation DON/DOFF = 1 – C/CP.
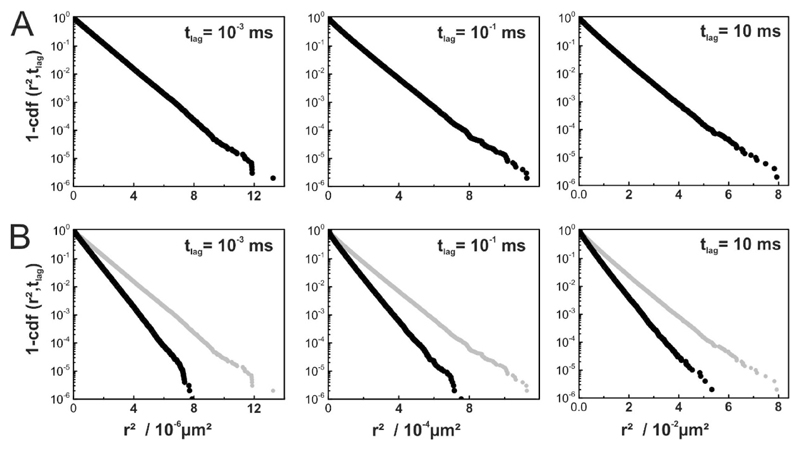
Some researchers use step size distributions for an in-depth analysis of single molecule trajectories [2, 38–40]. The rationale is simple: if there are two independent fractions of tracers with different mobility, the two fractions can be disentangled by analyzing the full distribution functions instead of their means. In 2D, the cumulative density function (cdf) of the squared displacements for free diffusion is given by [2]. If there are imax subfractions, the cdf becomes where αi and Di denote the statistical weight and diffusion coefficient of subfraction i, respectively. We have previously pointed out, however, that the problem cannot be simply inverted: deviations from a mono-exponential function do not necessarily imply the presence of multiple fractions of particles with different mobility [35]. Hence, we were interested whether the presence of inert obstacles would change the shape of the cdf. Interestingly, there was no observable deviation from a mono-exponential function over the whole range of time lags studied (Fig. 3A); even in cases of strong anomalous diffusion (tlag = 10−1ms) we found no effect.
Figure 3. Step size distribution analysis of tracer diffusion in the presence of inert obstacles.
(A) Cumulative density functions of square displacements cdf(r2, tlag) are shown as semi-log plots of 1 – cdf versus square displacement at C = 0.39 for various time lags. (B) Same as in (A) but under conditions of continuous illumination with till = tdelay. Curves for till = 0 are plotted in gray for comparison.
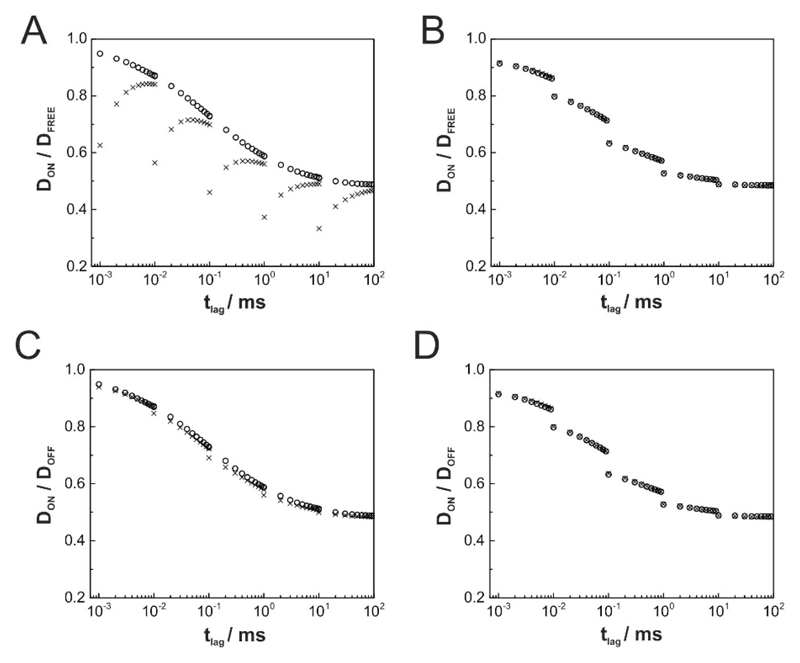
It is known that movement during illumination affects the observed step sizes of single molecule trajectories, with the following consequences: i) free diffusion yields an offset in the dependence of msd on tlag according to with till denoting the illumination time [41]; ii) confinement sizes appear reduced, as the observed trajectories collapse around the center of each corral [9, 42]. We were thus interested, whether and how the observed diffusion parameters were affected by movement during illumination. We simulated five groups of data with a given illumination time till = tdelay, i.e. the illumination light source is assumed to be constantly on; tdelay was set to 1μs, 10μs, 100μs, 1ms, and 10ms (Fig. 4). As expected, all diffusion coefficients were underestimated when calculating D according to in consequence of the described offset (Fig. 4A. In a real life experiment, researchers commonly determine diffusion coefficients from the slope of msd versus tlag, so that offsets should not have consequences on the obtained results [43]. Hence, we modified our calculation of the diffusion constant D by calculating the slope where Δmsd = msd(tlag) − msd1 is the difference between msd at time point tlag and msd at the first data point; Δtlag is the corresponding difference in time lags. Comparison of the data with results obtained for till = 0 yielded a much better approximation of the free mobility (Fig. 4B). The described effects, however, affect tracers both in ON- and OFF-regions. Indeed, mobility ratios are hardly influenced by illumination effects, both when calculating diffusion constants by (Fig. 4C) or via slopes (Fig. 4D). Also here, the cdfs did not yield substantial deviations from a mono-exponential behavior (Fig. 3B).
Figure 4. Effect of continuous illumination on relative tracer diffusion.
All simulations were performed at an obstacle density of C=0.39 (inert obstacles). Either no illumination (till = 0; open circles) or continuous illumination (till = tdelay; cross) was simulated. (A, B) show the ratios of diffusion constants DON/Dfree, (C, D) the ratios DON/DOFF. In (A) and (C), mobility was calculated according to D = msd/(4tlag), in (B) and (D) according to D = Δmsd/(4Δtlag), where Δmsd = msd(tlag) – msd1.
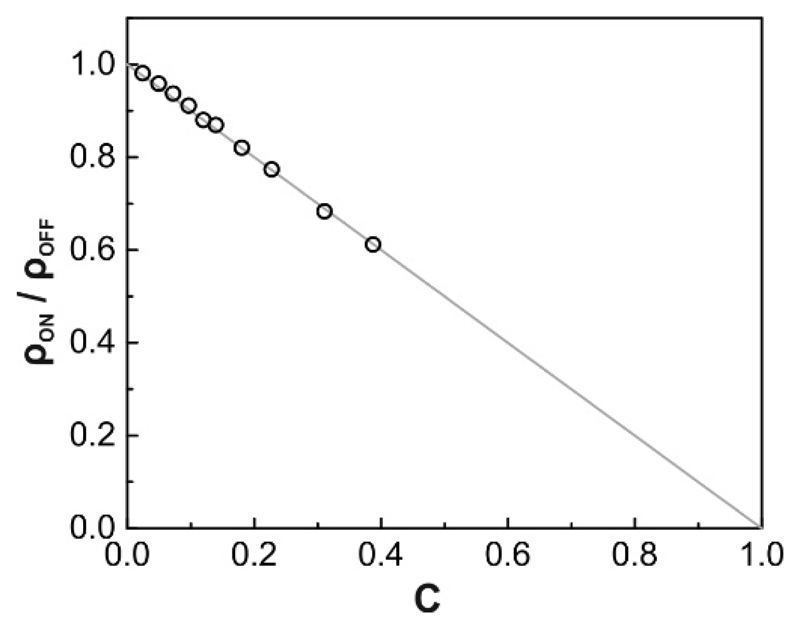
We next tested the effect of inert obstacles on the tracer surface density ratio Due to size exclusion effects, the tracer density in the obstacle field was reduced according to (Fig. 5). In other words, the tracer density within the accessible region of the obstacle field was identical to the tracer density outside the obstacle field. The reduced surface density can also be interpreted as consequence of reduced particle flux into the obstacle field, which scales with obstacle surface coverage.
Figure 5. Tracer surface density in the presence of inert obstacles.
The decrease in tracer surface density in ON-regions ρON is fully explained by size exclusion due to the presence of obstacles. The grey line shows the linear decrease ρON/ρOFF = 1 – C.
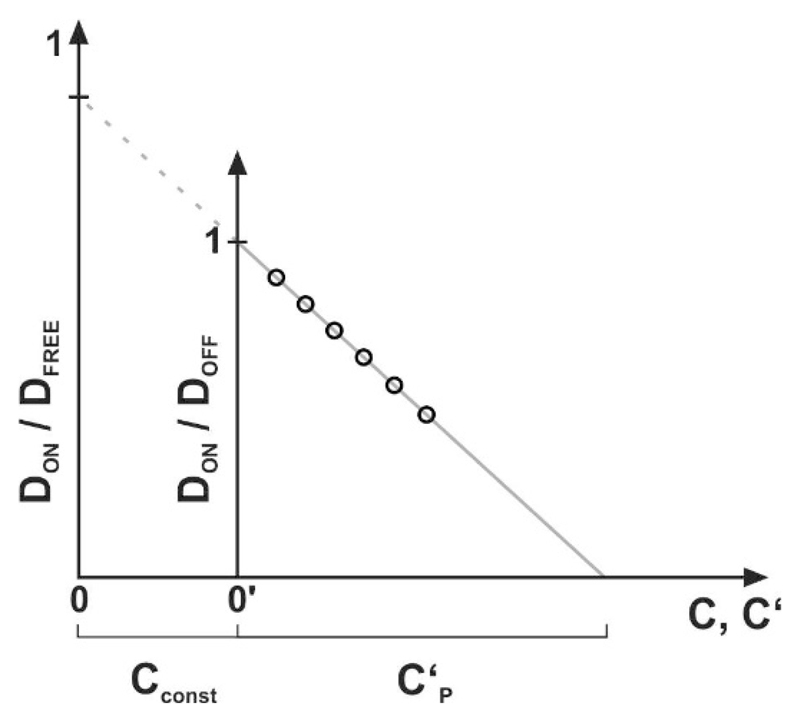
The cellular plasma membrane usually contains a substantial fraction of immobilized proteins, which act as natural constitutive obstacles to the motion of the tracers [24]; their surface coverage shall be given here by Cconst. Consequently, the experimentally adjusted density of immobile obstacles C′ may be smaller than the total obstacle density C = Cconst + C′. The presence of constitutive obstacles in both the ON- and the OFF-region leads to further reduction of the measured mobility ratio DON/DOFF = 1 − C′/CP′ by a virtual reduction of the percolation threshold (Fig. 6). This is due to the fact that the constitutive obstacles and those introduced in the experiment add linearly to the total area covered by obstacles. Contrary to this, there is no effect on the number density ratio
Figure 6. Effect of constitutive obstacles.
The sketch shows the experimentally accessible determination of , where black circles indicate exemplary data points. The linear extrapolation used to determine the percolation threshold is shown as a gray line. Cconst corresponds to the concentration of additional constitutive obstacles present in a live cell experiment. C and C' denote the real obstacle concentration (as used in simulations) and the experimentally determined obstacle concentration, respectively.
Inert obstacles plus binding
In a cell, interactions between the membrane constituents may further complicate the diffusion behavior. We consider here a scenario, in which obstacles bind and hence retard the tracers. In our model, each collision of a tracer with an obstacle leads to a binding event with the probability pbind. In case of binding, a lifetime is drawn from an exponential distribution (tbound), and the tracer is halted for the according time period before it is released again. In between two consecutive binding events, tracers diffuse for a time tfree; note that this parameter cannot be freely adjusted and depends on obstacle concentration and shape, on the binding probability pbind, and – in principle – on the degree of saturation of the binding. In our model, we assumed non-saturating binding conditions. It is known that initial conditions have a strong influence on the average tracer mobility in case of binding [33]; we hence ensured equilibration of the tracers before recording the trajectories.
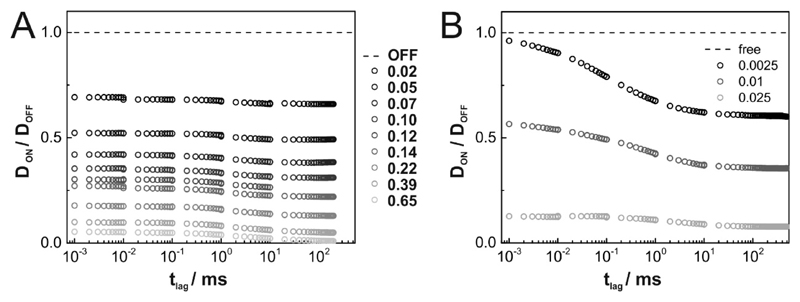
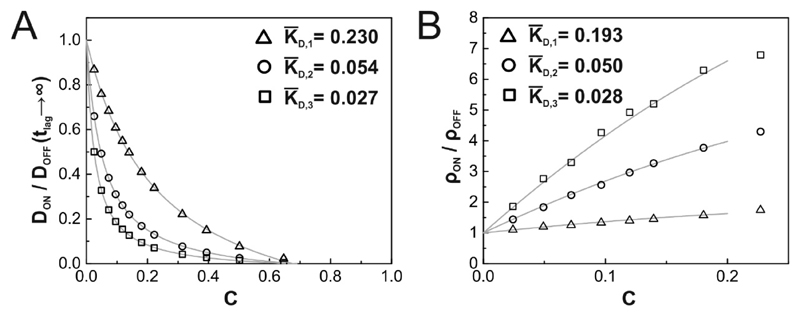
As expected, tracer mobility was reduced with increasing binding probability pbind and obstacle concentration C (Fig. 7). The shapes of the curves appear fairly similar, only the transition between fast and slow diffusion shifts to longer time lags with increasing binding probability. We also checked the effects of obstacle concentration on the mobility ratio. Essentially, the presence of obstacles influences the diffusional motion in two ways: by obstruction and by binding. The two effects factorize, yielding where denotes the bound fraction of tracers. Solving the full binding model is straightforward and allows for calculating K as function of the surface densities C, ρ, and the two-dimensional dissociation constant where kON and kOFF denote the forward and reverse reaction rate constants (see e.g. Eq. 1 in the supplements to [21]). The model simplifies under the assumption of low tracer surface densities (ρ ≪ KD); in other words, binding competition between individual tracers is neglected. In this case, we obtain and thus here, we introduced the dimensionless variable In contrast to the case of inert obstacles, the mobility ratio approaches zero at the percolation threshold in a highly nonlinear way (Fig. 8A). Also in the density ratio, the contributions of obstruction and binding factorize. Retardation leads to an increase in the surface density by a factor and thus (Fig. 8B). The fitted determined via the mobility and the surface density ratios, in good agreement for all tested pairs of binding and unbinding probability.
Figure 7. Tracer diffusion in the presence of sticky obstacles.
Ratio of diffusion constants in the presence (DON) and absence (DOFF) of sticky obstacles as a function of time lag. (A) Binding was simulated for various obstacle concentrations C (grayscale color code) with a binding probability pbind = 0.1 and an average binding time of τ = 0.1ms. (B) Curves for different binding probabilities pbind for C = 0.31 are plotted.
Figure 8. Determination of dissociation constants from tracer diffusion and surface density.
Binding was simulated with a binding probability pbind = 0.1 and three different average binding times of τ1 = 0.025ms (Δ), τ2 = 0.1ms (○), τ3 = 0.2ms (□), which correspond to dissociation constants for τ1, τ2 and τ3, respectively. Mobility ratios DON/DOFF at tlag = 200ms (A) or ρON/ρOFF (B) are plotted as a function of area fraction covered by obstacles. The fits (gray lines; models described in the main text) are in good agreement with simulated data; fit results are provided in the figures.
Finally, we also checked the cdfs for for deviation from mono-exponential behavior in the case of binding (Fig. 9). Indeed, we observed strong effects for time lags shorter or equal to the bond lifetime. For tlag ≪ τ, a clear bimodal distribution is observable, with the immobile fraction corresponding to K ≈ 0.89, consistent with the obtained for the chosen settings (Fig. 9A). This reflects a situation where molecules are either bound or free during the recorded step. With increasing time lag, the distributions blur (Fig. 9B), until hardly any separation can be observed at tlag ≫ τ, yielding a mono-exponential function with decreased average mobility (Fig. 9C).
Figure 9. Step size distribution analysis of tracer diffusion in the presence of sticky obstacles.
Binding was simulated with a probability pbind = 0.1 and an average binding time of τ = 0.1ms. Cumulative density functions of square displacements cdf(r2, tlag) are shown as semi-log plots of 1 – cdf versus square displacement at C = 0.39. Curves obtained from simulations with inert obstacles are plotted in gray for comparison.
Discussion
We have described here the effects of immobilized obstacles on the two-dimensional diffusion and surface density of mobile tracers. The underlying idea is to use such surfaces for quantifying interaction parameters between plasma membrane constituents in their natural environment. In the following, we briefly describe how to design the according experiment. Here, we put the focus on the experimental design in view of subsequent analysis for binding and obstacle size. The reader is referred to other review articles for a detailed explanation of the micropatterning assay itself [30, 44].
For quantitative data analysis, the surface density of the immobilized obstacles must be determined. If the obstacle is labeled at a known degree of labeling (dol), fluorescence microscopy allows for calculating the obstacle signals from the ON- and OFF-regions, respectively. The fluorescence intensity originating from immobilized obstacle obstacles in the ON-region is given by From the brightness of a single dye molecule, the surface density can be calculated according to Captured obstacle proteins on the cell surface can be considered as non-overlapping obstacles. Hence, the surface coverage by obstacles is linearly proportional to the obstacle density and given by with a priori unknown obstacle radius R.
Next, single molecule microscopy is used for tracking fluorescently labeled tracers both in ON- and OFF-regions of the micropatterned area. Diffusion coefficients DON and DOFF can be obtained e.g. by determining the slope of the respective msd as function of tlag from (σ denoting the localization errors) [43]. To reduce deviations, it is recommended to use only the first two data points of the msd plots [43]. Delay and illumination times have to be optimized to balance conflicting demands. Illumination times should be short enough to reduce photobleaching effects, but long enough to yield good visibility of the signals. Delays should be short enough to allow for good trackability, but long enough to ensure that the transition to free diffusion has been reached. The latter point gets clear from Fig. 2: if tlag was chosen too short, the system would show anomalous subdiffusion, which would yield – when fitted with a model for diffusion – diffusion coefficients biased towards higher values. Hence, the effects of obstacles would be underestimated.
In the case of inert obstacles, plotting DON/DOFF versus thus allows for determining the obstacle density at the percolation threshold ρP, and the obstacle size from We have used this approach previously to estimate the apparent size of a GPI-anchored protein as experienced by protein and lipid tracers [27].
For the determination of the tracer surface densities one can essentially count all recorded single molecule localizations, split them according to masks obtained from the obstacle protein images, and divide the obtained numbers by the respective areas. To ensure that the obstacle-tracer interaction is not saturated in case of binding, it is recommended to select for cells with low tracer expression levels.
In the case of binding, KD can be determined from either relative tracer surface density or diffusion. In the latter case, CP needs to be determined in a separate experiment with a non-binding tracer of the same size.
Acknowledgements
This work was supported by the Austrian Science Fund (FWF projects P26337-B21 and P 25730-B21), and by the Austrian Research Promotion Agency FFG (842379).
Table of used variables
- AON, AOFF
Total area of the obstacle course and remaining area, respectively
- AON,acc
Sub-area of the obstacle course that is accessible for tracer molecules
- α
Anomalous diffusion exponent
- cdf
Cumulative density function
- C
Relative area coverage by obstacles
- CP
Percolation threshold in measures of relative area coverage
- Cconst
Relative area covered by constitutive immobile obstacles
- C′
Relative area coverage of obstacles adjusted by the user
Virtual percolation threshold in measures of relative area coverage
Relative area coverage by immobile obstacle molecules inside of obstacle course
- dol
Degree of labeling
- DON, DOFF
Diffusion constant inside and outside of obstacle course
Fluorescence signal of obstacle molecules inside and outside of obstacle course, respectively
Fluorescence signal of immobilized obstacle molecules inside of obstacle course
Fluorescence signal of a single dye-labeled obstacle molecule
- ϕ
Direction of tracer step
- kON, kOFF
Forward and backward rate constants for binding between tracers and obstacles, respectively
- K
Bound fraction of tracer molecules
- KD
2D dissociation constant
Dimensionless 2D dissociation constant; related to obstacle radius via
- l
Tracer steplength
- msd(tlag)
Mean square displacement during time interval tlag
- msd1
Mean square displacement at tlag = 1 · tdelay
- Δmsd
Difference between mean square displacements
- N
Number of tracer molecules
- NON, NOFF
Number of tracer molecules inside and outside of obstacle course, respectively
- n
Number of simulated steps between two consecutive observations
- pbind
Probability of binding upon tracer-obstacle contact
- punbind
Probability of unbinding for bound tracer molecules
- R
Radius of obstacles in pixels
- Robs
Radius of obstacles in nm
- Rtrac
Radius of tracers in nm
Tracer position at time point t
- r2
Tracer square displacement
- ρ
Number density
- ρON, ρOFF
Number density of tracer molecules inside and outside obstacle course, respectively
- ρON,acc
Number density of tracer molecules in accessible subarea inside obstacle course
- ρP
Number density of obstacles at percolation threshold
Number density of immobile obstacle molecules inside of obstacle course
Number density of tracer molecules inside and outside of obstacle course, respectively
- σ
Localization error
- Δt
Time interval corresponding to one simulated trace step
- tbound
Binding lifetime of an individual tracer molecule
- tfree
Time of free diffusion for a tracer molecule in a course of sticky obstacles
- tdelay
Time interval between two consecutive observations
- tlag
Multiples of tdelay; varied in the range tdelay < tlag < 50 · tdelay
- Δtlag
Difference between different time lags
- till
Illumination time
- τ
Average binding time
References
- 1.Saxton MJ, Jacobson K. Single-particle tracking: applications to membrane dynamics. Annu Rev Biophys Biomol Struct. 1997;26:373–399. doi: 10.1146/annurev.biophys.26.1.373. [DOI] [PubMed] [Google Scholar]
- 2.Schütz GJ, Schindler H, Schmidt T. Single-molecule microscopy on model membranes reveals anomalous diffusion. Biophys J. 1997;73:1073–1080. doi: 10.1016/S0006-3495(97)78139-6. [DOI] [PMC free article] [PubMed] [Google Scholar]
- 3.Spillane KM, Ortega-Arroyo J, de Wit G, Eggeling C, Ewers H, Wallace MI, Kukura P. High-speed single-particle tracking of GM1 in model membranes reveals anomalous diffusion due to interleaflet coupling and molecular pinning. Nano Lett. 2014;14:5390–5397. doi: 10.1021/nl502536u. [DOI] [PMC free article] [PubMed] [Google Scholar]
- 4.Deverall MA, Gindl E, Sinner EK, Besir H, Ruehe J, Saxton MJ, Naumann CA. Membrane lateral mobility obstructed by polymer-tethered lipids studied at the single molecule level. Biophys J. 2005;88:1875–1886. doi: 10.1529/biophysj.104.050559. [DOI] [PMC free article] [PubMed] [Google Scholar]
- 5.Fujiwara T, Ritchie K, Murakoshi H, Jacobson K, Kusumi A. Phospholipids undergo hop diffusion in compartmentalized cell membrane. J Cell Biol. 2002;157:1071–1081. doi: 10.1083/jcb.200202050. [DOI] [PMC free article] [PubMed] [Google Scholar]
- 6.Schütz GJ, Kada G, Pastushenko VP, Schindler H. Properties of lipid microdomains in a muscle cell membrane visualized by single molecule microscopy. Embo J. 2000;19:892–901. doi: 10.1093/emboj/19.5.892. [DOI] [PMC free article] [PubMed] [Google Scholar]
- 7.Jaqaman K, Kuwata H, Touret N, Collins R, Trimble William S, Danuser G, Grinstein S. Cytoskeletal Control of CD36 Diffusion Promotes Its Receptor and Signaling Function. Cell. 2011;146:593–606. doi: 10.1016/j.cell.2011.06.049. [DOI] [PMC free article] [PubMed] [Google Scholar]
- 8.Andrews NL, Lidke KA, Pfeiffer JR, Burns AR, Wilson BS, Oliver JM, Lidke DS. Actin restricts FcεRI diffusion and facilitates antigen-induced receptor immobilization. Nat Cell Biol. 2008;10:955–963. doi: 10.1038/ncb1755. [DOI] [PMC free article] [PubMed] [Google Scholar]
- 9.Wieser S, Moertelmaier M, Fuertbauer E, Stockinger H, Schutz GJ. (Un)confined diffusion of CD59 in the plasma membrane determined by high-resolution single molecule microscopy. Biophysical journal. 2007;92:3719–3728. doi: 10.1529/biophysj.106.095398. [DOI] [PMC free article] [PubMed] [Google Scholar]
- 10.Manley S, Gillette JM, Patterson GH, Shroff H, Hess HF, Betzig E, Lippincott-Schwartz J. High-density mapping of single-molecule trajectories with photoactivated localization microscopy. Nat Methods. 2008;5:155–157. doi: 10.1038/nmeth.1176. [DOI] [PubMed] [Google Scholar]
- 11.Lommerse PH, Snaar-Jagalska BE, Spaink HP, Schmidt T. Single-molecule diffusion measurements of H-Ras at the plasma membrane of live cells reveal microdomain localization upon activation. J Cell Sci. 2005;118:1799–1809. doi: 10.1242/jcs.02300. [DOI] [PubMed] [Google Scholar]
- 12.Wang P-Y. Mapping Intracellular Diffusion Distribution Using Single Quantum Dot Tracking: Compartmentalized Diffusion Defined by Endoplasmic Reticulum. Journal of the American Chemical Society. 2014 doi: 10.1021/ja511273c. [DOI] [PubMed] [Google Scholar]
- 13.Siebrasse JP, Veith R, Dobay A, Leonhardt H, Daneholt B, Kubitscheck U. Discontinuous movement of mRNP particles in nucleoplasmic regions devoid of chromatin. Proc Natl Acad Sci U S A. 2008;105:20291–20296. doi: 10.1073/pnas.0810692105. [DOI] [PMC free article] [PubMed] [Google Scholar]
- 14.Sun C, Yang W, Tu LC, Musser SM. Single-molecule measurements of importin alpha/cargo complex dissociation at the nuclear pore. Proc Natl Acad Sci U S A. 2008;105:8613–8618. doi: 10.1073/pnas.0710867105. [DOI] [PMC free article] [PubMed] [Google Scholar]
- 15.Dange T, Grunwald D, Grunwald A, Peters R, Kubitscheck U. Autonomy and robustness of translocation through the nuclear pore complex: a single-molecule study. J Cell Biol. 2008;183:77–86. doi: 10.1083/jcb.200806173. [DOI] [PMC free article] [PubMed] [Google Scholar]
- 16.Zurner A, Kirstein J, Doblinger M, Brauchle C, Bein T. Visualizing single-molecule diffusion in mesoporous materials. Nature. 2007;450:705–708. doi: 10.1038/nature06398. [DOI] [PubMed] [Google Scholar]
- 17.Thompson RE, Larson DR, Webb WW. Precise nanometer localization analysis for individual fluorescent probes. Biophys J. 2002;82:2775–2783. doi: 10.1016/S0006-3495(02)75618-X. [DOI] [PMC free article] [PubMed] [Google Scholar]
- 18.Mortensen KI, Churchman LS, Spudich JA, Flyvbjerg H. Optimized localization analysis for single-molecule tracking and super-resolution microscopy. Nat Methods. 2010;7:377–381. doi: 10.1038/nmeth.1447. [DOI] [PMC free article] [PubMed] [Google Scholar]
- 19.Clausen MP, Lagerholm BC. The probe rules in single particle tracking. Current protein & peptide science. 2011;12:699–713. doi: 10.2174/138920311798841672. [DOI] [PubMed] [Google Scholar]
- 20.Suzuki KG, Kasai RS, Hirosawa KM, Nemoto YL, Ishibashi M, Miwa Y, Fujiwara TK, Kusumi A. Transient GPI-anchored protein homodimers are units for raft organization and function. Nat Chem Biol. 2012;8:774–783. doi: 10.1038/nchembio.1028. [DOI] [PubMed] [Google Scholar]
- 21.Axmann M, Huppa Johannes B, Davis Mark M, Schütz Gerhard J. Determination of Interaction Kinetics between the T Cell Receptor and Peptide-Loaded MHC Class II via Single-Molecule Diffusion Measurements. Biophys J. 2012;103:L17–L19. doi: 10.1016/j.bpj.2012.06.019. [DOI] [PMC free article] [PubMed] [Google Scholar]
- 22.Lenne PF, Wawrezinieck L, Conchonaud F, Wurtz O, Boned A, Guo XJ, Rigneault H, He HT, Marguet D. Dynamic molecular confinement in the plasma membrane by microdomains and the cytoskeleton meshwork. Embo J. 2006;25:3245–3256. doi: 10.1038/sj.emboj.7601214. [DOI] [PMC free article] [PubMed] [Google Scholar]
- 23.Eggeling C, Ringemann C, Medda R, Schwarzmann G, Sandhoff K, Polyakova S, Belov VN, Hein B, von Middendorff C, Schonle A, Hell SW. Direct observation of the nanoscale dynamics of membrane lipids in a living cell. Nature. 2009;457:1159–1162. doi: 10.1038/nature07596. [DOI] [PubMed] [Google Scholar]
- 24.Kenworthy AK, Nichols BJ, Remmert CL, Hendrix GM, Kumar M, Zimmerberg J, Lippincott-Schwartz J. Dynamics of putative raft-associated proteins at the cell surface. J Cell Biol. 2004;165:735–746. doi: 10.1083/jcb.200312170. [DOI] [PMC free article] [PubMed] [Google Scholar]
- 25.Adler J, Shevchuk AI, Novak P, Korchev YE, Parmryd I. Plasma membrane topography and interpretation of single-particle tracks. Nat Methods. 2010;7:170–171. doi: 10.1038/nmeth0310-170. [DOI] [PubMed] [Google Scholar]
- 26.Schwarzenbacher M, Kaltenbrunner M, Brameshuber M, Hesch C, Paster W, Weghuber J, Heise B, Sonnleitner A, Stockinger H, Schutz GJ. Micropatterning for quantitative analysis of protein-protein interactions in living cells. Nature methods. 2008;5:1053–1060. doi: 10.1038/nmeth.1268. [DOI] [PubMed] [Google Scholar]
- 27.Sevcsik E, Brameshuber M, Folser M, Weghuber J, Honigmann A, Schutz GJ. GPI-anchored proteins do not reside in ordered domains in the live cell plasma membrane. Nat Commun. 2015;6:6969. doi: 10.1038/ncomms7969. [DOI] [PMC free article] [PubMed] [Google Scholar]
- 28.Löchte S, Waichman S, Beutel O, You C, Piehler J. Live cell micropatterning reveals the dynamics of signaling complexes at the plasma membrane. J Cell Biol. 2014;207:407–418. doi: 10.1083/jcb.201406032. [DOI] [PMC free article] [PubMed] [Google Scholar]
- 29.Bashour KT, Tsai J, Shen K, Lee JH, Sun E, Milone MC, Dustin ML, Kam LC. Cross talk between CD3 and CD28 is spatially modulated by protein lateral mobility. Mol Cell Biol. 2014;34:955–964. doi: 10.1128/MCB.00842-13. [DOI] [PMC free article] [PubMed] [Google Scholar]
- 30.Weghuber J, Brameshuber M, Sunzenauer S, Lehner M, Paar C, Haselgrubler T, Schwarzenbacher M, Kaltenbrunner M, Hesch C, Paster W, Heise B, et al. Detection of protein-protein interactions in the live cell plasma membrane by quantifying prey redistribution upon bait micropatterning. Methods Enzymol. 2010;472:133–151. doi: 10.1016/S0076-6879(10)72012-7. [DOI] [PubMed] [Google Scholar]
- 31.Saxton MJ. Anomalous diffusion due to obstacles: a Monte Carlo study. Biophys J. 1994;66:394–401. doi: 10.1016/s0006-3495(94)80789-1. [DOI] [PMC free article] [PubMed] [Google Scholar]
- 32.Saxton MJ. Two-Dimensional Continuum Percolation Threshold for Diffusing Particles of Nonzero Radius. Biophys J. 2010;99:1490–1499. doi: 10.1016/j.bpj.2010.06.033. [DOI] [PMC free article] [PubMed] [Google Scholar]
- 33.Saxton MJ. Anomalous diffusion due to binding: a Monte Carlo study. Biophys J. 1996;70:1250–1262. doi: 10.1016/S0006-3495(96)79682-0. [DOI] [PMC free article] [PubMed] [Google Scholar]
- 34.Small A, Stahlheber S. Fluorophore localization algorithms for super-resolution microscopy. Nat Meth. 2014;11:267–279. doi: 10.1038/nmeth.2844. [DOI] [PubMed] [Google Scholar]
- 35.Wieser S, Axmann M, Schutz GJ. Versatile analysis of single-molecule tracking data by comprehensive testing against Monte Carlo simulations. Biophysical journal. 2008;95:5988–6001. doi: 10.1529/biophysj.108.141655. [DOI] [PMC free article] [PubMed] [Google Scholar]
- 36.Torquato S. Random heterogeneous materials: microstructure and macroscopic properties. Springer Science & Business Media; 2013. pp. 102–103. [Google Scholar]
- 37.Quintanilla JA, Ziff RM. Asymmetry in the percolation thresholds of fully penetrable disks with two different radii. Physical Review E. 2007;76:051115. doi: 10.1103/PhysRevE.76.051115. [DOI] [PubMed] [Google Scholar]
- 38.Lin WC, Iversen L, Tu HL, Rhodes C, Christensen SM, Iwig JS, Hansen SD, Huang WY, Groves JT. H-Ras forms dimers on membrane surfaces via a protein-protein interface. Proc Natl Acad Sci U S A. 2014;111:2996–3001. doi: 10.1073/pnas.1321155111. [DOI] [PMC free article] [PubMed] [Google Scholar]
- 39.Pinaud F, Michalet X, Iyer G, Margeat E, Moore HP, Weiss S. Dynamic Partitioning of a Glycosyl-Phosphatidylinositol-Anchored Protein in Glycosphingolipid-Rich Microdomains Imaged by Single-Quantum Dot Tracking. Traffic. 2009;10:691–712. doi: 10.1111/j.1600-0854.2009.00902.x. [DOI] [PMC free article] [PubMed] [Google Scholar]
- 40.Lommerse PH, Blab GA, Cognet L, Harms GS, Snaar-Jagalska BE, Spaink HP, Schmidt T. Single-Molecule Imaging of the H-Ras Membrane-Anchor Reveals Domains in the Cytoplasmic Leaflet of the Cell Membrane. Biophys J. 2004;86:609–616. doi: 10.1016/S0006-3495(04)74139-9. [DOI] [PMC free article] [PubMed] [Google Scholar]
- 41.Goulian M, Simon SM. Tracking single proteins within cells. Biophys J. 2000;79:2188–2198. doi: 10.1016/S0006-3495(00)76467-8. [DOI] [PMC free article] [PubMed] [Google Scholar]
- 42.Ritchie K, Shan XY, Kondo J, Iwasawa K, Fujiwara T, Kusumi A. Detection of non-brownian diffusion in the cell membrane in single molecule tracking. Biophys J. 2005;88:2266–2277. doi: 10.1529/biophysj.104.054106. [DOI] [PMC free article] [PubMed] [Google Scholar]
- 43.Wieser S, Schütz GJ. Tracking single molecules in the live cell plasma membrane-Do's and Don't's. Methods. 2008;46:131–140. doi: 10.1016/j.ymeth.2008.06.010. [DOI] [PubMed] [Google Scholar]
- 44.Weghuber J, Sunzenauer S, Brameshuber M, Plochberger B, Hesch C, Schutz GJ. in-vivo detection of protein-protein interactions on micro-patterned surfaces. J Vis Exp. 2010;37 doi: 10.3791/1969. [DOI] [PMC free article] [PubMed] [Google Scholar]


