Abstract
The lymphatic system is essential for fluid regulation and for the maintenance of host immunity. However, in vivo lymph flow is difficult to track in real time, because of the lack of an appropriate imaging method. In this study, we combined macro-zoom fluorescence microscopy with quantum-dot (Qdot) optical lymphatic imaging to develop an in vivo real-time optical lymphatic imaging method that allows the tracking of lymph through lymphatic channels and into lymph nodes. After interstitial injection of Qdots in a mouse, rapid visualization of the cervical lymphatics and cervical lymph nodes was achieved. Real-time monitoring of the injected Qdots revealed that the cortex of the node enhanced first followed by a net-like pattern in the central portion of the node. Histology revealed that the rim and net-like enhancing regions corresponded to the subcapsular sinuses and medullary sinuses respectively. Additionally, multiplexed two-color real-time lymphatic tracking was performed with two different Qdots. With this real-time imaging system, we successfully tracked microscopic lymphatic flow in vivo. This method could have a potential impact for lymphatic research in visualizing normal or abnormal functional lymphatic flows. Published 2012. This article is a U.S. Government work and is in the public domain in the USA.
Keywords: lymphatic imaging, optical imaging, quantum dot
The lymphatic system maintains fluid homeostasis and host immunity, forming a very complex network throughout the body (1). The lymph fluid originates in the collector lymphatics, and transports the lymph via a combination of extrinsic compression, peristalsis and valves toward the lymph nodes, where lymph fluids are filtered to remove foreign material, such as bacteria and cancer cells. Cancer cells utilize this same pathway to metastasize to regional nodes (2,3). Lymphatic migration of cancer cells is strongly related to lymph fluid flow, thus interrupting this lymphatic pathway is a potential method to prevent lymph node metastasis (4–6). However, in vivo and real-time visualization of the lymphatics, especially at the microscopic level, is difficult since the lymphatics are difficult to access (1). In vivo optical lymphatic imaging is a recently established imaging method for visualizing lymphatic drainage after interstitial injection of fluorescent contrast agents, and it has been utilized in both basic and clinical research (7–10). Currently several fluorescent agents are available for optical lymphatic imaging, including quantum-dots (Qdots), which are composed of a semiconductor core most commonly made from Cd-Se or Cd-Te coated with a inorganic shell (e.g. ZnS). These nanocrystals have several desirable physical and optical features, including appropriate size, high quantum yields (bright) and excellent photo-and bio-stabilities (11–13). Moreover, Qdots are tunable, based on their size and structure, so that a narrow-width emission light can be generated across the visible and near-infrared spectrum depending on the size and doping characteristics of the nanocrystals. In this study, we developed a real-time lymphatic imaging system that combined Qdot optical lymphatic imaging in mice with an intravital macro-zoom fluorescence video microscope to track lymph flow into and within lymph nodes.
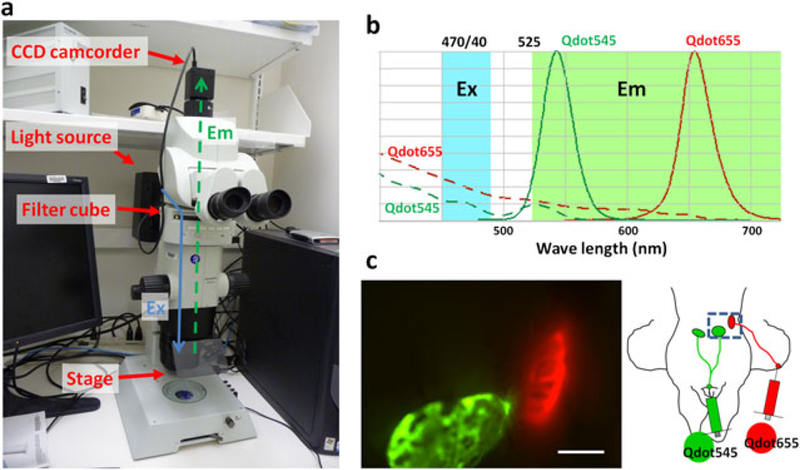
For this purpose, we constructed an in vivo real-time macro-zoom intravital fluorescence video imaging system (Fig. 1a). This system is based on a commercially available macro-zoom fluorescence microscope (MVX10 Macroview, Olympus America Inc., Melville, NY, USA) in which the charge-coupled device (CCD) video camera system (FluorVivo Mag, INDEC Biosystems, Santa Clara, CA, USA) was mounted. A macro-zoom microscope is ideal for in vivo real-time imaging during surgical intervention, since it provides enough working space as well as a wide range of magnifications from macro- (×2) tosubcellularimaging (×128) (14). Also, we installed a long-pass filter for emission light as well as a blue-range band pass filter for excitation light, instead of a band pass emission filter, which is commonly used in GFP filter cubes. Since emission profiles of Qdots can be tuned to emit a variety of colors using a single blue to green excitation light, this filter setting enables simultaneous multicolor real-time fluorescence imaging using at least two different Qdots of distinct colors (Fig. 1b, c, and Video 1 in Supporting Information).
Figure 1.

(a) In vivo multicolor real-time fluorescence macro-zoom imager. Ex and Em stand for excitation and emission light paths, respectively. (b) Spectrum of Qdot and the filter settings. Two different Qdots with differing wavelength can be simultaneously acquired in real time with blue-light excitation (Ex, 470/40 nm) and an emission long-pass (Em, 525 nm) filter set. (c) In vivo real-time fluorescence image of a mouse that received Qdot545 and 565 at the chin and right ear, respectively. Two different lymph nodes received different lymph flows, which are depicted by different colors in real time. Scale bar, 2 mm. Also see Video 1 in Supporting Information.
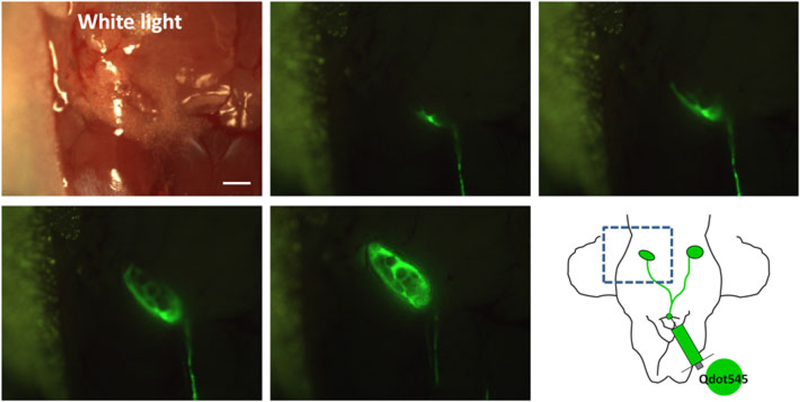
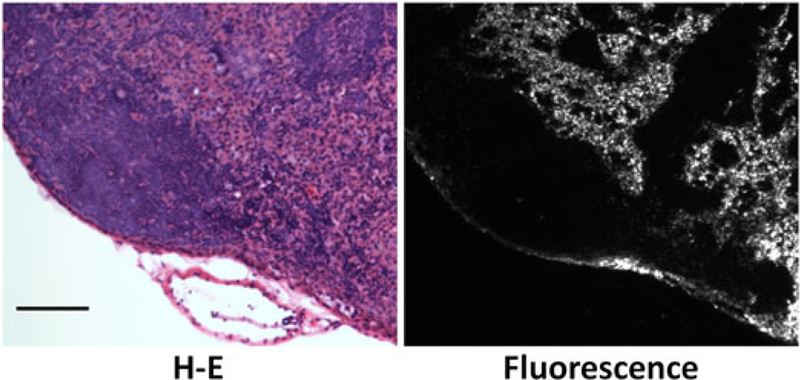
In vivo real-time microscopic lymph fluid tracking was performed. After interstitial injection of a solution containing a Qdot at the chin, lymphatic flow could rapidly be seen in the neck and cervical lymph nodes. This rapid lymphatic draining after interstitial injection is consistent with a previous report that demonstrated that subcutaneous injections of indocyanine green were visualized in the lymphatics within a minute of injection in humans (8). Qdots reaching the node spread along the rim of the lymph node, followed by a net-like pattern within the central lymph node (Fig. 2 and Video 2 in Supporting Information). Quantitative analysis confirmed this peripheral enhancement at early time points. The mean signal intensity of a region in the periphery of the lymph node (53.7± 16.9, mean ± SD) was statistically higher in signal than the mean signal intensity arising from the medullary portion of the node (43.1 ± 11.2) measured 10 s after arrival of the Qdots in the nodes (Wilcoxon matched-pairs signed-ranks test, p < 0.01). The mean peripheral/central signal intensity ratio (P/C) of each node was 1.24 ± 0.2, indicating that peripheral nodal enhancement was about 25% higher than that of the central node. Histological correlation of hematoxylin and eosin (H-E) staining and fluorescence microscopic images showed that the rim and net-like enhancements corresponded to the subcapsular sinuses and medullary sinuses of lymph nodes, respectively (Fig. 3).
Figure 2.

In vivo real-time lymphatic tracking in mice. The lymphatic and cervical lymph node are clearly depicted in real time. Rim and net-like enhancements are observed within the lymph node. Scale bar, 2 mm. Also see Video 2 in Supporting Information.
Figure 3.

H-E staining and fluorescence microscopic images of a cervical lymph node following injection of Qdot. Qdots are mainly distributed in the subcapsular sinuses and medullary sinuses. Scale bar, 100 μm.
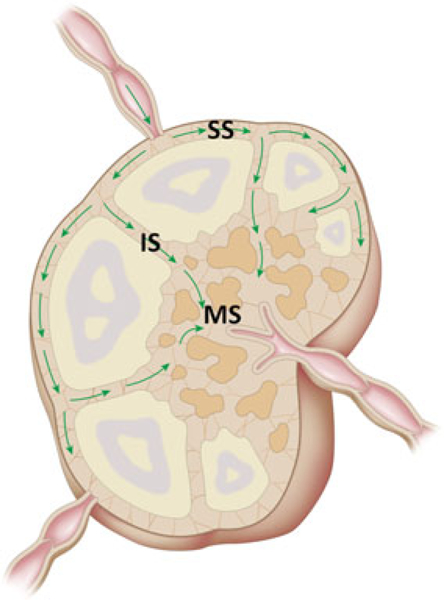
It has been established that afferent lymphatics drain into the periphery of a lymph node, while efferent lymphatics emerge from the hilum at the center of the lymph node (15). More recently, Ohtani et al. recorded lymphatic flow within rat lymph nodes using a fluorescent tracer and confocal microscopy (16). After entering the lymph node, there is initial filling of the subcapsular sinus followed by flow into deeper areas via intermediate sinuses and lymphatic labyrinths in the paracortical zone, eventually draining into the deep cortex and medullary sinuses. However, dynamic microscopy of lymph fluid movement in vivo has not been achieved owing to the lack of appropriate real-time imaging methods and agents. In this study, in vivo real-time optical lymphatic tracking clearly showed that the lymph fluid containing Qdots was taken up by lymphatics after interstitial injection and rapidly entered lymph nodes. Lymph fluid entered at the periphery of the lymph node and spread along the subcapsular sinus before flowing into deeper structures of the lymph node, such as the medullary sinuses (Fig. 4) (16). This subcapsular accumulation was also seen with labeled cancer cells injected interstitially in mice, albeit at a much slower rate (9,17). In a tumor model, the subcapsular sinus appeared to be larger than normal, suggesting that nodal lymphangiogenesis had occurred (9). Interestingly, in the real time video shown in this study, the subcapsular sinus temporally widened when the Qdots arrived, indicating that the effect is hydrostatic rather than biologic. Therefore, the subcapsular sinus is minimized most of the time, probably because of negative pressure in the lymphatic system: however, it has the capacity to expand, receive and temporarily store the lymphatic fluid when pressures are increased. Previous reports revealed that fluorescent protein or fluorophore-labeled cancer cell tracking is feasible in the lymphatic system (9,18–20). The method described herein could be used to explore the relationship between cancer cell migration and dynamic changes within the lymphatics and nodes.
Figure 4.

Schematic illustration of lymph flow observed in this study. Lymph fluids enter the periphery of the lymph node and spread along sub-capsular sinuses before entering into deeper areas, such as the medullary sinuses. SS, subcapsular sinus: IS, intermediate sinus: MS, medullary sinus.
Ideally, a fluorescent agent for lymphatic imaging should meet several criteria: (a) it must quickly drain into the lymphatic system after interstitial injection: (b) it must have high enough quantum yield (brightness) to permit fast (milliseconds) signal acquisition: and (c) it must be sufficiently photo-stable to enable continuous observation. Qdots are desirable contrast materials for real-time lymphatic imaging, having an ideal size (around 10 nm) (21) and high quantum yield with excellent photo- and bio-stability (11). Additionally, since different Qdots can emit several different colors after a single exposure with blue to green-range excitation, real-time multicolor imaging can be performed using a long-pass emission filter as described in Fig. 1. Multiple (>2) color imaging can be performed as shown in a previous macroscopic imaging study (22). In vivo multicolor imaging is a potentially robust tool in biological research to visualize cancer cell-host interactions (9,23–25).
Histology reveals that, when Qdots are used, they are trapped by macrophages inside lymph nodes (22). Thus, outflow of the lymphatic fluid from the lymph node was not observed in our study. PEG-coated Qdots, although a little larger than the Qdot employed in this study, might evade the reticulo-endothelial system, enabling visualization of efferent lymphatics as well as afferent lymphatics and their nodes. The toxicity of Qdots is a major concern, especially for in vivo human use, since most of the current Qdots are based on heavy metal cores (Cd-Se, Cd-Te, etc.). The bare metal core of Qdots has been reported to be cytotoxic, a process mediated by reactive oxygen species and the release of cadmium ions (26). PEG-coated Qdots have been reported to reduce their cytotoxicity (27). Moreover, smaller Qdots below 6 nm in diameter have been reported to be cleared through the kidney and rapidly excreted into the urine (28), and cadmium-free Qdot formulations have been produced while maintaining their desirable fluorescence properties (29).
In conclusion, we successfully tracked microscopic lymphatic flow in vivo using a real-time fluorescence macro-zoom imaging system in conjunction with injected Qdots. This method enabled real-time observation of lymph flow in vivo and enabled subtle visualization of lymphatic flow. This could have a considerable potential in lymphatic research where real-time observation of lymphatic flow could be important for determining how immune processing takes place.
1. EXPERIMENTAL
All procedures were approved by the National Cancer Institute Animal Care and Use Committee. Female nude mice (National Cancer Institute Animal Production Facility, Frederick, MD, USA) were anesthetized via intraperitoneal injection of 1.15 mg sodium pentobarbital (Nembutal Sodium Solution, Ovation Pharmaceuticals Inc., Deerfield, IL. USA), and the skin over cervical lymph nodes was removed. They were then placed on a macro-zoom fluorescence microscope (MVX10 Macroview, Olympus America, Inc., Melville, NY, USA) in the supine position. Fluorescence images were obtained using a GFP filter setting (excitation 470/40 nm, emission 525 nm long-pass). All procedures were recorded in real time with a CCD video camera system (FluorVivo Mag, INDEC Biosystems, Santa Clara, CA, USA) installed in the macro-zoom fluorescence microscope (Fig. 1). While recording fluorescence images of mice, 1.6 μM of Qdot545 ITK (Invitrogen, Co., Carlsbad, CA, USA) was intracutaneously injected at the chin of the mouse, and realtime recording continued for about 3–4 min after injection. For the two-color study, 0.8 μM of Qdot655 ITK (Invitrogen, Co.) was intracutaneously injected near the right ear of the same mouse, and additional fluorescence images were recorded for 3–4 min after the second Qdot injection. After in vivo image acquisition, mice were euthanized with carbon dioxide, and the cervical lymph nodes of each mouse were harvested, and then subjected to histological validation with H-E staining and fluorescence microscopy (BX61, Olympus America, Inc.). These experiments were repeated four times and showed consistent results in all mice.
For quantitative analysis, florescence images of each lymph node were obtained 10 s after the arrival of the Qdots. Raw images were converted into 8-bit gray-scale images. All fluorescence images were analyzed with ImageJ software (http://rsbweb.nih.gov/ij). Linear regions of interest were placed on the short and long axes of each lymph node. The outer 10% of the node was defined as the periphery and the central 80% segment was defined as the central lesion (C). Mean signal intensities of the P and C, as well as central/peripheral signal intensity ratios (C/P ratios) were calculated for each lymph node (30).
Supplementary Material
Acknowledgments
This research was supported by the Intramural Research Program of the National Institutes of Health, National Cancer Institute, Center for Cancer Research.
Footnotes
Supporting Information
Supporting information can be found in the online version of this article.
Supporting information may be found in the online version of this paper
REFERENCES
- 1.Barrett T, Choyke PL, Kobayashi H. Imaging of the lymphatic system: new horizons. Contrast Media Mol Imag 2006: 1(6): 230–245. [DOI] [PubMed] [Google Scholar]
- 2.Rizk N, Venkatraman E, Park B, Flores R, Bains MS, Rusch V. The prognostic importance of the number of involved lymph nodes in esophageal cancer: implications for revisions of the American Joint Committee on Cancer staging system. J Thorac Cardiovasc Surg 2006: 132(6): 1374–1381. [DOI] [PubMed] [Google Scholar]
- 3.Singletary SE, Connolly JL. Breast cancer staging: working with the sixth edition of the AJCC Cancer Staging Manual. CA Cancer J Clin 2006: 56(1): 37–47: quiz 50–31. [DOI] [PubMed] [Google Scholar]
- 4.Hoshida T, Isaka N, Hagendoorn J, di Tomaso E, Chen YL, Pytowski B, Fukumura D, Padera TP, Jain RK. Imaging steps of lymphatic metastasis reveals that vascular endothelial growth factor-C increases metastasis by increasing delivery of cancer cells to lymph nodes: therapeutic implications. Cancer Res 2006: 66(16): 8065–8075. [DOI] [PubMed] [Google Scholar]
- 5.Karpanen T, Egeblad M, Karkkainen MJ, Kubo H, Yla-Herttuala S, Jaattela M, Alitalo K. Vascular endothelial growth factor C promotes tumor lymphangiogenesis and intralymphatic tumor growth. Cancer Res 2001: 61(5): 1786–1790. [PubMed] [Google Scholar]
- 6.Stacker SA, Achen MG, Jussila L, Baldwin ME, Alitalo K. Lymphangio-genesis and cancer metastasis. Nat Rev Cancer 2002: 2(8): 573–583. [DOI] [PubMed] [Google Scholar]
- 7.Hoffman RM. Imaging cancer dynamics in vivo at the tumor and cellular level with fluorescent proteins. Clin Exp Metastasis 2009: 26(4): 345–355. [DOI] [PubMed] [Google Scholar]
- 8.Kitai T, Inomoto T, Miwa M, Shikayama T. Fluorescence navigation with indocyanine green for detecting sentinel lymph nodes in breast cancer. Breast Cancer 2005:12(3): 211–215. [DOI] [PubMed] [Google Scholar]
- 9.Kobayashi H, Ogawa M, Kosaka N, Choyke PL, Urano Y. Multicolor imaging of lymphatic function with two nanomaterials: quantum dot-labeled cancer cells and dendrimer-based optical agents. Nanomedicine (London) 2009: 4(4): 411–419. [DOI] [PMC free article] [PubMed] [Google Scholar]
- 10.Sevick-Muraca EM, Sharma R, Rasmussen JC, Marshall MV, Wendt JA, Pham HQ, Bonefas E, Houston JP, Sampath L, Adams KE, Blanchard DK, Fisher RE, Chiang SB, Elledge R, Mawad ME. Imaging of lymph flow in breast cancer patients after microdose administration of a near-infrared fluorophore: feasibility study. Radiology 2008: 246(3): 734–741. [DOI] [PMC free article] [PubMed] [Google Scholar]
- 11.Kosaka N, McCann TE, Mitsunaga M, Choyke PL, Kobayashi H. Real-time optical imaging using quantum dot and related nanocrystals. Nanomedicine (London) 2010: 5(5): 765–776. [DOI] [PMC free article] [PubMed] [Google Scholar]
- 12.Ballou B, Ernst LA, Andreko S, Harper T, Fitzpatrick JA, Waggoner AS, Bruchez MP. Sentinel lymph node imaging using quantum dots in mouse tumor models. Bioconjug Chem 2007: 18(2): 389–396. [DOI] [PubMed] [Google Scholar]
- 13.Kim S, Lim YT, Soltesz EG, De Grand AM, Lee J, Nakayama A, Parker JA, Mihaljevic T, Laurence RG, Dor DM, Cohn LH, Bawendi MG, Frangioni jV. Near-infrared fluorescent type II quantum dots for sentinel lymph node mapping. Nat Biotechnol 2004: 22(1): 93–97. [DOI] [PMC free article] [PubMed] [Google Scholar]
- 14.Kimura H, Momiyama M, Tomita K, Tsuchiya H, Hoffman RM. Long-working-distance fluorescence microscope with high-numerical-aperture objectives for variable-magnification imaging in live mice from macro- to subcellular. J Biomed Opt 2010: 15(6): 066029. [DOI] [PubMed] [Google Scholar]
- 15.Rosai J Ackerman’s Surgical Pathology. Mosby Year Book: St Louis, MO, 1996: 1661–1662. [Google Scholar]
- 16.Ohtani O, Ohtani Y, Carati CJ, Gannon BJ. Fluid and cellular pathways of rat lymph nodes in relation to lymphatic labyrinths and Aquaporin-1 expression. Arch Histol Cytol 2003: 66(3): 261–272. [DOI] [PubMed] [Google Scholar]
- 17.Kosaka N, Bernardo M, Mitsunaga M, Choyke PL, Kobayashi H. MR and optical imaging of early micrometastases in lymph nodes: triple labeling with nano-sized agents yielding distinct signals. Contrast Media Mol Imag 2012: 7(2): 247–253. [DOI] [PMC free article] [PubMed] [Google Scholar]
- 18.Hayashi K, Jiang P, Yamauchi K, Yamamoto N, Tsuchiya H, Tomita K, Moossa AR, Bouvet M, Hoffman RM. Real-time imaging of tumor-cell shedding and trafficking in lymphatic channels. Cancer Res 2007: 67 (17): 8223–8228. [DOI] [PubMed] [Google Scholar]
- 19.McElroy M, Bouvet M, Hoffman RM. Chapter 2. Color-coded fluorescent mouse models of cancer cell interactions with blood vessels and lymphatics. Meth Enzymol 2008: 445: 27–52. [DOI] [PubMed] [Google Scholar]
- 20.McElroy M, Hayashi K, Garmy-Susini B, Kaushal S, Varner JA, Moossa AR, Hoffman RM, Bouvet M. Fluorescent LYVE-1 antibody to image dynamically lymphatic trafficking of cancer cells in vivo. J Surg Res 2009: 151(1): 68–73. [DOI] [PMC free article] [PubMed] [Google Scholar]
- 21.Kobayashi H, Kawamoto S, Bernardo M, Brechbiel MW, Knopp MV, Choyke PL. Delivery of gadolinium-labeled nanoparticles to the sentinel lymph node: comparison of the sentinel node visualization and estimations of intra-nodal gadolinium concentration by the magnetic resonance imaging. J Control Release 2006: 111(3): 343–351. [DOI] [PubMed] [Google Scholar]
- 22.Kosaka N, Ogawa M, Sato N, Choyke PL, Kobayashi H. In vivo realtime, multicolor, quantum dot lymphatic imaging. J Invest Dermatol 2009: 129(12): 2818–2822. [DOI] [PMC free article] [PubMed] [Google Scholar]
- 23.Hoffman RM. The multiple uses of fluorescent proteins to visualize cancer in vivo. Nat Rev Cancer 2005: 5(10): 796–806. [DOI] [PubMed] [Google Scholar]
- 24.Hoffman RM, Yang M. Color-coded fluorescence imaging of tumor-host interactions. Nat Protoc 2006: 1(2): 928–935. [DOI] [PubMed] [Google Scholar]
- 25.Kosaka N, Ogawa M, Longmire MR, Choyke PL, Kobayashi H. Multitargeted multi-color in vivo optical imaging in a model of disseminated peritoneal ovarian cancer. J Biomed Opt 2009:14(1): 014023. [DOI] [PMC free article] [PubMed] [Google Scholar]
- 26.Kirchner C, Liedl T, Kudera S, Pellegrino T, Munoz Javier A, Gaub HE, Stolzle S, Fertig N, Parak WJ. Cytotoxicity of colloidal CdSe and CdSe/ ZnS nanoparticles. Nano Lett 2005: 5(2): 331–338. [DOI] [PubMed] [Google Scholar]
- 27.Ballou B Quantum dot surfaces for use in vivo and in vitro. Curr Top Dev Biol 2005: 70: 103–120. [DOI] [PubMed] [Google Scholar]
- 28.Choi HS, Liu W, Misra P, Tanaka E, Zimmer JP, Itty Ipe B, Bawendi MG, Frangioni JV. Renal clearance of quantum dots. Nat Biotechnol 2007: 25(10): 1165–1170. [DOI] [PMC free article] [PubMed] [Google Scholar]
- 29.Kim SW, Zimmer JP, Ohnishi S, Tracy JB, Frangioni JV, Bawendi MG. Engineering InAs(x)P(1 - x)/InP/ZnSe III-V alloyed core/shell quantum dots for the near-infrared. J Am Chem Soc 2005: 127(30): 10526–10532. [DOI] [PubMed] [Google Scholar]
- 30.Kosaka N, Ogawa M, Paik DS, Paik CH, Choyke PL, Kobayashi H. Semiquantitative assessment of the microdistribution of fluorescence-labeled monoclonal antibody in small peritoneal disseminations of ovarian cancer. Cancer Sci 2010: 101(3): 820–825. [DOI] [PMC free article] [PubMed] [Google Scholar]
Associated Data
This section collects any data citations, data availability statements, or supplementary materials included in this article.


