

Abstract
IMPORTANCE
The Affordable Care Act Medicaid expansion may be associated with reduced mortality, but evidence to date is limited. Patients with end-stage renal disease (ESRD) are a high-risk group that may be particularly affected by Medicaid expansion.
OBJECTIVE
To examine the association of Medicaid expansion with 1-year mortality among nonelderly patients with ESRD initiating dialysis.
DESIGN, SETTING, AND PARTICIPANTS
Difference-in-differences analysis of nonelderly patients initiating dialysis in Medicaid expansion and nonexpansion states from January 2011 to March 2017.
EXPOSURE
Living in a Medicaid expansion state.
MAIN OUTCOMES AND MEASURES
The primary outcome was 1-year mortality. Secondary outcomes were insurance, predialysis nephrology care, and type of vascular access for hemodialysis.
RESULTS
A total of 142 724 patients in expansion states (mean age, 50.2 years; 40.2% women) and 93 522 patients in nonexpansion states (mean age, 49.7; 42.4% women) were included. In Medicaid expansion states, 1-year mortality following dialysis initiation declined from 6.9% in the preexpansion period to 6.1% after expansion (change, −0.8 percentage points; 95% CI, −1.1 to −0.5). In nonexpansion states, mortality rates were 7.0% before expansion and 6.8% after expansion (change, −0.2 percentage points; 95% CI, −0.5 to 0.2), yielding an adjusted absolute reduction in mortality in expansion states of −0.6 percentage points (95% CI, −1.0 to −0.2). Mortality reductions were largest for black patients (−1.4 percentage points; 95% CI, −2.2, −0.7; P=.04 for interaction) and patients aged 19 to 44 years (−1.1 percentage points; 95% CI, −2.1 to −0.3; P=.01 for interaction). Expansion was associated with a 10.5-percentage-point (95% CI, 7.7–13.2) increase in Medicaid coverage at dialysis initiation, a −4.2-percentage-point (95% CI, −6.0 to −2.3) decrease in being uninsured, and a 2.3-percentage-point (95% CI, 0.6–4.1) increase in the presence of an arteriovenous fistula or graft. Changes in predialysis nephrology care were not significant.
CONCLUSIONS AND RELEVANCE
Among patients with ESRD initiating dialysis, living in a state that expanded Medicaid under the Affordable Care Act was associated with lower 1-year mortality. If this association is causal, further research is needed to understand what factors may have contributed to this finding.
The Affordable Care Act (ACA) expanded Medicaid eligibility to nonelderly citizens and permanent residents with incomes below 138% of the federal poverty level in participating states. As of September 2018, 33 states and Washington, DC, had adopted Medicaid expansion, while 17 states had not.1 These expansions have been associated with improved coverage, access to care, preventive care, and in some studies, self-rated health.2–5
Research examining Medicaid’s effects on physical health outcomes has yielded conflicting findings. A randomized trial of Medicaid coverage in Oregon failed to detect statistically significant 2-year changes in glycosylated hemoglobin, blood pressure, or cholesterol levels,6 while 2 studies reported significant declines in mortality following Medicaid expansions in the early 2000s and Massachusetts health reform in 2006.7,8 Some policy observers have cited uncertainty about the effects of insurance to claim that the ACA could be scaled back without serious health consequences.9 Most studies on the ACA have focused on population-wide changes in health outcomes; however, expanded coverage may disproportionately affect populations with serious chronic illnesses.
Compared with the general population, persons with end- stage renal disease (ESRD) experience increased morbidity and mortality, lost productivity, and impaired quality of life.10 Access to effective predialysis care can improve survival, but many patients receive little or no nephrology care before starting dialysis.10,11 Furthermore, although Medicare provides insurance to most patients requiring dialysis, coverage does not typically begin until the fourth month of dialysis.12 Prior to Medicaid expansion, up to one-fifth of nonelderly patients lacked insurance coverage when initiating dialysis.10,13 Being uninsured is associated with inadequate access to recommended predialysis care, underdiagnosis of diabetes and hypertension (the 2 leading causes of ESRD), and undertreatment of cardiovascular disease.13–15
This study examined the association of the ACA Medicaid expansions with mortality, insurance coverage, and predialysis nephrology care for patients with ESRD initiating dialysis.
Methods
Study Design
Brown University’s institutional review board and the Centers for Medicare & Medicaid Services (CMS) Privacy Board approved the study protocol and waived the need for informed consent. We conducted a difference-in-differences study that examined changes in outcomes among new dialysis patients in states that expanded Medicaid eligibility under the ACA compared with changes among patients in nonexpansion states. The study period extended from January 1, 2011, to March 31, 2017. We defined the postexpansion period for each state based on its own implementation date (eAppendix in the Supplement).
Data Sources and Study Population
We obtained data from the CMS Renal Management Information System (REMIS). Incident patients were identified from the ESRD Medical Evidence Form (CMS 2728), which is included in the REMIS data (eAppendix in the Supplement) The CMS 2728 form provides evidence of a diagnosis of ESRD for Medicare eligibility and “demographic and diagnostic information for all new ESRD patients regardless of Medicare entitlement.”16 CMS requires the form to be completed for all newly diagnosed patients with ESRD at the time of receiving the first maintenance dialysis treatment or transplant, including those who do not have current Medicare coverage and those who do not anticipate applying for future Medicare coverage. The form is not collected for patients with acute kidney injury who are treated with dialysis. Information on timing and cause of death was obtained from the ESRD Death Notification (CMS 2746). CMS requires that the dialysis facility last responsible for a patient’s maintenance dialysis submit the form within 2 weeks of the date of death.
The study population included all US patients aged 19 to 64 years who initiated dialysis (either hemodialysis or peritoneal dialysis) during the study period, with the exception of 69 529 patients with Medicare coverage (without Medicaid), 40 758 patients with dual Medicare-Medicaid coverage, and 4125 patients with Veterans Affairs (VA) coverage without Medicare. Sensitivity analyses included those with Medicare and VA coverage. Further descriptions of the outcomes and number of patients for secondary outcomes are provided in the eAppendix, eFigure 1, and eTable 1 in the Supplement.
Measures
The primary outcome was whether a patient died during a 1-year period beginning with the 91st day following the initiation of dialysis. This approach is consistent with that used by the US Renal Data System because deaths among incident patients are not reliably reported within the first 90 days following dialysis initiation.10,16,17
Four secondary outcomes were Medicaid coverage, being uninsured, predialysis receipt of care from a nephrologist, and presence of an arteriovenous fistula or graft (either viable or maturing) during the first outpatient treatment session. Analyses of the presence of an arteriovenous fistula or graft were limited to patients starting hemodialysis. The primary independent variable was an interaction between residing in a Medicaid expansion state and initiating dialysis after that state expanded Medicaid.
Covariates included age, sex, race/ethnicity (non-Hispanic white, non-Hispanic black, Hispanic, or other) as reported in REMIS data, primary cause of ESRD (diabetes, hypertension, or other), comorbid conditions, current smoking, alcohol dependence, hemoglobin level, serum albumin level, body mass index, and proportion of persons living in the patient’s census tract or zip code with income below the federal poverty level. The dialysis facility collected and reported information on race/ethnicity using fixed categories in the CMS 2728 form. Race/ethnicity was included in the study to adjust for changes in the demographic composition of states over time and to conduct stratified analyses of the association of expansion with health outcomes. To obtain information on area-level poverty, patients’ residential addresses were geocoded to census tracts using ArcGIS spatial mapping software, version 10.5.1 (ESRI). The 2009–2013 American Community Survey provided the poverty rate in each patient’s census tract. For 13.2% of patients who could not be geocoded to a census tract but for whom zip codes were available, we used zip code–level poverty as measured in the 2010 US Census.
Statistical Analysis
We constructed multivariable generalized linear regression models with Huber-White robust standard errors clustered at the state level to account for the state-level correlation and potential serial autocorrelation.18 All models included state and year-month fixed effects and specified a binomial outcome distribution with identity link function. For observations with missing covariates, we used the mean value of the covariates on the nonmissing observations. Further descriptions of the regression specification and alternative approaches to handling missing data are described in the eAppendix in the Supplement. Exploratory subgroup analyses by age, race/ethnicity, and area-level poverty rates tested the significance of 3-way interactions among expansion status, postexpansion time period, and each aforementioned subgroup. Similarly, interactions between state and postexpansion time period yielded state-level adjusted changes. The number needed to treat (NNT), defined as the absolute change in insurance coverage divided by the absolute change in 1-year mortality, was calculated.
Sensitivity Analyses
The following analyses assessed the validity of the difference-in-differences study design and tested the sensitivity of the estimates to alternative study populations and time periods. First, an analysis confirmed that pre-ACA outcomes were parallel in expansion and nonexpansion states by testing the significance of an expansion-by-time indicator for the pre-2014 data. Second, to examine whether the com- position of patients with end-stage renal disease changed differentially after expansion (ie, whether coverage expansion was associated with a change in which patients initiated dialysis, and how far along in their disease trajectory), additional difference-in-differences models estimated the following outcomes: the log of the number of incident patients, prevalence of comorbid conditions, peritoneal dialysis rates,19 and estimated glomerular filtration rate, a measure of kidney function, at dialysis initiation.
Third, we excluded states that had expanded Medicaid to many nonelderly adults prior to 2014, following previous research.3 Fourth, because deaths among patients initiating dialysis are particularly undercounted in the first 42 days, an analysis of 1-year mortality beginning on the 43rd day after dialysis initiation was conducted.17 Fifth, observations for 15 months before and 6 months after expansion were excluded, treating them as transitional periods. Sixth, an analysis examined deaths for conditions amenable and not amenable to health care.7,8 Seventh, we examined changes for nonelderly persons with Medicare, dual Medicare-Medicaid, and VA coverage, who should not have been affected by the ACA Medicaid expansions. All analyses used 2-tailed testing with a significance threshold of P < .05 and were conducted using Stata version 14.2 (StataCorp). Because of the potential for type 1 error due to lack of adjustment in the significance threshold for the secondary end points, these findings should be interpreted as exploratory.
Results
Study Population
The study population included 236 246 patients; of this total, 142 724 were in expansion states (mean age, 50.2 years [SD, 10.8 years]; 40. 2% women; 27.4% black; 21.0% Hispanic) and 93 522 were in nonexpansion states (mean age, 49.7 years [SD, 10.8 years]; 42.4% women; 40.2% black; 17.8% Hispanic) (Table 1). The expansion state population was more likely to have diabetes and less likely to have hypertension as the primary cause of ESRD and differed in the prevalence of several common comorbidities. The 2013 income eligibility levels for Medicaid were higher and the rates of uninsurance for persons aged 19 to 64 years were lower in expansion states compared with nonexpansion states. Analyses of mortality were restricted to 180 044 patients who initiated dialysis before January 1, 2016, to ascertain deaths that occurred for up to 15 months after dialysis initiation (eTable 1 and eFigure 1 in the Supplement).
Table 1.
Characteristics of Nonelderly Patients Initiating Dialysis by State Medicaid Expansion Statusa
| Characteristics | Expansion Sutes | Nonexpansion Sutes |
|---|---|---|
| Patient characteristics | ||
| No. of patients | 142 724 | 93522 |
| Age. mean (SD).y | 50.2(10.8) | 49.7(10.8) |
| Female sex | 40.2 | 42.4 |
| Male set | 59.8 | 57.6 |
| Race/etnnsclty | ||
| Non-Hispanic white | 41.3 | 38.0 |
| Non-Hispanic Dlack | 27.4 | 40.2 |
| Hispanic | 21.0 | 17.8 |
| Otherb | 10.3 | 4.0 |
| Primary cause of end-stage renal disease | ||
| Diabetes | 33.4 | 32.4 |
| Hypertension | 18.2 | 21.9 |
| Other or uncertain | 48.4 | 45.7 |
| Comorbid conditions | ||
| Congestive heart failure | 19.0 | 19.4 |
| Atherosclerotic heart disease | 8.4 | 7.3 |
| Other cardiac disease | 10.6 | 11.4 |
| Hypertension | 86.2 | 88.6 |
| Diabetes | 52.2 | 53.3 |
| Diabetic retinopathy | 8.8 | 7.8 |
| Cancer | 3.8 | 3.5 |
| Current smoker | 7.6 | 9.0 |
| Alcohol dependence | 2.4 | 2.3 |
| Hemoglobin, mean (SD),g/dLc | 9.3 (1.6) [86.9%] | 9.3(1.6)185.0X1 |
| Serum albumin, mean (SD), g/dLd | 3.2 (0.6) [69.7%] | 3.2 (0.6) [69.6X1 |
| Obese (BMI>30),%e | 38.3 [9S.6X] | 42.1 [94.8X1 |
| Area-level poverty,%(SD)f,g | 18.1 (12.1) [98.3X] | 18.9(11.6) [97.9X] |
| State-level characteristics | ||
| No. of states | 31 + DC | 19 |
| Income eligibility for Medicaid coverage among parentsin2013,%of federal poverty level, mean(IQR)h | 102 (57–139) | 64(31–89) |
| Income eligibility for other nondisabled adults in2013,%of federal poverty level,mean(IQR)h | 30(0–70) | 0(0–0) |
| Uninsurance rate for person saged 19–64 y In 2013,%mean(IQR)h | 16 (12–20) | 19(13–22) |
Abbreviation: IQR, interquartile range.
Data are expressed as percentages unless otherwise indicated.
Asian, American Indian/Alaska Native, or Native Hawaiian/other Pacific Islander.
Data in brackets are percentage of patients for whom hemoglobin data were available.
Data in brackets are percentage of patients for whom serum albumin data were available.
Data in brackets are percentage of patients for whom body mass index (BMI) data were available. Calculated as weight in kilograms divided by height in meters squared.
Data in brackets are percentage of persons in patient’s census tract or zip code with income below the federal poverty limit. The reported value is the mean area-level percentage for all patients.
Data in brackets are percentage of patients for whom area-level poverty was available.
Derived from Kaiser Family Foundation State Health Facts (https://www.kff.org/about-state-health-facts/; accessed September 14, 2018).
Primary End Point
Figure 1 plots unadjusted trends in mortality by expansion status. Mortality rates were similar in expansion and nonexpansion states prior to 2014 and then diverged, with declines in mortality rates beginning in the first 6 months of 2014.
Figure 1. Trends in 1-Year Mortality Among Nonelderly Adults Initiating Dialysis, by State Medicaid Expansion Status.
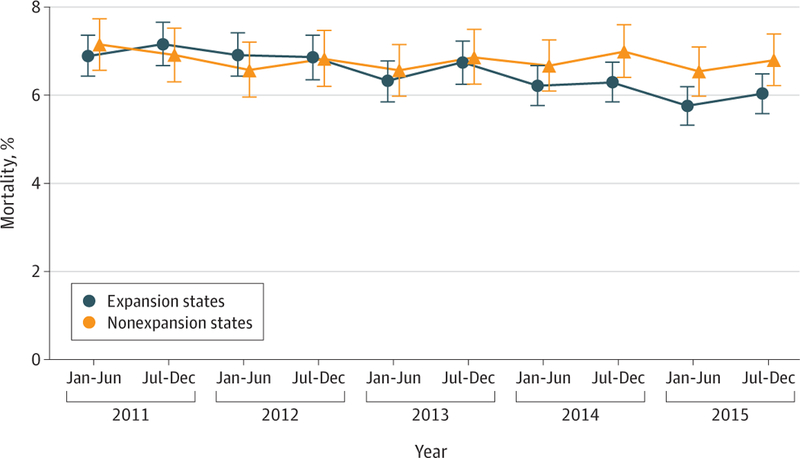
Mortality rates were measured from the 91st day following dialysis initiation for all patients who started dialysis during the specified half-year periods. For each half-year period, the population ranged from a maximum of 11 260 patients to a minimum of 9547 patients for expansion states and from a maximum of 7592 patients to a minimum of 6191 patients for nonexpansion states. Expansion states were restricted to those that expanded Medicaid beginning January 1, 2014. Error bars indicate 95%CIs.
In Medicaid expansion states, 1-year mortality following dialysis initiation declined from 6.9% in the preexpansion period to 6.1% after expansion (change, −0.8 percentage points; 95% CI, −1.1 to −0.5). In nonexpansion states, mortality rates were 7.0% before expansion and 6.8% after expansion (change, −0.2 percentage points; 95% CI, −0.5 to 0.2), yielding an adjusted absolute reduction in mortality in expansion states of −0.6 percentage points (95% CI, −1.0 to −0.2) and a relative mortality reduction of 8.5% (Table 2; see eTable 2 in the Supplement for unadjusted estimates). These difference-in-differences estimates were similar with and without multivariable adjustment.
Table 2.
Changes in Insurance Coverage, Nephrology Care, and Mortality Among Nonelderly Adults Initiating Dialysis After the Affordable Care Act Medicaid Expansiona
| Outcomes | Expansion States |
Nonet pins wi States |
Adjusted Difference-in-Differences Estimate. Percentage Pants (95% Cl) | ||||
|---|---|---|---|---|---|---|---|
| Baseline Rate,% | Postexpansion Rate,% | Change After Expansion, Percentage Points (95% Cl) | Baseline Rate.% | Postexpansion Rate.% | Change After Expansion, Percentage Ports (95% Cl) | ||
| Medicaid coverage | 35.3 | 46.0 | 10.7 (10.2 to 11.2) | 25.6 | 24.7 | −0.9 (−1.4 to −0.4) | 10.5 (7.7 to 13.2) |
| Uninsurance | 15.9 | 6.6 | −9.3 (−9.6 to −9.0) | 29.1 | 23.5 | −5.5 (−6.1 to −5.0) | −4.2 (−6.0 to-2.3) |
| Receipt of Nephrology care Prior to dialysis | 64.0 | 69.0 | 5.1 (4.510 5.6) | 61.0 | 65.5 | 4.5(3310 5.1) | 1.0 (−0.1 to 2.1) |
| Arteriovenous fistula Or graft present | 36.0 | 36.3 | 0.4 (−0 1 to 0.9) | 34.2 | 32.1 | −2.2 (−2.9 to-1.5) | 2.3 (0.6 to 4.1) |
| 1-yAll-cause mortality | 6.9 | 6.1 | −0.8 (−1.1 to −0.5) | 7.0 | 6.8 | −0.2 (−0.5 to 03) | −0.6 (−1.0 to-0.2) |
Percentage data are percentage of all patients initiating dialysis who met criteria for the relevant primary or secondary end point. All 95%CIs are derived from generalized linear regression models with Huber-White robust standard errors clustered at the state level.
Unadjusted trends in 1-year mortality rates by age, race, and area-level poverty are shown in eFigure 2 in the Supplement. Table 3 shows adjusted difference-in-differences estimates for mortality by subgroup. Adults aged 19 to 44 years experienced larger reductions in 1-year mortality (−1.1 percentage points; 95% CI, −2.1 to −0.3) than those aged 45 to 64 years (−0.5 percentage points; 95% CI, −0.9 to −0.1; P = .01 for interaction). There were larger declines in 1-year mortality following Medicaid expansion among black patients (−1.4 percentage points; 95% CI, −2.2 to −0.7) compared with white patients (−0.5 percentage points; 95% CI, −1.2 to 0.2; P = .04 for interaction). Adjusted mortality changes were not statistically different for Hispanic patients compared with white patients or for patients living in areas with poverty rates above vs below the median area-level poverty rate, with the median level defined by the distribution in the study population.
Table 3.
Changes in 1-Year Mortality Among Nonelderly Adults Initiating Dialysis After the Affordable Care Act Medicaid Expansion, by Age, Race/Ethnicity, and Area-Level Poverty Rate
| Characteristics | Expansion States |
Nonexpansion States |
Adjusted Difference- in-Differences Estimate, Percentage Points (95% CI)b | P Valuec | ||||
|---|---|---|---|---|---|---|---|---|
| Baseline Rate, %a | Postexpansion Rate, %a | Change After Expansion, Percentage Points (95% CI) | Baseline Rate, %a | Postexpansion Rate, %a | Change After Expansion,Percentage Points (95% CI) | |||
| Age, y | ||||||||
| 19–44 | 4.1 | 3.5 | −0.6 (−1.0 to 0.2) | 4.3 | 4.5 | 0.2 (−0.4 to 0.7) | −1.1 (−2.1 to −0.3) | .01 |
| 45–64 | 8.3 | 7.4 | −0.9 (−1.2 to −0.6) | 8.1 | 7.9 | −0.2 (−0.6 to 0.1) | −0.5 (−0.9 to −0.1) | Reference |
| Race/ethnicity | ||||||||
| Non-Hispanic white | 8.9 | 8.4 | −0.4 (−1.0 to 0.1) | 8.9 | 8.8 | 0.0 (−0.7 to 0.7) | −0.5 (−1.2 to 0.2) | Reference |
| Non-Hispanic black | 7.2 | 5.8 | −1.3 (−2.0 to −0.7) | 6.2 | 6.3 | 0.0 (−0.5 to 0.6) | −1.4 (−2.2 to −0.7) | .04 |
| Hispanic | 4.7 | 4.3 | −0.4 (−1.3 to 0.4) | 5.5 | 4.6 | −0.9 (−1.4 to −0.5) | 0.4 (−0.6 to 1.3) | .20 |
| Area-level poverty rated | ||||||||
| Below median (16.3%) | 6.7 | 6.1 | −0.7 (−1.1 to −0.4) | 6.8 | 6.7 | −0.2 (−0.9 to 0.5) | −0.5 (−1.1 to00200.2) | .68 |
| At or above median | 7.2 | 6.5 | −0.8 (−1.1 to −0.4) | 7.2 | 7.1 | −0.1 (−0.7 to 0.5) | −0.6 (−1.3 to 0.01) | Reference |
The reported values in these columns refer to the 1-year mortality rate. The percentages were calculated as the percentage of patients initiating dialysis who died within 1 year beginning on the 91st day after initiation.
Difference-in-differences estimate for each specified age, race/ethnicity, and area-level poverty rate below or greater than or equal to the median. All 95% CIs are derived from generalized linear regression models with Huber-White robust standard errors clustered at the state level.
P value for comparison of difference-in-differences estimate with reference group.
Percentage of persons in the patient’s census tract or zip code with income below the federal poverty level. The reported value is the mean area-level percentage.
Secondary End Points
Figure 2 plots the unadjusted proportions of patients initiating dialysis in expansion and nonexpansion states with Medicaid coverage (panel A) or who were uninsured (panel B) at the time of dialysis initiation, from January 2011 through March 2017. Rates of Medicaid coverage for expansion and nonexpansion states sharply diverged beginning in the first 6 months of 2014, at which point Medicaid coverage increased sharply in expansion states. Uninsurance declined in both expansion and nonexpansion states, though the decline was greater in expansion states.
Figure 2. Trends in Insurance Coverage Among Nonelderly Adults Initiating Dialysis, by State Medicaid Expansion Status.
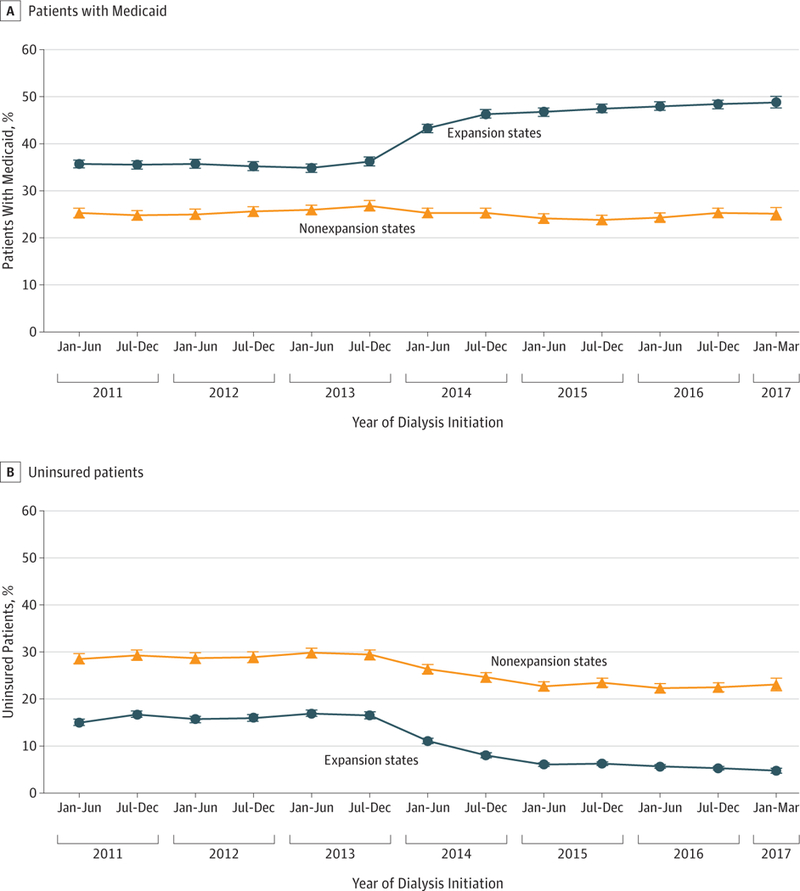
The figure shows time trends in the proportion of nonelderly end-stage renal disease patients (A) with Medicaid coverage or (B) who were uninsured at the time of initiating dialysis in expansion and nonexpansion states. For each half-year period, the population sizes ranged from a maximum of 12 362 patients to a minimum of 10 722 patients for expansion states and from a maximum of 8142 patients to a minimum of 6630 patients for nonexpansion states. Expansion states were restricted to those that expanded Medicaid beginning January 1, 2014. Error bars indicate 95%CIs.
Access to predialysis nephrology care in expansion and nonexpansion states is shown in eFigure 3A in the Supplement. Rates of initiating dialysis with an arteriovenous fistula or graft present remained stable in expansion states but declined after 2014 in nonexpansion states (eFigure 3B). In adjusted analyses, Medicaid expansion was associated with a 10.5-percentage-point (95% CI, 7.7–13.2) increase in Medicaid coverage and a −4.2-percentage-point (95% CI, −6.0 to −2.3) decrease in being uninsured at the time of dialysis initiation relative to nonexpansion states (Table 2). There was a concurrent 1.0-percentage-point (95% CI, −0.1 to 2.1) increase in the proportion receiving care from a nephrologist prior to dialysis initiation and a 2.3-percentage-point (95% CI, 0.6–4.1) increase in initiating dialysis with a graft or fistula present.
eTable 3 in the Supplement presents subgroup estimates for the secondary outcomes. Hispanic patients had increased gains in Medicaid coverage (18.5 percentage points) compared with white patients (7.6 percentage points; <.001 for interaction). Patients living in areas of higher poverty had greater increases in Medicaid coverage (11.9 percentage points) and declines in uninsurance (−5.5 percentage points) than those living in areas with lower poverty (9.1-percentage-point increase in Medicaid [P = .003 for interaction]; −3.0- percentage-point change in uninsurance [P = .004 for interaction]). Persons aged 19 to 44 years experienced larger declines in uninsurance (−6.4 percentage points) than those aged 45 to 64 years (−3.3 percentage points; P = .002 for interaction). There was no differential changes in access to predialysis nephrology care or presence of an arteriovenous fistula or graft by age (P = .77 for interaction for predialysis nephrology care; P = .08 for interaction for arteriovenous fistula or graft), race/ethnicity (P = .44 [black patients] and P = .18 [Hispanic patients] for interactions for predialysis nephrology care; P = .42 [black patients] and P = .15 [Hispanic patients] for interactions for arteriovenous fistula or graft), or area-level poverty (P = .27 for interaction for predialysis nephrology care; P = .95 for interaction for arteriovenous fistula or graft). Persons aged 19 to 44 years, black patients, and those living in areas with higher rates of poverty experienced significant increases in predialysis nephrology care, with difference-in-differences values ranging from 1.7 to 2.4 percentage points.
State-Level Estimates and NNT
eFigure 4 in the Supplement presents state-level changes in 1-year mortality (panel A) and Medicaid coverage (panel B) and a scatterplot of changes in both outcomes (panel C). The 15 states with the largest mortality reductions and the 21 states with the largest gains in Medicaid coverage were all expansion states. Combining the difference-in-differences estimates for mortality and Medicaid coverage yielded an NNT of 18 additional persons gaining coverage to avoid 1 death at 1 year following the initiation of dialysis. For the change in the uninsured rate, the NNT was 7.
Sensitivity Analyses
Sensitivity analyses that excluded early expansion states (eFigure 5 in the Supplement), examined 1-year mortality beginning on the 43rd day after dialysis initiation, considered a 21-month transition period around expansion, and used alternative approaches to handle missing covariates yielded estimates that were consistent with those of the primary analysis (eTable 2 in the Supplement). Pre-2014 trends in outcomes for expansion and nonexpansion states did not differ significantly (eTable 4 in the Supplement). Declines in mortality were significant for causes amenable to health care and nonsignificant and close to zero for nonamenable causes, such as poisonings, homicides, and other injuries (eTable 5 in the Supplement).
Medicaid expansion was not associated with significant changes in the number of patients initiating dialysis, rates of peritoneal dialysis, or prevalence of most clinical comorbidities (eTable 6 and eFigure 6 in the Supplement). The mean estimated glomerular filtration rate at dialysis initation decreased by −0.13 mL/min (95% CI, −0.22 to −0.03 mL/min) in expansion states relative to nonexpansion states, representing a relative change of approximately 1% (eTable 6 in the Supplement). In addition, among those with Medicare or VA coverage before dialysis (who should not have been affected by expansion), there were no significant changes in mortality associated with Medicaid expansion (eTable 7 in the Supplement).
Discussion
In this national study of nonelderly adults with ESRD initiating dialysis, the ACA Medicaid expansion was associated with a significant decline in 1-year mortality, as measured by both absolute and relative reductions. The decline in death rates was concentrated among health care–amenable causes of death, consistent with prior population-level studies of health insurance expansion.8,20 To our knowledge, these results are the first published evidence of a significant change in mortality associated with coverage expansion under the ACA.
Exploratory analyses of secondary outcomes suggest a plausible causal pathway for these findings, with Medicaid expansions associated with significant coverage gains and reductions in the use of high-risk central venous catheters without the presence of a maturing arteriovenous fistula or graft. Mortality reductions were largest among black patients and those aged 19 to 44 years, consistent with the larger gains in health insurance and nephrology care observed for those subgroups.
Although this study is not randomized, several factors suggest a causal relationship between Medicaid expansion and mortality reductions. First, mortality rates in expansion states were stable for 3 years before the ACA and then declined immediately at the time of expansion, while they remained flat in nonexpansion states. Second, mortality rates did not change among persons covered by Medicare or the VA or for causes of death that were not amenable to health care, suggesting that the findings are not due to secular trends in these states unrelated to Medicaid expansion. Third, Medicaid expansion was associated with marked gains in coverage and reductions in the use of central venous catheters, a well-identified risk factor for premature death in this population.21 Fourth, in state- level analyses, the largest declines in mortality were almost exclusively observed in expansion states.
The study findings are unlikely to be explained by differential change in the characteristics or timing of patients initiating dialysis. The main results were unaffected by adjustment for an extensive set of demographic, clinical, and socioeconomic characteristics. Furthermore, expansion was not associated with clinically meaningful changes in the glomerular filtration rate at dialysis initiation or the prevalence of comorbid conditions. In addition, the number of patients initiating dialysis did not change significantly in expansion states relative to concurrent trends in nonexpansion states. This suggests that unlike more discretionary conditions, for which expanded coverage may induce more utilization, population rates of dialysis initiation are likely to be fairly consistent in the short term regardless of coverage rates.
Two previous studies of Medicaid expansions in the early 2000s and Massachusetts’ 2006 health reform reported more modest declines in death rates.7,8 The former study estimated 1 life saved for every 239 to 316 adults gaining coverage, while the latter reported an NNT of 830 adults gaining coverage to prevent 1 death per year. In this study, the NNT to avoid 1 death within 1 year is more than an order of magnitude lower than that reported in those prior analyses. This finding likely reflects the markedly higher annual mortality rate among persons with ESRD—approximately 7% in the study population vs 0.3% (283 per 100 000) in the general Massachusetts population.
Compared with white patients, black patients experienced larger coverage gains and a 3-fold greater decline in mortality following expansion. Furthermore, after starting dialysis, black Americans younger than 50 years have 1-year death rates that are 7 to 14 percentage points greater than those of white patients in the same age group.22 Future expansions of Medicaid in nonparticipating states may therefore be an important strategy to address racial disparities in the ESRD population.
Limitations
This study has several limitations. First, the findings may not generalize to patients with other chronic health care conditions. Second, the expansion of insurance could alter the time course of when patients with chronic kidney disease choose to initiate dialysis, which could change the composition of the population over time; however, the sensitivity analyses demonstrated little evidence that such a change occurred.
Third, the outcomes were limited to 2 measures of nephrology care and 1-year mortality. The study did not assess other health services that may improve long-term outcomes in the ESRD population, including kidney transplantation and treatment of diabetes and cardiovascular disease. Other research demonstrating increased access to prescription drug coverage after Medicaid expansion provides an additional potential mechanism for improved outcomes in the study cohort.23 Medicaid expansion has been associated with an increase in Medicaid-covered preemptive kidney transplantations, though such transplantations remain uncommon, particularly among racial minorities and those with lower socioeconomic status.24
Fourth, predialysis nephrology care, as measured in the REMIS data, has demonstrated poor agreement with Medicare claims.25 The potential misclassification of this outcome would likely bias estimates toward finding no association with expansion. The measure of vascular access has been validated in a prior study.26
Fifth, the data lacked individual-level information on eligibility for Medicaid, though it did include a robust area-level measure of poverty by geocoding residential addresses, which tracked closely with coverage gains in the study population. Sixth, it is possible that time-varying confounders that may have biased the results, though the nonsignificant changes in the Medicare and VA populations and for non– health care–amenable causes of death offers support for Medicaid expansion as the key factor in the observed mortality changes.
Conclusions
Among patients with ESRD initiating dialysis, living in a state that expanded Medicaid under the ACA was associated with lower 1-year mortality. If this association is causal, further research is needed to understand what factors may have contributed to this finding.
Supplementary Material
Key Points.
Question
Was the expansion of Medicaid under the Affordable Care Act (ACA) associated with lower mortality for persons with end-stage renal disease?
Findings
In this observational study of 236 246 nonelderly patients with end-stage renal disease initiating dialysis comparing mortality between the preexpansion period and the postexpansion period, the change in 1-year mortality among patients in Medicaid expansion states compared with those in nonexpansion states was −0.8% vs −0.2%, a difference that was statistically significant.
Meaning
Among patients with end-stage renal disease initiating dialysis, the ACA Medicaid expansion was associated with significant improvements in 1-year survival.
Acknowledgments
Funding/Support: Research reported in this publication was supported by the National Institute of Diabetes and Digestive and Kidney Diseases of the National Institutes of Health under award number R01DK113398–01.
Role of the Funder/Sponsor: The study funder had no role in the design and conduct of the study; collection, management, analysis, and interpretation of the data; preparation, review, or approval of the manuscript; and decision to submit the manuscript for publication.
Footnotes
Conflict of Interest Disclosures: All authors have completed and submitted the ICMJE Form for Disclosure of Potential Conflicts of Interest.
No disclosures were reported.
Disclaimer: The views expressed in this article are those of the authors and do not necessarily reflect the position or policy of the Department of Veterans Affairs or the US government.
Meeting Presentation: American Society of Nephrology Kidney Week; October 25, 2018; San Diego, California.
Contributor Information
Shailender Swaminathan, Department of Health Services, Policy, and Practice, Brown University School of Public Health, Providence, Rhode Island Providence VA Medical Center, Providence, Rhode Island Public Health Foundation of India, New Delhi, India SRM University, Amaravati, India.
Benjamin D. Sommers, Department of Health Policy and Management, Harvard T. H. Chan School of Public Health, Boston, Massachusetts Department of Medicine, Brigham and Women’s Hospital, Boston, Massachusetts.
Rebecca Thorsness, Department of Health Services, Policy, and Practice, Brown University School of Public Health, Providence, Rhode Island.
Rajnish Mehrotra, Department of Medicine, University of Washington School of Medicine, Seattle.
Yoojin Lee, Department of Health Services, Policy, and Practice, Brown University School of Public Health, Providence, Rhode Island.
Amal N. Trivedi, Department of Health Services, Policy, and Practice, Brown University School of Public Health, Providence, Rhode Island Providence VA Medical Center, Providence, Rhode Island.
REFERENCES
- 1.Kaiser Family Foundation. Current status of states Medicaid expansion decisions https://www.kff.org/health-reform/slide/current-status-of-the-medicaid-expansion-decision/. Accessed September 13, 2018.
- 2.Sommers BD, Gawande AA, Baicker K. Health insurance coverage and health—what the recent evidence tells Us. N Engl J Med 2017;377(6):586–593. doi: 10.1056/NEJMsb1706645 [DOI] [PubMed] [Google Scholar]
- 3.Miller S, Wherry LR. Health and access to care during the first 2 years of the ACA Medicaid expansions. N Engl J Med 2017;376(10):947–956. doi: 10.1056/NEJMsa1612890 [DOI] [PubMed] [Google Scholar]
- 4.Sommers BD, Gunja MZ, Finegold K, Musco T. Changes in self-reported insurance coverage, access to care, and health under the Affordable Care Act. JAMA 2015;314(4):366–374. doi: 10.1001/jama.2015.8421 [DOI] [PubMed] [Google Scholar]
- 5.Cole MB, Galárraga O, Wilson IB, Wright B, Trivedi AN. At federally funded health centers, Medicaid expansion was associated with improved quality of care. Health Aff (Millwood) 2017;36(1): 40–48. doi: 10.1377/hlthaff.2016.0804 [DOI] [PubMed] [Google Scholar]
- 6.Baicker K, Taubman SL, Allen HL, et al. ; Oregon Health Study Group. The Oregon experiment— effects of Medicaid on clinical outcomes. N Engl J Med 2013;368(18):1713–1722. doi: 10.1056/NEJMsa1212321 [DOI] [PMC free article] [PubMed] [Google Scholar]
- 7.Sommers BD, Baicker K, Epstein AM. Mortality and access to care among adults after state Medicaid expansions. N Engl J Med 2012;367(11): 1025–1034. doi: 10.1056/NEJMsa1202099 [DOI] [PubMed] [Google Scholar]
- 8.Sommers BD, Long SK, Baicker K. Changes in mortality after Massachusetts health care reform: a quasi-experimental study. Ann Intern Med 2014; 160(9):585–593. doi: 10.7326/M13-2275 [DOI] [PubMed] [Google Scholar]
- 9.Douthat R Is Obamacare a lifesaver? New York Times March 29, 2017. https://www.nytimes.com/2017/03/29/opinion/is-obamacare-a-lifesaver.html. Accessed June 18, 2018. [Google Scholar]
- 10.US Renal Data System. 2017 United States Renal Data System (USRDS) Annual Data Report: Epidemiology of Kidney Disease in the United States Bethesda, MD: National Institute of Diabetes and Digestive and Kidney Diseases; 2017. [Google Scholar]
- 11.Winkelmayer WC, Owen WF Jr, Levin R, Avorn J. A propensity analysis of late versus early nephrologist referral and mortality on dialysis. J Am Soc Nephrol 2003;14(2):486–492. doi: 10.1097/01.ASN.0000046047.66958.C3 [DOI] [PubMed] [Google Scholar]
- 12.Trivedi AN, Sommers BD. The Affordable Care Act, Medicaid expansion, and disparities in kidney disease. Clin J Am Soc Nephrol 2018;13(3):480–482. doi: 10.2215/CJN.10520917 [DOI] [PMC free article] [PubMed] [Google Scholar]
- 13.Kurella-Tamura M, Goldstein BA, Hall YN, Mitani AA, Winkelmayer WC. State Medicaid coverage, ESRD incidence, and access to care. J Am Soc Nephrol 2014;25(6):1321–1329. doi: 10.1681/ASN.2013060658 [DOI] [PMC free article] [PubMed] [Google Scholar]
- 14.Wilper AP, Woolhandler S, Lasser KE, McCormick D, Bor DH, Himmelstein DU. Hypertension, diabetes, and elevated cholesterol among insured and uninsured US adults. Health Aff (Millwood) 2009;28 (6):w1151–w1159. doi: 10.1377/hlthaff.28.6.w1151 [DOI] [PubMed] [Google Scholar]
- 15.Institute of Medicine. Care Without Coverage: Too Little, Too Late Washington, DC: National Academy Press; 2002. [Google Scholar]
- 16.US Renal Data System. 2017 Researcher’s Guide to the USRDS Database https://www.usrds.org/2017/rg/2017_USRDS_Researcher_Guide.pdf. Accessed September 13, 2018.
- 17.Foley RN, Chen SC, Solid CA, Gilbertson DT, Collins AJ. Early mortality in patients starting dialysis appears to go unregistered. Kidney Int 2014;86(2):392–398. doi: 10.1038/ki.2014.15 [DOI] [PubMed] [Google Scholar]
- 18.Bertrand M, Duflo E, Mullainathan S. How much should we trust differences-in-differences estimates? QJ Econ 2004;119:249–275. doi: 10.1162/003355304772839588 [DOI] [Google Scholar]
- 19.Perez JJ, Zhao B, Qureshi S, Winkelmayer WC, Erickson KF. Health insurance and the use of peritoneal dialysis in the United States. Am J Kidney Dis 2018;71(4):479–487. doi: 10.1053/j.ajkd.2017.09.024 [DOI] [PMC free article] [PubMed] [Google Scholar]
- 20.Sommers BD. State Medicaid expansions and mortality, revisited: a cost-benefit analysis. Am J Health Econ 2017;3(3):392–421. doi: 10.1162/ajhe_a_00080 [DOI] [Google Scholar]
- 21.Polkinghorne KR, McDonald SP, Atkins RC, Kerr PG. Vascular access and all-cause mortality: a propensity score analysis. J Am Soc Nephrol 2004;15(2):477–486. doi: 10.1097/01.ASN.0000109668.05157.05 [DOI] [PubMed] [Google Scholar]
- 22.Kucirka LM, Grams ME, Lessler J, et al. Association of race and age with survival among patients undergoing dialysis. JAMA 2011;306(6): 620–626. doi: 10.1001/jama.2011.1127 [DOI] [PMC free article] [PubMed] [Google Scholar]
- 23.Ghosh A, Sommers B, Simon K. The effect of state Medicaid expansions on prescription drug use: evidence from the Affordable Care Act http://www.nber.org/papers/w23044. Accessed June 16, 2018.
- 24.Harhay MN, McKenna RM, Boyle SM, et al. Association between Medicaid expansion under the Affordable Care Act and preemptive listings for kidney transplantation. Clin J Am Soc Nephrol 2018; 13(7):1069–1078. [DOI] [PMC free article] [PubMed] [Google Scholar]
- 25.Kim JP, Desai M, Chertow GM, Winkelmayer WC. Validation of reported predialysis nephrology care of older patients initiating dialysis. J Am Soc Nephrol 2012;23(6):1078–1085. doi: 10.1681/ASN.2011080871 [DOI] [PubMed] [Google Scholar]
- 26.Solid CA, Collins AJ, Ebben JP, et al. Agreement of reported vascular access on the medical evidence report and on Medicare claims at hemodialysis initiation. BMC Nephrol 2014;15:30. doi: 10.1186/1471-2369-15-30 [DOI] [PMC free article] [PubMed] [Google Scholar]
Associated Data
This section collects any data citations, data availability statements, or supplementary materials included in this article.