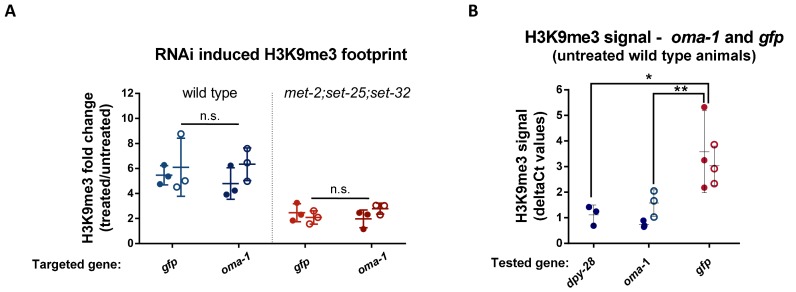
Figure 2. The fold change in RNAi-induced H3K9me3 on oma-1 and gfp is comparable.
(A) The RNAi-induced H3K9me3 footprint on the RNAi-targeted genes. The fold change in H3K9me3 levels in F1 progeny of animals exposed to RNAi versus untreated control animals. The H3K9me3 footprint levels were assessed using a qPCR quantification of ChIP experiments conducted with both wild type (left) and met-2;set-25;set-32 mutants (right). Filled or empty circles represent qPCR data obtained using two different primer sets that span different parts of the examined locus. (B) H3K9me3 levels on the gfp and oma-1 genes in naive untreated wild type animals. The deltaCt numbers used to obtain the fold change values were calculated using the eft-3 gene as an endogenous control. The presented data were obtained from three biological replicates. The levels of gfp and dpy-28 H3K9me3 signal in wild type animals are adapted from raw data from our previous publication (Lev et al., 2017). Two-way ANOVA, Sidak's multiple comparisons test. **p-value<0.005. Error bars represent standard deviations.

