. 2019 Feb 26;8:e44552. doi: 10.7554/eLife.44552

Figure 3. PAR-2 domains form in regions of high membrane curvature.

(A) One control and three air-1(RNAi) embryos expressing RFP::NMY-2 (red), GFP::PAR-2 and GFP::SAS-7 (both green) placed in triangular PDMS chambers ~40 µM in side length. Lower panels illustrate the localization of PAR-2 domains at pronuclear meeting (green), of centrioles (filled discs: before symmetry breaking; empty circles: at pronuclear meeting) and of polar bodies (asterisks, before symmetry breaking). (B–E) GFP::PAR-2 distribution in control and air-1(RNAi) embryos in triangular chambers. (B): number of domains; (C): localization outside (no GFP::PAR-2 within any corner) or within a corner; (D): localization within the corner with the highest curvature or not; red dashed line indicates chance occurrence. The extent of curvature of the embryo per se was scored before symmetry breaking; (E): localization with respect to the position of centrioles and polar bodies before symmetry breaking.

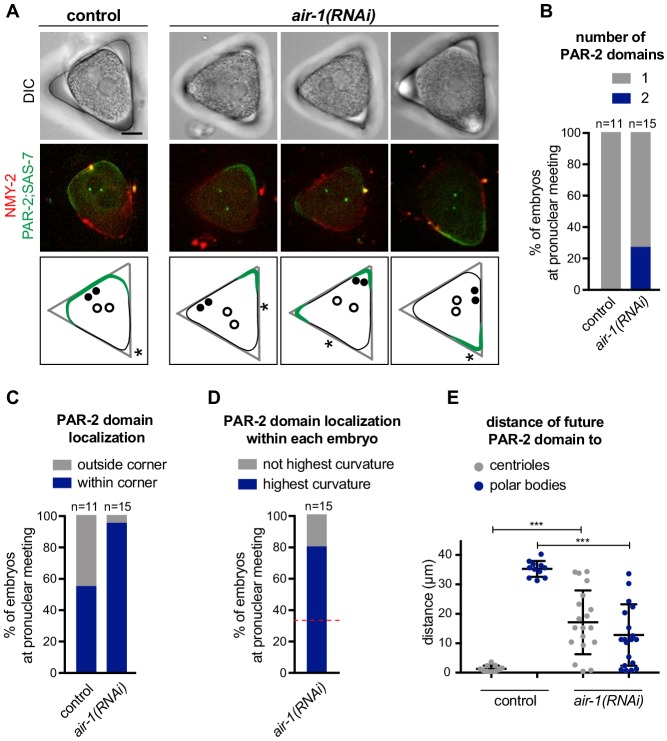
Figure 3.

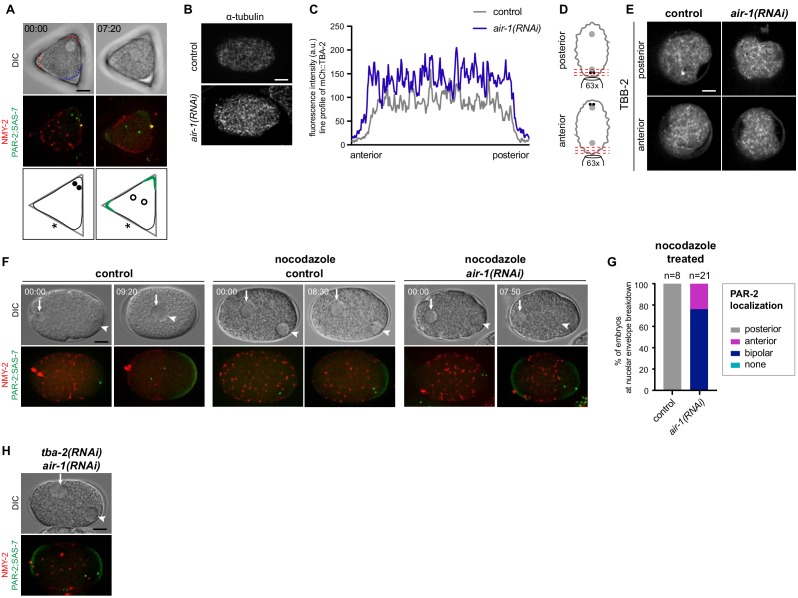
Figure 3—figure supplement 1. PAR-2 domains form independently of microtubules.

Figure 3—figure supplement 1.

(A) air-1(RNAi) embryo expressing RFP::NMY-2 (red), GFP::PAR-2 and GFP::SAS-7 (both green) placed in triangular PDMS chambers ~40 µM in side length before symmetry breaking (t = 00:00) and at pronuclear meeting (t = 07:20); same specimen as the middle air-1(RNAi) embryo shown in Figure 3A. Red and blue dashed lines indicate the actual curvature of the embryo early on, with red denoting the two corners with highest curvature. Filled black discs indicate the position of the centrosomes before symmetry breaking, empty discs their position at pronuclear meeting, whereas green lines indicate the localization of the PAR-2 domains. Asterisks: position of polar bodies. (B) Wild type and air-1(RNAi) embryos fixed and stained with antibodies against α-tubulin. (C) Line profile showing the fluorescence intensity of the α-tubulin signal in the embryos shown in (B). These line profiles are representative of other control and air-1(RNAi) embryos. N = 14. (D) Schematic illustrating the upright imaging of the anterior or posterior pole of the embryo. (E) Upright imaging as illustrated in (D) of control or air-1(RNAi) embryos expressing GFP::TBA-2. (F) Embryos expressing RFP::NMY-2 (red), as well as GFP::PAR-2 and GFP::SAS-7 (both green) before pronuclear migration (t = 00:00) and prior to nuclear envelope breakdown (second time point). Female pronucleus: arrow; male pronucleus: arrowhead. Control embryo: note migration of pronuclei; control and air-1(RNAi) embryos treated with nocodazole; note larger female pronucleus and lack of pronuclear migration. (G) Quantification of GFP::PAR-2 distribution corresponding to (F). (H) Embryo expressing RFP::NMY-2 (red), as well as GFP::PAR-2 and GFP::SAS-7 (both green) depleted of AIR-1 and TBA-2 using RNAi. N = 3.