

Abstract
BACKGROUND/OBJECTIVES:
In small studies, a thrifty human phenotype, defined by a greater 24-hour energy expenditure (EE) decrease with fasting, is associated with less weight loss during caloric restriction. In rodents, models of diet-induced obesity often have a phenotype including a reduced EE and decreased core body temperature. We assessed whether a thrifty human phenotype associates with differences in core body temperature or body composition.
SUBJECTS/METHODS:
Data for this cross-sectional analysis were obtained from 77 individuals participating in one of two normal physiology studies while housed on our clinical research unit. Twenty-four-hour EE using a whole-room indirect calorimeter and 24-h core body temperature were measured during 24 h each of fasting and 200% overfeeding with a diet consisting of 50% carbohydrates, 20% protein and 30% fat. Body composition was measured by dual X-ray absorptiometry. To account for the effects of body size on EE, changes in EE were expressed as a percentage change from 24-hour EE (%EE) during energy balance.
RESULTS:
A greater %EE decrease with fasting correlated with a smaller %EE increase with overfeeding (r = 0.27, P = 0.02). The %EE decrease with fasting was associated with both fat mass and abdominal fat mass, even after accounting for covariates (β = −0.16 (95% CI: −0.26, −0.06) %EE per kg fat mass, P = 0.003; β = −0.0004 (−0.0007, −0.00004) %EE kg−1 abdominal fat mass, P = 0.03). In men, a greater %EE decrease in response to fasting was associated with a lower 24-h core body temperature, even after adjusting for covariates (β = 1.43 (0.72, 2.15) %EE per 0.1 °C, P = 0.0003).
CONCLUSIONS:
Thrifty individuals, as defined by a larger EE decrease with fasting, were more likely to have greater overall and abdominal adiposity as well as lower core body temperature consistent with a more efficient metabolism.
INTRODUCTION
The energy expenditure (EE) response to both caloric restriction (CR) and overfeeding can vary substantially between individuals;1–5 however, the meaningfulness of these differences have only recently begun to be elucidated. In a group of 14 men, 24-hour EE changes during fasting and overfeeding were associated such that those individuals with a greater EE decrease during fasting had a smaller EE increase with overfeeding defining a potential thrifty phenotype. Conversely, those individuals with a larger EE increase during overfeeding were more likely to maintain EE during fasting consistent with a more spendthrift phenotype.1 We recently found that more thrifty obese individuals defined by a greater EE decrease with fasting lost less weight in a carefully controlled inpatient weight loss study.6 There are a number of rodent models of diet-induced obesity with a common, coalescing phenotype including decreased core body temperature (CBT) and/or cold intolerance, and reduced EE.7–10 A human thrifty phenotype may have similar attributes.
The homeostatic mechanisms regulating human CBT, including vasodilation, vasoconstriction, sweating, non-shivering and shivering thermogenesis and insulation, help maintain CBT within tightly regulated limits. On an average, variance of more than 0.2 °C from the 37 °C set point activates the thermoregulatory system.11 It is unclear how much these thermoregulatory mechanisms may contribute to an increased propensity for obesity.12 Since adipose tissue has an insulating effect in many large mammals,13 it is possible that accumulation of adipose tissue is part of the compensatory strategy of the human body to prevent heat loss in some individuals. Some authors have reported a relationship between increased body insulation due to increased adipose tissue and a decreased EE response to both cold exposure14 or a mixed meal,14,15 and propose that decreased heat loss due to increased insulation contributes to a lower energy cost of maintaining CBT.14 A small number of studies have investigated the relationship of human obesity to 24-h CBT and found no difference in CBT between lean and obese individuals at thermoneutrality,16,17 during and after exercise, after a meal, or during sleep.17 Although individual variation in temperature during low-energy diets has been proposed as a potential contributor to a ‘thrifty’ metabolism,12 the relationship of CBT to body composition, including fat and lean mass and abdominal adipose tissue, has not fully been explored. Nor is it known how CBT and these body composition measures relate to the EE responses to fasting or overfeeding.
The current study was designed to identify whether differences in 24-hour CBT and body composition are associated with the EE responses to overfeeding or fasting. We hypothesized that a human thrifty phenotype defined by a greater EE decrease with fasting and lower EE response to overfeeding would also have lower 24-hour CBT and greater adiposity.
SUBJECTS AND METHODS
Subjects
We screened 213 individuals, and 130 individuals met the initial eligibility criteria for admission into one of two ongoing studies investigating the EE responses to CR and overfeeding (NCT00687115), NCT00523627). These initial criteria included evidence of good health and no medical conditions as assessed by history, physical, EKG and basic laboratory measures. Both studies included admission to the clinical research unit (CRU) of the Obesity and Diabetes Clinical Research Section of the National Institute of Diabetes and Digestive and Kidney Diseases (NIDDK) in Phoenix, AZ, USA and measurement of EE during energy balance, overfeeding with identical diets and fasting while the subjects were weight stable. Further 53 subjects were excluded during the inpatient phase because they either left the study for personal reasons (n = 13), were diagnosed with impaired glucose tolerance during the 75 g oral glucose tolerance test (OGTT) that occurred on day 4 of admission after an overnight fast (an exclusion criterion for study NCT00523627, n = 20), were diagnosed with diabetes mellitus during the OGTT (an exclusion criterion for both studies, n = 4), developed an acute illness (n = 2) or did not have available data for all three assessments, that is, energy balance, fasting and overfeeding, included in this analysis (n = 14). Glucose tolerance status was assessed according to the American Diabetes Association criteria.18 The majority (n = 74) of subjects had normal glucose regulation. Data from 77 subjects (NCT00687115 (n = 17), NCT00523627 (n = 60)) were included in the final analyses. Thyroid stimulating hormone (TSH) was determined by the laboratory of the Phoenix Indian Medical Center on the day of admission to the CRU (Dimension TSH Flex ELISA Immunoassay Module, Siemens Healthcare Diagnostics, Inc, East Walpole, MA, USA). Subjects represented a wide body mass index (BMI) range (17.8–50.0 kg m −2). All subjects reported weight stability for the 6 months before admission. Subjects were weighed daily upon first awakening and were asked not to engage in vigorous exercise for the duration of their stay. Upon admission, volunteers were provided a standard, weight maintaining diet (WMD) with 50 carbohydrate, 30 fat and 20% protein content. Initial weight maintaining energy needs were determined using unit specific equations based on weight, height and sex.19 The caloric content of the WMD was adjusted as needed to maintain a stable weight (±1%). Volunteers were fully informed of the nature and purpose of the study they participated in, and written informed consent was obtained before admission. Both protocols were approved by the Institutional Review Board of the NIDDK.
Energy expenditure measurements
The assessment of EE was performed in a whole-room indirect calorimeter, as previously described.2 Breakfast was provided at 0700 h, and the subjects entered the calorimeter about 30 min after completion of breakfast. Three other meals were provided within the calorimeter at 1100, 1600 and 1900 h. To more closely achieve energy balance during the baseline EE assessment, EE was measured twice during eucaloric conditions. Energy intake during the first eucaloric respiratory chamber was based on unit specific calculations,20 which is ~ 80% of the WMD to account for the reduction in physical activity within the whole-room calorimeter. The 24-h caloric content of the meals fed during the second eucaloric measurement was equivalent to the EE calculated from the first assessment.
Because short-term adaptations to fasting or overfeeding are associated with both the amount of voluntary weight loss during dieting6 and involuntary weight change during free living conditions in adults21 we phenotypically typed individuals’ EE and CBT changes during 24 h of overfeeding and 24 h of fasting. The second eucaloric measurement was considered to be the baseline assessment and was doubled to determine the caloric intake of the overfeeding diet. The overfeeding diet contained an identical macronutrient composition as the eucaloric assessments (50% carbohydrate, 30% fat and 20% protein), and was given for only 24 h, during which EE was measured. All subjects also had an EE assessment while fasting with no caloric intake from 1900 hours the night before entering the calorimeter. Subjects only consumed non-caloric, non-caffeinated beverages during this assessment. The overfeeding diet and the fasting assessments were done a minimum of 3 days apart from one another. All EE responses to overfeeding and fasting are expressed as the percent change from the EE during energy balance (EEDiet of Interest – EEenergy balance / EEenergy balance × 100) to control for EE differences because of variations in body size.
Dual-energy X-ray absorptiometry
Whole body composition, including percent body fat, fat mass (FM) and fat-free mass (FFM) was estimated by total body dual-energy X-ray absorptiometry (DPX-L; Lunar Radiation, Madison, WI, USA) as previously described.16 Total abdominal fat mass (AF) and %AF (percent AF from whole body weight) was determined from a region of interest (ROI), which was defined from the top of the liver down to the intervertebral disc level of L5/S1, and segmented manually using the enCore 2003 software (GE Medical Systems, Lunar Radiation, Madison, WI, USA).
Core body temperature
Ingestible sensors (CorTemp, HQ Inc., Palmetto, FL, USA) that transmit temperature values every minute to a data recorder worn around the volunteer’s waist were used to measure CBT. Data was available from a subset of 59 subjects with valid CBT measures during the EE assessments. In women, the CBT assessments were not consistently synchronized with the follicular phase of the menstrual cycle. Missing CBT data was due to capsules passing through the gastro-intestinal tract in less than 16 h or technical failure of either the sensors or the data recorder. Diurnal CBT included the CBT between 0800 and 2300 h, which represents the time period when the thermic effect of food can be observed. Twenty-four-hour CBT and diurnal CBT values are expressed as the mean temperature during the respective time periods. As CBT demonstrated a high intra-individual consistency, and to maximize the use of all CBT measures acquired, we also created the combined mean CBT during all three diets for each individual.
Statistical analysis
Normally distributed data was described with means and standard deviations. Skewed data (AF, BMI) was described with medians and interquartile ranges. Pearson correlation coefficients were used to assess initial associations between continuous, normally distributed variables, and Spearman rank correlation coefficients were used for skewed variables. Two sample t-tests were used to assess differences between groups, and paired t-tests were used to assess for differences between diets within individuals. The contributions of FM and AF to the percent EE changes during the dietary interventions were assessed in separate linear regression models including age, sex, race, ambient temperature and whole body FFM as covariates. Effect sizes of multivariate linear regression models are given as mean ± standard deviation and (95% confidence limits). Because of differences in CBT between men and women and because of menstrual cycle temperature variation in women, all CBT analyses after the initial comparison by sex were limited to men only. The associations between plasma TSH concentrations and CBT with the percent EE changes during overfeeding and fasting were assessed with linear regression models as above but also including FM or AF as a covariate. In order to better understand the differences between individuals, we categorized them into thrifty or spendthrift phenotypes defined by a median split of the EE response to fasting (Table 2), as has been done previously.6 The assessments of differences between FM and AF in thrifty and spendthrift individuals were adjusted for sex.
Table 2.
Thrifty vs spendthrift phenotype
| Thrifty | Spendthrift | |
|---|---|---|
| N | 39 (28 Men; 11 women) | 38 (30 Men; 8 women) |
| Race | 12 W, 13NA, 7B, 7H | 14 W, 12NA, 6B, 6H |
| Age (years) | 37.3 ± 9.5 | 34.6 ± 10.8 |
| Body weight (kg) | 87.3 ± 16.8 | 80.2 ± 18.7 |
| BMI (kg m −2) | 28.0 (25.4; 33.4) (2) | 25.8 (22.9; 27.9) |
| Body fat (%) | 34.0 ± 9.9** | 26.8 ± 12.5 |
| FM (kg) | 30.6 ± 13.0* | 22.6 ± 14.1 |
| FFM (kg) | 56.8 ± 10.3 | 57.6 ± 11.5 |
| AF (kg) | 7.1 (5.16; 10.37) (2),* | 4.5 [2.05; 7.33] |
| AF (% of body weight) | 8.6 ± 3.5* | 6.4 ± 4.0 |
| EE (kcal) (3) | 2099 (2036; 2162)** | 1992 (1930; 2055) |
| EE response to fasting (%) (1) | −11.4*** | −4.6 ± 2.4 |
| EE response to overfeeding (%) | 8.3 ± 5.3* | 11.0 ± 4.7 |
| Fasting glucose (mg dl −1) (4) | 94.9 ± 5.3** | 90.4 ± 4.8 |
| 2 h glucose (mg dl −1) | 112.0 ± 31.3 | 107.4 ± 24.4 |
| TSH (μIU ml −1) | 1.56 ± 0.77 | 1.55 ± 0.95 |
| Combined average CBT (°C ) | 36.80 ± 0.18 N = 25** | 36.96 ± 0.15 N = 19 |
Abbreviations: AF, abdominal fat mass; B, black; BMI, body mass index; CBT, average 24-h core body temperature; FM, fat mass; FFM, fat-free mass; H, hispanic; NA, Native American; TSH, thyroid stimulating hormone; W, white. To better understand the differences between individuals, we categorized them into thrifty or spendthrift phenotypes
defined by a median split of the 24 h-EE response to fasting. Values are presented as mean ± s.d., unless otherwise indicated.
Presented as medians and interquartile range. Differences between men and women were assessed by two sample Student’s t-test
= P<0·05
= P <0·01
= P<0.0001
EE = 24-hour energy expenditure during energy balance, results are shown as least square means and (95% confidence limits), adjusted for differences in age, sex, race, FM, FFM and ambient temperature.
Adjusting for differences in percentage of body fat did not alter the results for group differences in fasting glucose values (P<0.01). Combined average CBT are values from average CBT measurements during energy balance, fasting and overfeeding in men only.
RESULTS
Associations between EE responses to fasting and overfeeding, and body composition
Characteristics of the study population are shown in Table 1. No differences were noted between ethnicities (Native American, Hispanic, White, Black) in any of the measured variables.
Table 1.
Demographic and anthropometric characteristics of the study population
| All | Men | Women | |
|---|---|---|---|
| N | 77 | 58 | 19 |
| Race | 26 W, 25NA, 13B, 13H | 20 W, 19NA, 9B, 10H | 6 W, 5NA, 4B, 3H |
| Age (years) | 35.9 ± 10.2 | 37.7 ± 10.3** | 30.7 ± 8.2 |
| Body weight (kg) | 83.8 ± 18.0 | 84.2 ± 17.7 | 82.6 ± 19.2 |
| BMI (kg m −2) | 26.2 (24.3; 30.8) | 26.0 (24.0; 29.5) | 30.0 (25.1; 37.3) |
| Body fat (%) | 30.4 ± 11.8 | 26.0 ± 8.8*** | 44.0 ± 8.9 |
| FM (kg) | 26.6 ± 14.0 | 23.0 ± 11.8** | 37.8 ± 14.8 |
| FFM (kg) | 57.2 ± 10.7 | 61.2 ± 8.7*** | 44.8 ± 5.5 |
| AF (kg) | 5.92 (3.68; 8.97) | 5.28 (3.30; 7.33)** | 8.87 (5.76; 14.1) |
| AF (% of body weight) | 7.5 ± 3.9 | 6.4 ± 3.1*** | 10.8 ± 4.3 |
| EE (kcal) | 2098 ± 328 | 2163 ± 319** | 1900 ± 277 |
| Intake in energy balance (kcal) | 2128 ± 351 | 2190 ± 337** | 1937 ± 329 |
| Fasting glucose (mg dl −1) | 92.7 ± 5.5 | 92.4 ± 5.7 | 93.5 ± 4.8 |
| 2 h glucose (mg dl −1) | 109.7 ± 28.1 | 106.7 ± 2.1 | 119.1 ± 29.6 |
| TSH (μIU ml −1) | 1.55 ± 0.86 | 1.55 ± 0.84 | 1.56 ± 0.94 |
| Combined average CBT (°C) | 36.94 ± 0.22 N = 59 | 36.89 ± 0.18** N = 44 | 37.12 ± 0.22 N = 15 |
| CBT energy balance (°C) | 36.91 ± 0.30 N = 46 | 36.82 ± 0.27** N = 34 | 37.18 ± 0.23 N = 12 |
| CBT fasting (°C) | 36.90 ± 0.25 N = 46 | 36.86 ± 0.24* N = 36 | 37.06 ± 0.26 N = 10 |
| CBT overfeeding (°C) | 37.02 ± 0.21 N = 45 | 36.96 ± 0.18** N = 32 | 37.17 ± 0.21 N = 13 |
Abbreviations: AF, abdominal fat mass; B, black; BMI, body mass index; CBT, average 24-h core body temperature; FM, fat mass; FFM, fat-free mass; H, hispanic; NA, Native American; TSH, thyroid stimulating hormone; W, white. Values are presented as mean ± s.d. Differences between men and women were assessed by two sample Student’s t-test Combined average CBT are values from average CBT measurements during energy balance, fasting and overfeeding.
= P<0·05
= P <0·01
= P<0.0001
Compared with EE during energy balance, the mean percent EE (%EE) decrease during fasting EE was −8 ± 4.3% (P <0.0001), and the %EE increase with overfeeding was 9.7 ± 5.2% (P <0.0001). Individuals with a smaller %EE decrease in response to fasting had a greater %EE increase in response to overfeeding (r = 0.27, P = 0.02) (Figure 1). When individuals were categorized as thrifty vs spendthrift (Table 2), thrifty individuals had greater FM (30.6 vs 22.6 kg, P = 0.01) and AF (7.72 vs 5.52 kg; P = 0.02) compared with spendthrift individuals; these results were similar after limiting the data set to men only (26.6 vs 19.6 kg, P = 0.02; (6.61 vs 4.78 kg; P = 0.04). There was a negative correlation between FM, %body fat, AF, %AF and the %EE response to fasting (r = −0.36, P = 0.001; r = −0.35, P = 0.002; ρ = −0.34, P = 0.003, r = −0.30, P = 0.009, respectively), and the %EE response to overfeeding (r = −0.27, P = 0.02; r = −0.36, P = 0.002; ρ = −0.25, P = 0.03, r = −0.32, P = 0.005, respectively), that is, individuals with more total and abdominal fat mass showed a greater decrease in EE during fasting and a smaller EE increase during overfeeding. After accounting for covariates (age, sex, race, ambient temperature and whole body FFM), FM and AF were both independent determinants of the %EE decrease with fasting (β = −0.16%EE per kg, P = 0.003, (−0.26, −0.06); β = −0.0004%EE per kg, P = 0.03, (−0.0007, −0.00004), respectively) (Table 3, Figure 2). Neither FM nor AF were independent predictors of the increase in %EE with overfeeding after accounting for covariates.
Figure 1.
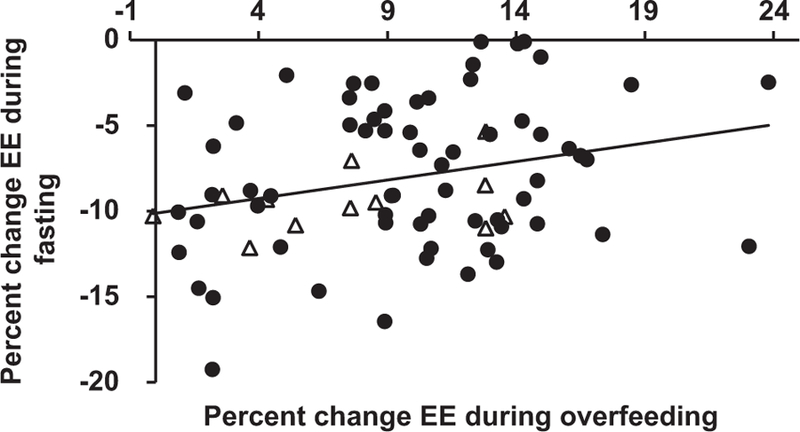
Correlation of 24 h-energy expenditure responses to fasting and overfeeding (r = 0.27, P = 0.02). Filled circles represent subjects with a wide BMI range (17.8─50.0) participating in study NCT00523627; open triangles represent 12 obese individuals (BMI range: 30.0─50.0) that with evaluation prior to their participation in a CR weight loss study (NCT00687115; details can be found here6).
Table 3.
Multivariate models for the determinants of the EE response to fasting
|
Model 1 β (p) (95% CI) |
Model 2 β (p) (95% CI) |
Model 3 β (p) (95% CI) (men only) |
Model 4 β (p) (95% CI) (men only) |
|
|---|---|---|---|---|
| FM (kg) or AF (kg) | FM −0.16 (0.003) (−0.26, −0.06) |
AF −0.0004 (0.03) (−0.0007, −0.00004) |
FM −0.12 (0.07) (−0.26, 0.01) |
AF −0.0003 (0.17) (−0.0007, 0.0001) |
| FFM (kg) | 0.01 (0.89) (−0.14, 0.16) |
−0.01 (0.89) (−0.15, 0.13) |
0.07 (0.34) (−0.08, 0.22) |
−0.05 (0.54) (−0.11, 0.20) |
| Age (years) | −0.03 (0.54) (−0.13, 0.07) |
−0.07 (0.24) (−0.17, 0.04) |
0.06 (0.4) (−0.08, 0.19) |
0.06 (0.41) (−0.08, 0.19) |
| Sex | −1.98 (0.39) (−6.49, 2.54) |
−0.08 (0.97) (−4.2, 4.05) |
||
| Race | (P=0.60) | (P=0.79) | (P=0.43) | (P=0.50) |
| Ambient Temp (°C) | 0.23 (0.52) (−0.47, 0.93) |
0.5 (0.17) (−0.22, 1.22) |
−0.005(0.99) (−0.77, 0.76) |
0.11 (0.78) (−0.66, 0.87) |
| CBT (°C) | 1.43/ 0.10 (0.0003) (0.72, 2.15) |
1.42/ 0.10 (0.0004) (0.69, 2.16) |
Abbreviations: AF, abdominal fat mass; CBT, average 24-h core body temperature; CI, confidence interval; FM, fat mass; FFM, fat-free mass. Models 1 and 2 include the whole study population (men and women). Models 3 and 4 include CBT measurements and were limited to men because of the differences in CBT between men and women and because of menstrual cycle temperature variation in women (values from average CBT measurements during energy balance, fasting and overfeeding).
Figure 2.
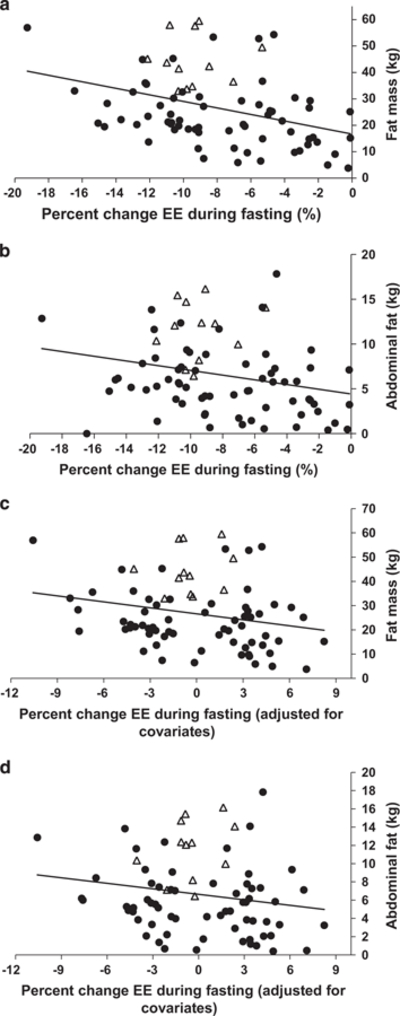
(a, b) Correlation of fat mass, abdominal fat and percent change in 24 h energy expenditure in response to fasting (r = −0.36, P = 0.001; ρ = −0.34, P = 0.003, respectively). (c, d) Correlation of fat mass, abdominal fat and percent change in 24 h energy expenditure in response to fasting after adjustment for fat-free mass, age, sex, race and ambient temperature (β = −0.16%EE per kg, P = 0.003, (−0.26, −0.06); β = −0.0004%EE per kg, P = 0.03, (−0.0007, −0.00004), respectively). Filled circles represent subjects with a wide BMI range (17.8─50.0) participating in study NCT00523627; open triangles represent 12 obese individuals (BMI range: 30.0─50.0) evaluated prior to participation in a caloric restriction weight loss study ((NCT00687115; details can be found here6).
Associations between average CBT, the %EE responses to fasting and overfeeding and body composition
Men (n = 34) had a lower mean CBT than women (n = 12) during energy balance (36.82 vs 37.17 °C, P = 0.0002). Similar differences were seen during fasting and overfeeding. Because of these differences and because of differences in temperature in women due to the menstrual cycle, all further CBT analyses were limited to men. In men, the mean CBT was greater during overfeeding compared with energy balance (36.96 ± 0.18 vs 36.82 ± 0.27 °C, P = 0.02), and fasting (36.96 ± 0.18 vs 36.86 ± 0.24 °C, P = 0.003). There was no difference between CBT during fasting and energy balance. The %EE decrease with fasting was correlated with all measures of CBT including during fasting (r = 0.36, P = 0.03), energy balance (r = 0.42, P = 0.01), overfeeding (r = 0.56, P = 0.0008), and the combined average CBT (r = 0.59, P <0.0001) (Figure 3). When individuals were categorized as thrifty or spendthrift, thrifty men had a lower combined average CBT (36.80 vs 36.96 °C; P = 0.004) compared with spendthrift men. Even after adjusting for covariates, the combined average CBT (β = 1.43%EE per 0.1 °C, P = 0.0003, (0.72, 2.15)) (Table 3) was an independent predictor of the %EE response to fasting. Results were similar if the individual CBT values during the dietary interventions were used. The %EE increase with overfeeding was not associated with any measure of CBT including during fasting (r = −0.22, P = 0.2), energy balance (r = 0.24, P = 0.16), overfeeding (r = −0.13, P = 0.5) or combined average CBT (r = 0.03, P = 0.86), and CBT was not an independent predictor of the %EE response to overfeeding after adjusting for covariates (all P>0.1). We found no independent associations between FM, AF and CBT during any of the diets, nor between FM, AF and diurnal CBT. There were no correlations between the %EE changes during overfeeding and fasting and the corresponding changes in CBT. Plasma TSH levels did not correlate with the %EE response to fasting, the response to overfeeding, nor with any CBT measures, in either men or the whole group.
Figure 3.
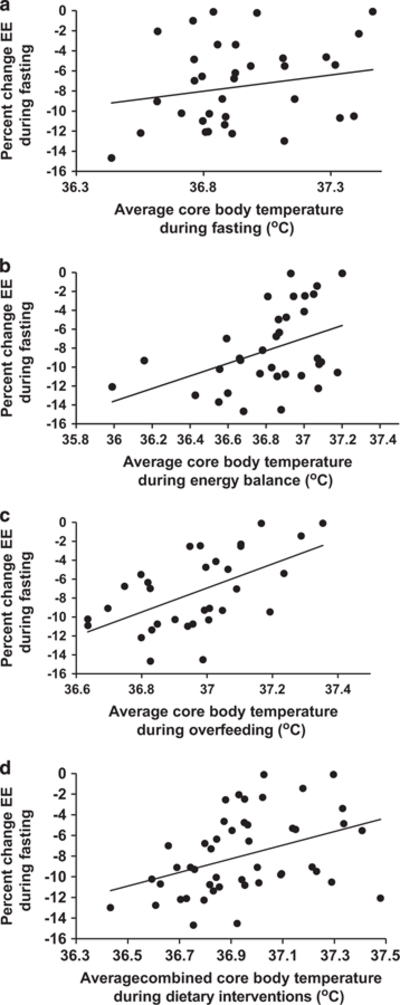
Correlation between the EE response to fasting in men and average 24 h core body temperature during fasting (a; r = 0.36, P = 0.03, N = 36), energy balance energy balance (b; r = 0.42, P = 0.01, N = 34), overfeeding (c; r = 0.56, P = 0.0008, N = 32) and the combined average 24 h core body temperatures during fasting, energy balance and overfeeding (d; r = 0.59, P<0.0001, N = 44).
DISCUSSION
In a larger and more diverse population, this study confirmed the previous observation that humans with a greater EE decrease in response to fasting have a smaller EE increase in response to overfeeding and vice versa, that is, thrifty and spendthrift phenotypes.1 Those individuals who were classified as thrifty, based on a larger decrease in 24 h EE with fasting, have increased adiposity (FM adjusted for body size, that is, FFM) as well as decreased CBT during all dietary interventions, consistent with a more efficient metabolism.
There are a number of rodent models with a similar thrifty phenotype including relatively lower energy expenditure, low CBT (or cold intolerance) and an increased propensity for obesity.8,9,22–25 Interestingly, these models are produced by a variety of genetic defects.8,9,23–25 An association between low body temperature (although not all have been 24 h assessments) and human obesity has been indicated in some,26,27 but not all,16,17,28 studies. Our results add to this prior literature by confirming that there are human individuals with a lower CBT and a more energy conserving phenotype during fasting similar to phenotypes observed in the above mentioned rodent models. Twelve obese individuals included in this analysis were also participants in a CR study (CR occurred after these initial phenotypic profiling assessments) which demonstrated that more thrifty obese individuals were less successful at losing weight during 50% CR over 6 weeks of carefully controlled conditions.6 The integration of these subjects (BMI range: 30.0–50.0 kg m −2) into a population with a wider BMI range (17.8–50.0 kg m−2) demonstrates that these individuals with obesity were in fact positioned more towards the middle and thrifty end of the spectrum of EE responses to fasting. Nevertheless, even within this small obese population, there was sufficient intra-individual difference in the EE response to fasting to characterize more spendthrift individuals who lost more weight with the same degree of CR.6
To put our main findings into context, a 0.1 °C lower CBT was associated with a 1.4% greater decrease in EE during fasting, the trait we used to define the thrifty phenotype. Fat mass and abdominal fat were each negatively related to the EE decrease with fasting. On average, thrifty men had a 0.16 °C lower CBT, 7.0 kg more FM and 1.7 kg more AF compared those with a spendthrift phenotype. However, the cross-sectional study design does not allow conclusions about the directionality of our findings. Whether more efficient EE responses to fasting and overfeeding predisposes a person to increased adiposity, or whether adiposity modulates the EE responses to dietary extremes through its insulating properties remains to be established. However, evidence demonstrating that the amount of voluntary weight loss over longer periods in obese individuals6 and future weight change during free living conditions in adults21 may be reflected in the short-term energy expenditure adaptations to fasting or overfeeding may support the former possibility. Because CBT is tightly controlled11 through homeostatic mechanisms, it seems plausible that inter-individual variations in CBT may impact the EE responses to fasting rather than the other way around. Data from the Baltimore Longitudinal Study of Aging indicate that men with body temperature below the median live longer,29 which makes it tempting to speculate that a more energy-conserving (thrifty) phenotype can result in increased longevity. Such a phenotype would also likely promote increased survival in times of food scarcity; however, with the current food abundance associated with modern living conditions, a thrifty phenotype is more likely to contribute to an increased predisposition to weight gain. The speculation that a more energy conserving phenotype may increase lifespan is supported by prior reports of an association between increased 24 h EE and mortality.30
Although they were both significant, the estimate of the relationship between the %EE decrease with fasting and abdominal fat volume was multifold smaller than the estimate for whole body fat mass. This is most likely because abdominal fat represents a smaller absolute amount of adipose tissue. However, a past study has shown evidence of greater postprandial heat leakage across the abdominal wall in un-insulated lean men compared with obese or lean men with artificial insulation placed around the abdomen. These results were based on CBT measurements for two hours following the ingestion of a large meal.15 In our study, neither whole body fat mass nor abdominal fat volume was associated with CBT nor daytime CBT, with daytime CBT representing the period when diet-induced thermogenesis is apparent. Of note, we measured CBT for >16 h versus the 2 postprandial hours evaluated in this previous study.15 While more abdominal adipose tissue may provide an insulating layer that decreases heat leakage across the abdominal wall acutely and especially during the immediate postprandial period, given time, obese individuals likely redistribute the heat to augment heat release from the extremities, thereby helping to maintain the individual temperature set point over 24 h.31–35 To fully understand the presumably complex interplay of CBT and obesity in metabolically thrifty and spendthrift individuals, prospective investigation will be needed.
Whether the combination of energy conserving traits in the thrifty phenotype is the result of genetics,36 sympathetic nervous system responses,37–39 prior weight loss attempts,40 differing levels of physical fitness or individual hormonal responses is unclear. Plasma TSH levels did not correlate with the EE responses to fasting and overfeeding or with CBT; however, we did not have measures of other hormones including thyroxine or triiodothyronine. It is possible that our subjects had variable amounts of brown adipose tissue, which may influence both human energy expenditure and maintenance of CBT.41 The inpatient nature of the study combined with the high demand and limited availability of the whole-room indirect calorimeter made it impractical to synchronize the multiple CBT measurements with the follicular phase of the menstrual cycle in women. However, the number of men in the study provided a large enough sample size to explore the relationships between CBT and other variables. Although we found lower CBT and increased FM in thrifty individuals, we did not observe a correlation between FM and CBT. The relationship between CBT and FM is likely complex and probably includes modifying factors as the accumulation of FM will provide insulation, thus potentially increasing CBT slightly and therefore, obscuring a clear correlation between CBT and FM, which would have been expected and could have possibly been shown with a larger sample size. Since our measurements of CBT were limited to a subset of our subjects, additional studies will be needed to verify our results.
In conclusion, in this diverse population, we found that individuals with a larger decrease in energy expenditure during fasting had a lower CBT and also had greater adiposity. Thus, body temperature may be a further defining feature of the human thrifty phenotype and offer insight into contributors to the inter-individual variation observed in energy expenditure responses to CR or excess. It is possible that in the future CBT may be useful to identify an individual’s phenotype (thrifty or spendthrift), and thus, be harnessed to direct weight loss or weight maintenance efforts during life style interventions.
ACKNOWLEDGEMENTS
We thank the dietary, nursing and technical staff of the National Institutes of Health Clinical Unit in Phoenix, AZ, USA, for their assistance. Most of all, the authors thank the volunteers for their participation in the study. This research was supported by the Intramural Research Program of the National Institutes of Health, National Institute of Diabetes and Digestive and Kidney Diseases.
Footnotes
CONFLICT OF INTEREST
The authors declare no conflict of interest.
REFERENCES
- 1.Weyer C, Vozarova B, Ravussin E, Tataranni PA. Changes in energy metabolism in response to 48 h of overfeeding and fasting in Caucasians and Pima Indians. Int J Obes Relat Metab Disord 2001; 25: 593–600. [DOI] [PubMed] [Google Scholar]
- 2.Thearle MS, Pannacciulli N, Bonfiglio S, Pacak K, Krakoff J. Extent and determinants of thermogenic responses to 24 hours of fasting, energy balance, and five different overfeeding diets in humans. J Clin Endocrinol Metab 2013; 98: 2791–2799. [DOI] [PMC free article] [PubMed] [Google Scholar]
- 3.Garrow JS, Warwick P, Blaza S, Ashwell M. Predisposition to obesity. Lancet 1980; 315: 1103–1104. [DOI] [PubMed] [Google Scholar]
- 4.Miller DS, Mumford P, Stock MJ. Gluttony 2. Thermogenesis in Overeating Man. Am J Clin Nutr 1967; 20: 1223–1229. [DOI] [PubMed] [Google Scholar]
- 5.Ravussin E, Schutz Y, Acheson KJ, Dusmet M, Bourquin L, Jéquier E. Short-term, mixed-diet overfeeding in man: no evidence for “luxuskonsumption”. Am J Physiol 1985; 249: E470–E477. [DOI] [PubMed] [Google Scholar]
- 6.Reinhardt M, Thearle MS, Ibrahim M, Hohenadel MG, Bogardus C, Krakoff J et al. A human thrifty phenotype associated with less weight loss during caloric restriction. Diabetes 2015; 64: 2859–2867. [DOI] [PMC free article] [PubMed] [Google Scholar]
- 7.Klaus S, Münzberg H, Trüloff C, Heldmaier G. Physiology of transgenic mice with brown fat ablation: obesity is due to lowered body temperature. Am J Physiol 1998; 274: R287–R293. [DOI] [PubMed] [Google Scholar]
- 8.Lateef DM, Abreu-Vieira G, Xiao C, Reitman ML. Regulation of body temperature and brown adipose tissue thermogenesis by bombesin receptor subtype-3. Am J Physiol Endocrinol Metab 2014; 306: E681–E687. [DOI] [PMC free article] [PubMed] [Google Scholar]
- 9.Trayhurn P, Thurlby PL, James WPT. Thermogenic defect in pre-obese ob/ob mice. Nature 1977; 266: 60–62. [DOI] [PubMed] [Google Scholar]
- 10.Abreu-Vieira G, Xiao C, Gavrilova O, Reitman ML. Integration of body temperature into the analysis of energy expenditure in the mouse. Mol Metab 2015; 4: 461–470. [DOI] [PMC free article] [PubMed] [Google Scholar]
- 11.Kurz A Physiology of thermoregulation. Best Pract Res Clin Anaesthesiol 2008; 22: 627–644. [DOI] [PubMed] [Google Scholar]
- 12.Landsberg L, Young JB, Leonard WR, Linsenmeier RA, Turek FW. Is obesity associated with lower body temperatures? Core temperature: a forgotten variable in energy balance. Metabolism 2009; 58: 871–876. [DOI] [PubMed] [Google Scholar]
- 13.Young RA. Fat, energy and mammalian survival. Am Zool 1976; 16: 699–710. [Google Scholar]
- 14.Jéquier E, Gygax PH, Pittet P, Vannotti A. Increased thermal body insulation: relationship to the development of obesity. J Appl Physiol 1974; 36: 674–678. [DOI] [PubMed] [Google Scholar]
- 15.Brundin T, Thörne A, Wahren J. Heat leakage across the abdominal wall and meal-induced thermogenesis in normal-weight and obese subjects. Metabolism 1992; 41: 49–55. [DOI] [PubMed] [Google Scholar]
- 16.Heikens MJ, Gorbach AM, Eden HS, Savastano DM, Chen KY, Skarulis MC et al. Core body temperature in obesity. Am J Clin Nutr 2011; 93: 963–967. [DOI] [PMC free article] [PubMed] [Google Scholar]
- 17.Hoffmann ME, Rodriguez SM, Zeiss DM, Wachsberg KN, Kushner RF, Landsberg L et al. 24-h Core Temperature in Obese and Lean Men and Women. Obesity 2012; 20: 1585–1590. [DOI] [PubMed] [Google Scholar]
- 18.American Diabetes Association. Diagnosis and classification of diabetes mellitus. Diabetes Care 2013; 36: S67–S74. [DOI] [PMC free article] [PubMed] [Google Scholar]
- 19.Ferraro R, Boyce VL, Swinburn B, De Gregorio M, Ravussin E. Energy cost of physical activity on a metabolic ward in relationship to obesity. Am J Clin Nutr 1991; 53: 1368–1371. [DOI] [PubMed] [Google Scholar]
- 20.Ravussin E, Lillioja S, Anderson TE, Christin L, Bogardus C. Determinants of 24-hour energy expenditure in man. Methods and results using a respiratory chamber. J Clin Invest 1986; 78: 1568–1578. [DOI] [PMC free article] [PubMed] [Google Scholar]
- 21.Schlögl M, Piaggi P, Pannacciuli N, Bonfiglio SM, Krakoff J, Thearle MS. Energy expenditure responses to fasting and overfeeding identify phenotypes associated with weight change. Diabetes 2015; 64: 3680–3689. [DOI] [PMC free article] [PubMed] [Google Scholar]
- 22.Davis TRA, Mayer J. Imperfect homeothermia in the hereditary obese-hyperglycemic syndrome of mice. Am J Physiol 1954; 177: 222–226. [DOI] [PubMed] [Google Scholar]
- 23.Jürgens HS, Schürmann A, Kluge R, Ortmann S, Klaus S, Joost H-G et al. Hyperphagia, lower body temperature, and reduced running wheel activity precede development of morbid obesity in New Zealand obese mice. Physiol Genomics 2006; 25: 234–241. [DOI] [PubMed] [Google Scholar]
- 24.Zhang X, Lam KSL, Ye H, Chung SK, Zhou M, Wang Y et al. Adipose Tissue-specific inhibition of hypoxia-inducible factor 1α induces obesity and glucose intolerance by impeding energy expenditure in mice. J Biol Chem 2010; 285: 32869–32877. [DOI] [PMC free article] [PubMed] [Google Scholar]
- 25.Bal NC, Maurya SK, Sopariwala DH, Sahoo SK, Gupta SC, Shaikh SA et al. Sarcolipin is a newly identified regulator of muscle-based thermogenesis in mammals. Nat Med 2012; 18: 1575–1579. [DOI] [PMC free article] [PubMed] [Google Scholar]
- 26.Adam K Human body temperature is inversely correlated with body mass. Eur J Appl Physiol 1989; 58: 471–475. [DOI] [PubMed] [Google Scholar]
- 27.Rising R, Keys A, Ravussin E, Bogardus C. Concomitant interindividual variation in body temperature and metabolic rate. Am J Physiol 1992; 263: E730–E734. [DOI] [PubMed] [Google Scholar]
- 28.Rising R, Fontieille AM, Larson DE, Spraul M, Bogardus C, Ravussin E. Racial difference in body core temperature between Pima Indian and Caucasian men. Int J Obes Relat Metab Disord 1995; 19: 1–5. [PubMed] [Google Scholar]
- 29.Shock NW, Others A Normal Human Aging: The Baltimore Longitudinal Study of Aging 1984. Nov (cited 2015 May 19); Available from http://eric.ed.gov/?id=ED292030.
- 30.Jumpertz R, Hanson RL, Sievers ML, Bennett PH, Nelson RG, Krakoff J. Higher energy expenditure in humans predicts natural mortality. J Clin Endocrinol Metab 2011; 96: E972–E976. [DOI] [PMC free article] [PubMed] [Google Scholar]
- 31.LeBlanc J Subcutaneous fat and skin temperature. Can J Biochem Physiol 1954; 32: 354–358. [PubMed] [Google Scholar]
- 32.Frim J, Livingstone SD, Reed LD, Nolan RW, Limmer RE. Body composition and skin temperature variation. J Appl Physiol 1990; 68: 540–543. [DOI] [PubMed] [Google Scholar]
- 33.Aita M, Yoshizumi K. [The effects of environmental thermal condition on transitional skin temperature of peripheral parts of human hands and feet during exercise]. Ann Physiol Anthropol 1994; 13: 421–427. [DOI] [PubMed] [Google Scholar]
- 34.Claessens-van Ooijen AMJ, Westerterp KR, Wouters L, Schoffelen PFM, van Steenhoven AA, van Marken Lichtenbelt WD. Heat production and body temperature during cooling and rewarming in overweight and lean men. Obesity (Silver Spring) 2006; 14: 1914–1920. [DOI] [PubMed] [Google Scholar]
- 35.Savastano DM, Gorbach AM, Eden HS, Brady SM, Reynolds JC, Yanovski JA. Adiposity and human regional body temperature. Am J Clin Nutr 2009; 90: 1124–1131. [DOI] [PMC free article] [PubMed] [Google Scholar]
- 36.Bouchard C, Tremblay A, Després J-P, Nadeau A, Lupien PJ, Thériault G et al. The response to long-term overfeeding in identical twins. N Engl J Med 1990; 322: 1477–1482. [DOI] [PubMed] [Google Scholar]
- 37.Saad MF, Alger SA, Zurlo F, Young JB, Bogardus C, Ravussin E. Ethnic differences in sympathetic nervous system-mediated energy expenditure. Am J Physiol 1991; 261: E789–E794. [DOI] [PubMed] [Google Scholar]
- 38.Tataranni PA, Young JB, Bogardus C, Ravussin E. A low sympathoadrenal activity is associated with body weight gain and development of central adiposity in Pima Indian men. Obes Res 1997; 5: 341–347. [DOI] [PubMed] [Google Scholar]
- 39.Rosenbaum M, Hirsch J, Murphy E, Leibel RL. Effects of changes in body weight on carbohydrate metabolism, catecholamine excretion, and thyroid function. Am J Clin Nutr 2000; 71: 1421–1432. [DOI] [PubMed] [Google Scholar]
- 40.Leibel RL, Rosenbaum M, Hirsch J. Changes in energy expenditure resulting from altered body weight. N Engl J Med 1995; 332: 621–628. [DOI] [PubMed] [Google Scholar]
- 41.Saito M Brown adipose tissue as a regulator of energy expenditure and body fat in humans. Diabetes Metab J 2013; 37: 22–29. [DOI] [PMC free article] [PubMed] [Google Scholar]