

Abstract
The Lunar Reconnaissance Orbiter (LRO) has been orbiting the Moon since 2009, obtaining unique and foundational datasets important to understanding the evolution of the Moon and the Solar System. The high-resolution data acquired by LRO benefit from precise orbit determination (OD), limiting the need for geolocation and co-registration tasks. The initial position knowledge requirement (50 meters) was met with radio tracking from ground stations, after combination with LOLA altimetric crossovers. LRO-specific gravity field solutions were determined and allowed radio-only OD to perform at the level of 20 meters, although secular inclination changes required frequent updates. The high-accuracy gravity fields from GRAIL, with <10 km spatial resolution, further improved the radio-only orbit reconstruction quality (<10 meters). However, orbit reconstruction is in part limited by the 0.3–0.5 mm/s measurement noise level in S-band tracking. One-way tracking through Laser Ranging can supplement the tracking available for OD with 28-Hz ranges with 20-cm single-shot precision, but is available only on the nearside (the lunar hemisphere facing the Earth due to tidal locking). Here, we report on the status of the OD effort since the beginning of the mission, a period spanning more than seven years. We describe modeling improvements and the use of new measurements. In particular, the LOLA altimetric data give accurate, uniform, and independent information about LRO’s orbit, with a different sensitivity and geometry which includes coverage over the lunar farside and is not tied to ground-based assets. With SLDEM2015 (a combination of the LOLA topographic profiles and the Kaguya Terrain Camera stereo images), another use of altimetry is possible for OD. We extend the ‘direct altimetry’ technique developed for the ICESat mission to perform OD and adjust spacecraft position to minimize discrepancies between LOLA tracks and SLDEM2015. Comparisons with the radio-only orbits are used to evaluate this new tracking type, of interest for the OD of future lunar orbiters carrying a laser altimeter. LROC NAC images also provide independent accuracy estimation, through the repeated views taken of anthropogenic features for instance.
Keywords: Lunar Reconnaissance Orbiter, Moon, Orbit Determination, Radio Tracking, Laser Altimetry
1. Introduction
The Lunar Reconnaissance Orbiter (LRO), after more than eight years since its launch in June 2009, continues to collect scientific data about the Moon. Our view and knowledge of the Moon was much improved thanks to all seven instruments onboard LRO. Indeed, LRO is now in its third extended science mission, named the ‘Cornerstone Mission’ which will address fundamental questions about the evolution of the Moon and our Solar System, from formational processes, such as early lunar tectonism, to evolutionary processes, such as the delivery and sequestration of volatiles, to contemporary processes, such as the temporal variations in near-surface dust and the present impact cratering rate.
To achieve its past and current objectives, the science data collected by the LRO instruments need to be geolocated and co-registered for calibration and analysis. This is particularly important for high-resolution instruments like the Lunar Orbiter Laser Altimeter (LOLA; Smith et al., 2010a, 2017) and the Lunar Reconnaissance Orbiter Camera (LROC; Robinson et al., 2010). In addition to their geometric calibration, which has improved with time with updates to the LOLA boresight (Smith et al., 2017) and LROC pointing (Speyerer et al., 2016), the accurate knowledge of LRO’s trajectory is critical to obtain geodetically-accurate datasets. The early results of the OD work (Mazarico et al., 2012) obtained spacecraft positions better than ∼ 20 meters, improved from the original 50 meters mission requirement (Chin et al., 2007).
In this work, we use established OD methodology to obtain improved orbital position knowledge of the LRO spacecraft. Other objectives, such as gravity field estimation, are possible with the same tools and techniques, but are outside of the scope of this work. The recent Gravity Recovery And Interior Laboratory mission (GRAIL; Zuber et al., 2013a,b) resulted in high-resolution gravity models (Lemoine et al., 2013, 2014; Goossens et al., 2014), which largely supersede what can be achieved with the lower-quality tracking data gathered by LRO and previous orbiters. We use the orbit determination and geodetic parameter estimation software GEODYN, developed and maintained at NASA Goddard Space Flight Center (GSFC). GEODYN has been used for decades for geodetic analysis of Earth-orbiting and planetary spacecraft, and implements numerous highly accurate force and measurement models to precisely reconstruct the spacecraft trajectory and reliably estimate model parameters.
Here, we present the latest results of the orbit determination work performed by members of the LOLA team for LRO. As an update to our previous work (Mazarico et al., 2012), this manuscript does not describe in detail all aspects of the LRO geodetic investigation, and the reader is referred to Mazarico et al. (2012) for background information. We start with a condensed overview of the LRO mission profile, particularly its orbit and tracking geometry (Section 2). After a description of the various datasets used for LRO OD (Section 3), the GEODYN software used to reconstruct the LRO trajectory is briefly described, with emphasis on the changes since Mazarico et al. (2012) (Section 4). In Section 5, we demonstrate the effects of varying a priori assumptions, particularly for the gravity field and for refined force modeling. We also evaluate the impact of improved modeling of solar radiation, with better eclipse timings and space-craft self-shadowing. Last but not least, in Section 6, we present a new aspect in our OD processing, namely how the laser altimetry data can be used as a tracking data type to support the LRO orbit determination, as well as the implications for the OD needs of future lunar orbiters. Section 7 gives a summary of the results.
2. Mission Overview
2.1. The orbit of LRO and its evolution
The LRO spacecraft has been orbiting the Moon since June 2009, long past its initial one-year ‘Exploration’ mission. After a short commissioning phase in a 30×200-km elliptical orbit, it operated in a 50 km-average orbit (±20 km). Due to its low altitude and polar inclination, this orbit required monthly station-keeping maneuvers for maintenance. After slightly more than two years, in December 2011, LRO was thus placed in a quasi-frozen elliptical orbit, similar to that of the commissioning phase. Several station-keeping (SK) maneuvers were performed subsequently in order to maintain low altitudes near the south, rather than for orbit lifetime issues; indeed, the current LRO orbit is stable until at least 2030 (M. Mesarch, private communication). In addition to the SK maneuvers, the LRO spacecraft is periodically commanded to perform angular momentum desaturation (AMD) maneuvers. These typically occur every two weeks, concomitant with a SK maneuver when possible.
Our analysis of the LRO tracking data follows the approximately monthly mission phases as used by the LOLA team in the processing and archiving the LOLA altimetric data. Up to the end of November 2016, 92 phases have been defined: the commissioning phase (CO), 13 phases for the nominal 1-year Exploration mission (NO), 26 phases for the 2-year Science Mission (SM), and 53 phases since for the Extended Science Missions (ES). The boundaries for the definition of these phases were typically chosen at the times of the SK maneuvers. However, since the transition to the elliptical orbit, AMD maneuvers at approximately monthly spacings are chosen. In this near-frozen orbit, particular conditions (around the noon-midnight geometry of β=0°; β is the viewing angle of the orbit from the Sun, with β=±90° indicating LRO is in full Sun) lead to slow momentum build-up, and AMDs can be separated by 6 weeks or more, in which case mission phases are adjusted to be commensurate with LOLA archive.
Figure 1 presents a detailed summary of the orbit evolution of LRO between 2009 and 2016, highlighting the changes in periapsis and apoapsis altitudes, periapsis latitude, inclination, and β angle. The orbit geometry chosen initially for LRO (β ∼ 0° at solstice) evolved slowly as the mission progressed. The inclination has been steadily decreasing since 2009, from ∼90.2° to ∼86.8° in 85 late 2016, with typical intra-monthly variations of approximately ±0.7°. As the inclination decreased, the nadir access to the regions surrounding the poles was reduced, as shown in Figure 2. This geometry has allowed integrating instruments such as LEND (Mitrofanov et al., 2010) to improve their signal-to-noise ratio (SNR) at latitudes substantially less than polar.
Figure 1:
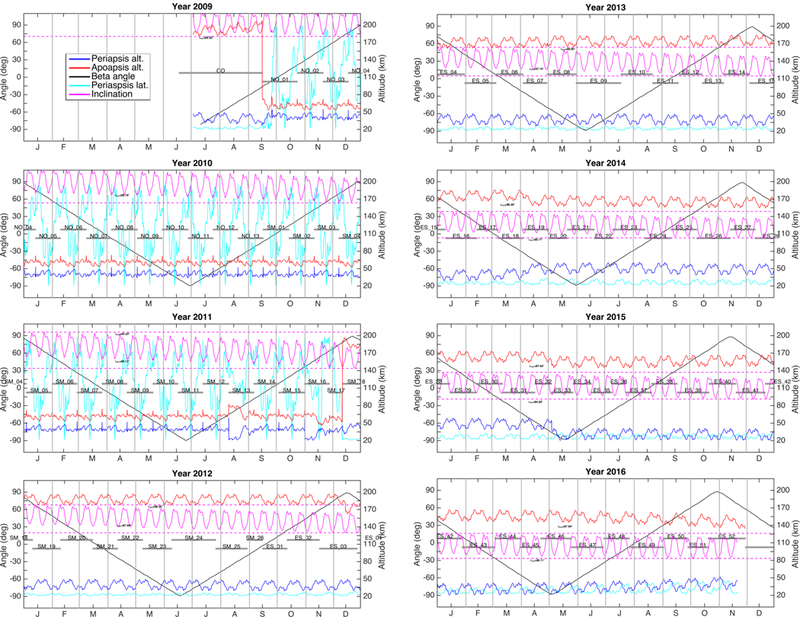
The evolution of key parameters describing the LRO orbital geometry is shown for years 2009 to 2016: apoapsis altitude (red); periapsis altitude (blue) and latitude (cyan); inclination (magenta, on a different scale with 30x magnification, refer to labeled minima and maxima); and solar β angle (±90° indicates face-on, full-Sun periods). The LRO mission phases used in the LOLA processing and followed in the OD work are shown in gray.
Figure 2:

Temporal coverage density over various LRO mission phases is shown for the 85°−90°S region, in a south pole stereographic projection. The color indicates the amount of time each km2 can be observed from LRO in an assumed perfectly nadir geometry (well-verified in real operations, with typical on-nadir duty cycles >98%). For spatial reference, the last map shows the areas in permanent shadow (Mazarico et al., 2011).
2.2. The LRO spacecraft
LRO is a 3-axis stabilized spacecraft designed to provide near-continuous nadir viewing for its seven science instruments. It is asymmetrical, with a single solar array on the -Y side pointed sunward in the -Z direction. Depending on the time of year (β angle), the solar array is either parked in a fixed position, or tracks the Sun when in view. Due to this asymmetry, the direction of flight of LRO changes every 6 months, from -X to +X forward and vice-versa. Its High-Gain Antenna is mounted on a long boom and is nominally pointed in the -Z direction. It is actuated by two gimbals separated by ∼ 10 cm, and tracks the ground stations.
The initial mass of LRO was above 1900 kg. The Lunar Orbit Insertion burn reduced it significantly, to < 1300 kg. Monthly SK maneuvers until December 2011 each used ∼ 7 kg of fuel. In December 2011, after the maneuver that placed it in the elliptical orbit in order to increase its lifetime, LRO mass was below 1100 kg with less than 50 kg of fuel. In this stable elliptical orbit, the primary fuel consumption is due to the regular momentum wheel desaturation maneuvers, which account for ∼ 2 kg/year. A few SK maneuvers, at an approximate yearly cadence, have maintained a low periapsis over the south pole, at a cost of ∼ 2 kg/year. LRO has now used > 96% of its initial propellant load, but the reserves can be sufficient for extending operations for another 5–10 years.
3. Datasets
The OD of the LRO spacecraft is made possible by the analysis of spacecraft tracking data. As typical, the majority of the LRO tracking data consists of radiometric Doppler and Range measurements acquired by various Earth-based ground stations. LRO is notable among planetary missions as having other tracking data types made possible by its onboard laser altimeter, LOLA (Smith et al., 2010a, 2017).
3.1. Radio tracking
While most recent NASA planetary missions operate at X-band frequencies, the LRO telecommunication subsystem consists of an S-band transponder. Although it has a Ka-band downlink capability, it is only used for telemetry and science data. All LRO Doppler data is obtained and archived with an integration time of 5 seconds.
White Sands.
The primary ground station for the LRO mission is the NASA White Sands station in New Mexico. Built for LRO, ‘WS1’ tracks the spacecraft daily over 8–10 hours. The regularity of this schedule is a strength for the OD, and for the evaluation of OD quality. Because the amount of tracking from other stations varied through the mission, the long daily tracking sessions from the White Sands station lends a uniformity to the dataset that is useful to monitor the OD performance. Considering the inherent limitations of S-band frequency, the quality of the White Sands range-rate measurements is good (0.2–0.3 mm/s), several times better in fact than the initial mission requirement of 1 mm/s. The Range data are affected by timing biases, typically well-behaved but showing enough scatter to warrant adjustment during OD.
USN.
The commercial Universal Space Network (USN) provided significant tracking coverage for LRO during the first 5 years of the mission. The primary purpose was to provide a realtime link to LRO for spacecraft telemetry and the monitoring and commanding of science instruments (e.g., LOLA Laser Ranging monitoring and Diviner commanding). These stations also provided tracking measurements, albeit of lower quality than White Sands. The range-rate precision is around 0.5–0.7 mm/s, again several times better than the requirement of 3 mm/s. The USN range data suffer from timing biases, with more scatter than the White Sands range data. Seven USN stations were used, most through the entire LRO mission, except for a station in Hawaii (115) starting in April 2012 and a station in Weilheim, Germany (128) only rarely used. Starting September 2014, corresponding to the start of LRO’s Extended Science Mission 2 (ESM2), the use of USN was much reduced in a cost-cutting effort. That led to some changes in instrument operations, due to the loss of realtime telemetry over most Earth longitudes, and resulted in loss of near-continuous tracking coverage. This initially prompted questions of whether orbit reconstruction accuracy would deteriorate (see Section 5.3), and contributed to further developing the ‘direct altimetry’ measurement approach. The USN still provides tracking on a pass-by-pass basis for ad hoc support of spacecraft operations, and we use those data when available.
DSN.
The NASA Deep Space Network (DSN) is the most commonly used ground station network for planetary missions. Its three complexes in Goldstone (California), Madrid (Spain), and Canberra (Australia) provide near-complete sky coverage (Kegege et al., 2012). It was however not used by LRO except for critical events such as Lunar Orbit Insertion and bi-weekly maneuvers (for angular momentum wheel desaturation and station keeping). Because the orbit perturbations introduced by such maneuvers are large and uncertain, and because the LRO instruments are turned off during these events obviating the need for high-quality orbits, no precise orbit determination is performed during the time periods covered by these infrequent DSN passes. As such, the DSN data are not used in our analysis. We note that since September 2014 the DSN does provide more regular tracking support, but typically only one tracking pass (∼ 1 hour) per day.
All the radiometric LRO tracking data, acquired by the White Sands, USN, and DSN stations, are archived at the Planetary Data System (PDS) Geosciences Node1, and at the annex MIT LOLA PDS Data Node2.
3.2. Altimetric Data
The Lunar Orbiter Laser Altimeter (LOLA) instrument (Smith et al., 2010a, 2017) onboard LRO was selected in order to provide accurate topographic information of fifty ‘Constellation sites’ of high interest for future human exploration (Chin et al., 2007; Gruener et al., 2009) and of the poles (including permanently shadowed regions). LOLA was the first space multi-beam laser altimeter. It acquired nearly 7 billion altimetric measurements to date, predominantly over the first few years of the LRO mission (3 billion by November 2010, and 6 billion by February 2013). The high-latitude convergence of the tracks due to the ∼ 90° inclination yielded excellent high-resolution coverage in the polar regions, and the >33,000 ground tracks constrain the global shape and provide a reference frame for the Moon to an unprecedented degree and accuracy. The precision of individual LOLA measurements is around 10 cm (Smith et al., 2010a). An estimate of absolute accuracy needs to consider other error contributions, primarily instrument pointing and spacecraft position. The former is often a challenge for laser altimeters, but especially for LOLA due to the unexpected ‘LOLA thermal blanket anomaly’ recognized early in the LRO mission and described in Smith et al. (2010a, 2017). Thermal contraction of the blanket attached to the beam expander and receiver telescope was found to be its cause, by pulling the beam expander out of co-alignment with the receiver telescope. Thanks to its 5-beam pattern and the magnitude and direction of this temperature-dependent effect, nighttime laser pulses from two of the five LOLA beams could still be received and time-tagged by two detectors intended for other channels. The large number of altimetric crossovers accumulated over the course of several years of the LRO mission and a few Earth scan experiments involving ground-based assets at NASA GSFC helped calibrate the pointing for both daytime (near-nominal) and nighttime (misaligned) configurations (Mazarico et al., 2014a).
Early in the LRO mission, considerable effort was spent to include LOLA altimetric crossovers in the OD process and to obtain LRO-specific lunar gravity field solutions to further improve orbit reconstruction quality (Mazarico et al., 2012). Because crossovers relate two intersecting tracks through a relative differential constraint, they require a longer temporal baseline. Practically, this is done through a multi-satellite approach within NASA/GSFC’s GEODYN OD software (Pavlis et al., 2012), but it results in slower execution runtime and complex data pre- and post-processing. After the development of the LLGM-2 gravity field (Mazarico et al., 2012) and especially after the GRAIL mission, the benefits of such analysis were deemed too marginal to warrant the added effort, and we stopped using LOLA altimetric crossovers for OD.
As will be described in Section 4.4, we recently adopted another altimetric measurement type, previously used in Earth geodesy on missions such as ICESat (Luthcke et al., 2000) and the Near-Earth Asteroid Rendezvous mission (NEAR, Zuber et al., 2000). While in those cases, altimetric ranges were compared to low-resolution, smooth ocean and terrain shape models in order to improve instrument pointing knowledge or asteroid shape, here we exploit the high accuracy and resolution of the LOLA topographic maps themselves in order to adjust spacecraft orbital parameters. We thus demonstrate how, now that the GRAIL and LRO missions have yielded these foundational datasets, spacecraft orbit determination with altimetric ranges, either alone or in concert with regular radio tracking, performed at similar or better accuracy.
3.3. Laser Ranging
Because the anticipated quality of the S-band tracking was not sufficient to meet the LRO position knowledge requirement, a Laser Ranging (LR) experiment was added to the LRO payload (Zuber et al., 2010). LR could be added relatively late during mission development thanks to its leveraging the LOLA instrument for laser pulse detection and time-tagging, and the presence of an ultra-stable oscillator (USO) onboard LRO. A small telescope mounted on the LRO High-Gain Antenna allowed LOLA to be in constant view of the Earth stations from the Satellite Laser Ranging (SLR) network. A fiber optic bundle transmitted the 532-nm laser pulses received from Earth to a detector of the LOLA instrument, which timetagged these one-way LR pulses during the ‘Earth range window’, a time period within each 28-Hz measurement frame not used for the primary lunar altimetric ranging. Analysis of the SLR laser fire times and LOLA received times provided the one-way Range observables to be processed during OD. The OD analysis had to consider and estimate the long-term behavior and stability of the LRO USO. Over the more than 5 years the LR experiment operated, 10 stations successfully ranged to LRO. The primary LR station at NASA GSFC accounted for 33% of the total data returned. With an average of ∼16 hours per week, the LR experiment was a success when considering the numerous operational and weather-related challenges. Other studies have shown the benefits of LR data to LRO OD (Mao et al., 2011; Buccino et al., 2016; McGarry et al., 2016; Bauer et al., 2017; Mao et al., 2017), and in particular that LR can achieve orbit quality on a par with the radio tracking when using the GRAIL gravity field (Mao et al., 2017). In this work, we do not use the laser ranging data, instead focusing on the combination of radio tracking and altimetry.
4. Methods
4.1. GEODYN
GEODYN (Pavlis et al., 2012) is the key software system used in this work, enabling high-quality orbit determination due to a number of state-of-the-art force and measurement models and algorithms developed over decades at NASA GSFC. In brief, GEODYN integrates the LRO spacecraft trajectory using a set of force models (effects from planets’ masses and the Moon’s full gravity field, radiation pressure, relativity, etc.). Concurrently, using a set of measurement models, GEODYN computes the measurement values expected at the times of the actual tracking data, given that numerically integrated trajectory. The discrepancies between observed and computed values, called residuals, are minimized through an iterative least-squares process (Tapley et al., 2004). Though its concept can thus be simply described, the quality of OD lies in the accuracy and exhaustiveness of the force and measurement models.
We use the JPL Developmental Ephemerides (DE) for the planetary positions and lunar orientation model (DE421 as adopted by the LRO project; Folkner et al., 2008; Williams et al., 2008). We apply corrections to the radiometric measurements to account for media effects. Weather data from the tracking stations are used as inputs to compute the tropospheric delay (wet and dry). The a priori hydrostatic zenith delay is based on Saastamoinen (1972) and mapped to other elevations using the GMF model (Boehm et al., 2006). Radio frequency perturbations from the Earth ionosphere can be large in the S band, and we apply corrections based on raytracing through Global Ionospheric Model (GIM; Noll, 2010) 2-hour maps (rotated and interpolated, as detailed in Lemoine et al., 2013).
In addition to our own previous work on LRO (Mazarico et al., 2012; Mao et al., 2013, 2017), GEODYN has been used for all geodetic analysis of spacecraft tracking data at NASA GSFC, for missions as varied as Clementine (Lemoine et al., 1997), NEAR (Zuber et al., 2000), Mars Global Surveyor (Lemoine et al., 2001; Genova et al., 2016), Lunar Prospector (Mazarico et al., 2010a; Goossens and Matsumoto, 2008), Mars Odyssey (Mazarico et al., 2007; Genova et al., 2016), Mars Reconnaissance Orbiter (Mazarico et al., 2008; Genova et al., 2016), MESSENGER (Smith et al., 2010b, 2012; Mazarico et al., 2014b), and Dawn (Mazarico et al., 2015). Over the years, new capabilities have been added to GEODYN, especially as far as planetary missions are concerned due to new planetary target or specific instrument requirements, and new measurement strategies (Neumann et al., 2001; Mazarico et al., 2010b, 2015). GEODYN has also been used by other groups, for instance to analyze the tracking data of the JAXA SELENE spacecraft (Goossens et al., 2011a,b), and of LRO itself (Maier and Baur, 2016).
Our first publication on the orbit determination effort for LRO (Mazarico et al., 2012) provided numerous details on the methodology, and we largely use the same GEODYN capabilities and follow the OD strategy adopted at that time. The reader is thus referred to this earlier work (Mazarico et al., 2012) for specific details on GEODYN. Here, we instead describe several of the modeling changes that have since been adopted for LRO OD.
4.2. Eclipse Transition
During the analysis of the GRAIL spacecraft data, spurious signals at the ∼ 1 µm/s level in the Ka-Band Range-Rate (KBRR) data residuals were observed at nearly periodic intervals (Lemoine et al., 2014). Further identified to occur around the times when the twin spacecraft were entering or exiting eclipse, a more detailed modeling of the lunar shape to compute the incoming solar radiation significantly reduced the artifacts due to solar radiation mismodeling. Although the noise floor of the LRO radio tracking data is much larger than the GRAIL KBRR, we adopted this modeling enhancement, primarily because of the difference between average nearside and farside radii, and the fact that the default umbra/penumbra model in GEODYN uses the reference radius of the gravity field, 1738 km, potentially introducing systematic effects. We use the LOLA lunar topography model to 64 pixels/degree (ppd) archived at the NASA PDS (Smith et al., 2010a), and model the Sun as 500 discrete sub-sources with varying flux values to account for limb darkening. We also account for lunar eclipses due to the Earth, which occur about twice a year, at varying degrees.
Figure 3a gives an example of the percentage of the solar disc visible from LRO, computed with a 1738 km-sphere and with the LOLA shape model. At β angle values around 70–74° (previously 75–78° in the circular orbit), corresponding to the transition to or from the eclipse seasons, the differences are sometimes large, with the spherical model often missing or delaying some eclipses. Figure 3b shows the model differences of the time LRO spends in sunlight during each orbit over the whole mission. Discrepancies are typically <10 s for |β| <30°, and <20 s for |β| <60°. However, they can reach ∼−480 seconds for |β| >70°. In these β conditions, these differences are nearly always negative in the eccentric orbit, whereas they were more balanced around zero in the circular orbit. Although empirical accelerations and solar radiation scale factors can in part accommodate solar radiation pressure mismodeling, those related to eclipse timing errors are at short timescales that are difficult to absorb.
Figure 3:

(a) Comparison of per-orbit Sun visibility predictions from the LOLA (top) and spherical (bottom) lunar shapes. The vertical axis gives the time within each orbit. This example is at the beginning of the January 2013 eclipse season. (b) Effect of the choice of lunar shape for the amount of time LRO is predicted to be in sunlight. Negative values values indicate reduced solar radiation pressure accelerations with the actual lunar topography.
4.3. Self-Shadowing
The mismodeling of non-conservative forces can be one of the largest error sources for orbital position knowledge. A slight mismodeling will have a compound effect when integrated over long time periods, and they are the principal reason (aside from spacecraft thrusting maneuvers) for the relatively short integration batches (‘arcs’) typically selected for OD (2.5 days in the case of LRO, Mazarico et al., 2012). In addition to errors in spacecraft material reflective properties which can only be calibrated through estimation during the OD process, these surface accelerations can be mismodeled if the spacecraft area is miscomputed. GEODYN has long had the capability to use a simple spacecraft plate model to compute the spacecraft cross-section from a given direction (velocity vector for drag computations, Sun direction for direct solar radiation pressure; Marshall and Luthcke, 1994). However, with complex space-craft shapes and/or movable elements, the cross-sectional area is overestimated when self-shadowing is ignored. Indeed, when a plate partly obscures another, the nominal cross-section model will double-count this overlap.
By computing the intersections of the spacecraft plates projected along the viewing direction, and accounting for this double-counting, it is possible to compute the correct cross-section. First implemented in GEODYN for the Mars Odyssey mission to improve density estimates of the Martian exosphere (Mazarico et al., 2007), this capability was used for both atmospheric drag and solar radiation in the recent analysis of the combined Mars Global Surveyor, Mars Odyssey, and Mars Reconnaissance Orbiter tracking datasets to obtain a high-resolution Mars gravity field (Genova et al., 2016). Of course in the case of the Moon, atmospheric drag is not considered. We note that we currently only model self-shadowing in the computation of the direct solar radiation, not for the non-conservative accelerations due to reflected sunlight (‘albedo’) and due to the lunar thermal emission. Indeed, while for the direct solar radiation we only need to compute the cross-section seen from the Sun direction, a large number of elements on the lunar surface would need to be considered for these other radiation pressure contributions. The limited improvement currently seen by accounting for the self-shadowing may be further improved by extending the computations to the albedo and thermal radiation pressure accelerations, but at significant additional computational expense.
Figure 4 shows an example of the effect of self-shadowing on the LRO cross-section. Figure 5 documents this effect over the whole mission, showing how the self-shadowing impact is decreased over certain geometries (β <30°).
Figure 4:

Temporal history of the effect of self-shadowing in % of total spacecraft cross-section in the Sun direction over ∼ 1 year. Each column corresponds to one orbit (∼ 2 hours). The two operational modes for the LRO solar array (fixed and Sun-tracking) are clearly visible. Vertical streaks correspond to spacecraft slews.
Figure 5:

The impact of self-shadowing on the spacecraft cross-section in the Sun direction (in %) is plotted against the absolute of the β angle which describes the viewing angle of the LRO orbit from the Sun (β = 90° corresponds to face-on). The color indicates the date, as indicated by the color bar, and shows that the year-to-year variations are very repeatable.
4.4. Direct Altimetry
Previous work with planetary laser altimeters used crossover measurements as a geodetic tracking type to improve spacecraft ephemeris reconstruction and gravity field recovery (Rowlands et al., 1999; Neumann et al., 2001; Goossens et al., 2011b; Mazarico et al., 2012). Two segments of altimetric profiles that intersect are processed during the OD iterations, and contribute to the geodetic parameter estimation by pushing this estimation to minimize the distance between the two curves describing the surface topography. Although powerful (especially in the case of LOLA where effectively five single-beam tracks intersect at each crossover location, yielding 25 ground track intersections; Rowlands et al., 2008), the use of crossover measurements is computationally intensive, logistically difficult to produce and analyze, and limited spatially. In the case of the Moon and a polar orbiter in particular, the vast majority of crossovers occur near the poles.
Now that LOLA has acquired the highest-quality topographic model of the Moon (Smith et al., 2017), and has been combined with the Kaguya Terrain Camera stereo-derived elevation model to produce the global high-resolution (512 ppd) geodetically-accurate (tied to LOLA at submeter-level) shape model SLDEM2015 (Barker et al., 2016), another altimetric measurement proves even more useful to orbit reconstruction. That measurement type is not new, having been implemented and used in GEODYN for the ICESat mission (Luthcke et al., 2000). GLAS altimetric data were used over the Earth oceans to calibrate the laser boresight pointing and achieve improved positioning accuracy over the polar regions. Differences in geolocated height of profiles with respect to an ocean surface reference model were primarily attributable to pointing errors, given the good long-wavelength knowledge of the ocean surface (geoid).
Extending this technique to short-scale, high-resolution targets, we can use the LOLA and SLDEM2015 topographic models as basemaps for this ‘direct altimetry’ measurement. Figure 6 illustrates the difference between crossover and direct altimetry measurements. The information contained in an altimetric crossover is that two 3-D topographic profiles should intersect at one point. These constraints are rare (only when ground tracks cross) and relatively weak (the true intersection point is not known). On the other hand, the adjustment of altimetric ranges directly against a precise LOLA-based topography model is unambiguous, geometrically stronger, geodetically accurate, and possible over the whole altimetric profile’s length provided a good basemap is available. Individual LOLA ranges are matched to the basemap during orbit determination, through adjustment of both spacecraft position and pointing, in order to minimize the discrepancies. Similarly, iterative adjustments have been performed in the past to improve the accuracy of topographic models (Zuber et al., 2012; Gläser et al., 2013, 2014), but the iterative matching within the dynamical framework of GEODYN results in more robust and realistic spacecraft trajectory. The high quality of the topographic datasets, not available in the past, is key to enabling this method.
Figure 6:

Examples summarizing the geometry of the crossover and direct altimetry measurements.
Some limitations on the coverage existed initially, due to the size of the basemaps that could be loaded in GEODYN. Indeed, the resolution of these maps needs to be commensurate with the LRO position knowledge (<20 m) to be able to contribute to the OD quality. We improved our initial implementation to utilize large topographic maps, such as SLDEM2015 (60 m/pixel or better globally).
5. Orbit Determination with Radio Tracking
5.1. Data Processing
We analyzed the radio tracking data acquired by the White Sands and USN tracking stations between July 2009 and November 2016. We followed the same OD strategy as before Mazarico et al. (2012), with ‘arcs’ typically 2.5 days long in order to include 3 White Sands passes. The White Sands pass at the beginning of each arc provides an overlap period with the previous arc, and conversely the end of the arc coincides with the end of another White Sands tracking pass two days later. Every other White Sands tracking pass is thus contained within two consecutive arcs. This typical arc length is impacted by the presence of spacecraft events (maneuvers for the great majority; safe modes a few times), either reducing them to 1–1.5 days, or lengthening them to a maximum of 3.5–4 days. In total, the LRO trajectory over >7 years is divided into 1304 arcs.
Each arc is first forward-integrated based on an initial state obtained from the daily reconstructions by the navigation team, with the GRAIL gravity field GRGM900C (Lemoine et al., 2014) truncated at Lmax=270. The measurement residuals are evaluated to remove any outliers and identify tracking passes with specific issues (e.g., adding an individual measurement or timing bias if it does not follow the per-arc biases used nominally). The arc is then iteratively converged, still with Lmax=270, by estimating six spacecraft state parameters, one solar radiation scale factor and one empirical acceleration. Further data editing is performed with automatic filtering algorithms before final visual inspection. The estimated spacecraft state, solar radiation scale factor, and empirical constant along-track acceleration are then used as a priori values for a final convergence with the field truncated to Lmax=600. The integration time step is reduced from 5 seconds to 1.25 seconds, and the newly-converged trajectory is output with a 5-s time step.
These trajectory files are then combined into batches approximately one month long, following the conventions used for the LOLA altimetric data archive, and converted to NAIF SPICE format. These higher-quality trajectory reconstructions are shared with the LRO instrument teams, in particular LROC to support instrument calibration (Speyerer et al., 2016), analysis (Wagner et al., 2017) or the production of higher-level products such as mosaics. These SPK files are then archived on a best-effort basis at the LRO Radio Science archive (imbrium.mit.edu).
5.2. Results
Data Fit.
Data fits are an important measure of OD quality, since the measurement residuals (observed minus computed values of the observable) are what GEODYN minimizes iteratively. The LRO residuals may still show some structure, partly because of timing. The time series over the whole mission of the residual root mean square (RMS) per arc is plotted in Figure 7.
Figure 7:

Time series of Doppler (left) and Range (right) residual RMS values of each LRO OD arc.
Data Quality.
Except for first-order trends which result from mismodeling effects, the scatter of the pass-by-pass residuals can be used to assess the quality of the data acquired by each station, which can be informative in order to weight the data appropriately during further processing. During post-processing analysis of the residuals obtained from OD-converged arc measurements, we first detrend each tracking pass by removing a fitted spline curve, and apply several sigma-threshold filters to remove potential remaining outliers. Figure 8 shows the time series and distribution of the Doppler noise for the various stations that tracked LRO between 2009 and 2016.
Figure 8:

(Left) Time series of the pass-by-pass RMS of detrended Doppler residuals. Each pass is color-coded with its tracking station, which highlights the specific performance and characteristics of each station. (Right) Associated per-station histograms of the per-pass noise level.
As stated in Section 3.1, the primary station at White Sands (119) performs the best, with an overall RMS of 0.2 mm/s. After hardware improvements, the quality improved from 0.22 mm/s prior to August 2012 to 0.13 mm/s thereafter. The performance of the Dongara (Australia) USN station (103) improved in September 2012 from ∼ 0.63 mm/s to 0.3 mm/s. The South Point (Hawaii) USN station (105) saw a similar improvement in July 2011. A newer USN station nearby which started tracking LRO in April 2012 has shown consistent ∼ 0.3 mm/s noise levels. On the other hand, the Kiruna (Sweden) USN station (126) showed a large increase in noise to 1–4 mm/s between February and August 2013, after having shown improvements from 0.55 mm/s to 0.35 mm/s in March 2010 and to 0.25 mm/s in November 2011. It was only rarely used after 2013. The Kiruna back-up station (127) showed similar improvements in 2010 and 2011, and has continued to perform in the 0.2–0.3 mm/s range since. The Weilheim (Germany) USN station (129) performs the best within the USN network, typically at 0.17 mm/s except between January and September 2010 which saw a noise increase to >1 mm/s. Of course, we find dramatically fewer USN station tracking passes after September 2014, when LRO stopped using the USN network to provide near-continuous tracking. The back-up station at Weilheim (128, not shown) was used more rarely, but showed similar good performance starting October 2011.
Differences between the White Sands and USN stations also exist when it comes to measurement and timing biases. Figure 9 shows the estimated Range measurement biases, Doppler measurement biases, and station timing biases over the whole mission. Each station is displayed with a unique color. The Range biases are generally commensurate (480–510 meters, Fig. 9a), because the main contributor is the spacecraft transponder delay (∼490 meters). Some stations show large discontinuities, presumably due to operations (e.g., USN station 129). With the Doppler data as the main contributor, the estimation of Range measurement biases is not really detrimental. On the other hand, the presence of large Doppler measurement biases for all USN stations (∼10 mm/s, Fig. 9b) may weaken those data compared to the White Sands data, whose estimated Doppler biases are small (<0.5 mm/s).
Figure 9:

Time series of the Range measurement biases (top), Doppler measurement biases (middle), and Range timing biases (bottom), estimated per station and per arc.
As detailed in Mazarico et al. (2012), the unexpected presence of station timing biases in the Range data alone would yield strong trends in the Range residuals if not accounted for. The adjustments are generally stable, but show enough scatter to warrant per-arc estimation ( Fig. 9c). The White Sands station saw a large discontinuity in August 2013, lowering the timing bias level from 6–7 ms down to ∼3 ms. The USN stations all share a ∼−2 ms bias (∼−3 ms after December 2010), with a large arc-by-arc scatter. Again, although weakening the Range data, these timing biases adjustments are not critical for LRO OD quality because the Doppler data appear dominant in the iterative reconstruction process.
5.3. Orbit Quality
Because the spacecraft orbit cannot be independently verified, in the way that, for instance, imaging a surface feature can yield direct morphologic measurements, the assessment of the orbit reconstruction quality can be challenging. We use several ways to study the orbit accuracy, which brings further confidence to our estimated position knowledge.
Orbit overlaps.
Whenever possible (no maneuver), adjacent arcs overlap by design over White Sands tracking passes, which provides a consistent metric over the whole mission for orbit quality assessment. The orbit differences and statistics are computed over each overlapping period, in each of the along-track, cross-track, and radial directions (ACR). The overlap in total position is also computed, primarily tracking the horizontal position accuracy given the radial overlaps are typically an order of magnitude smaller than the along-track and cross-track components. The results are shown in Figure 10. We note little to no degradation after the loss (phases 65–93) of near-continuous coverage that was possible with support from USN stations.
Figure 10:

Performance of the high-quality LRO OD, assessed from orbit overlap RMS in each direction (in meters). The RMS over each LRO phase of the per-arc overlap RMS is plotted. Typical performance is 50 cm radially and <10 m in total position.
The quality of the reconstructed trajectory varies with the viewing angle from the Earth (α, see Section 2.1), as expected when considering the line-of-sight components of the spacecraft velocity. As shown in Figure 11, the sensitivity of the orbit quality is different for various directions. In the along-track and radial directions, the overlaps are typically better when the orbit is viewed edge-on, while the cross-track overlaps are typically smaller in a face-on geometry. Though small compared to other effects described below, the differences between face-on (α = 90°) and edge-on (α = 0°) can be significant in relative terms. Along-track overlaps degrade from a typical value of ∼2 m at α = 0° to ∼7 m at α > 45°. In the radial direction, a similar trend exists from ∼25 cm to >50 cm at α > 60°. In the cross-track direction, the overlaps improve from ∼5 m at α < 45° to ∼2 m at α > 60°. These combined trends nearly cancel each other when considering the total positional knowledge, with a general level of 7–8 m over most of the range, but 5–6 m at low α values.
Figure 11:

The RMS values of the orbit differences during orbit overlap periods, in each direction and in total position, are plotted against the orbit viewing geometry from Earth (α). α=0° and α=90° correspond to edge-on and face-on, respectively. The average and standard deviation in 5-deg bins are also shown.
Orbit Differences.
Another independent validation involved studying the orbit differences with the daily reconstructions provided by the navigation team at NASA GSFC Flight Dynamics Facility (FDF). These could show large differences, although generally on a par with FDF’s own assessment of orbit quality, meaning our orbit errors did not contribute much to the general discrepancy levels observed in the differences. The FDF solutions are discontinuous by design at midnight, or sometimes noon. The fact that we observe many of the orbit difference discontinuities at these times is consistent with errors largely originating from the FDF time series. Recent changes of OD strategy by FDF, in particular with the use of the GRAIL gravity field to high degree (Lmax=270), improved the quality of the daily orbit reconstructions and reduced the typical magnitude of the differences with our orbits.
LOLA Altimetric Ranges.
Although a tracking data type in its own right (Section 4.4), the LOLA altimetric measurements can constitute an independent dataset to evaluate the quality of the radio-only orbit reconstructions. We first evaluated the RMS of the residuals between the elevations of the SLDEM2015 shape model and the elevations of the LOLA altimetric points geolocated from our reconstructed LRO orbits. We find typical values of 3–5 meters, in good agreement with Barker et al. (2016), the inherent noise floor of the Kaguya Terrain Camera stereo DEM (Haruyama et al., 2012). Our estimate of radial accuracy (<1 m) is thus consistent with these direct height comparison results.
These early comparisons were focused on aggregate RMS values, but more detailed information can be obtained by comparing short track segments to a shape model, and adjust the position of these track segments until a best fit is obtained. This is particularly interesting in the immediate polar regions, as the resolution of the LOLA-only DEM is very high, of the same order of magnitude as our stated orbit accuracy. We performed such adjustment analysis in the past, primarily to improve the intrinsic quality of DEMs (e.g., Zuber et al., 2012).
Here, we extend this to the whole lunar surface. We divide each ∼2-hour LOLA profile into short segments, defined by their groundtrack falling within 2◦×5° tiles distributed globally. This produces about 886,000 segments ∼90 seconds long, each with typically 500 to 10,000 points (night vs day). Each segment is adjusted to match the SLDEM2015 topographic map, through iterative estimation of a spacecraft position error, assumed constant in each of the ACR directions over the short interval. Note we do not estimate a displacement of the geolocated points themselves, but of the spacecraft, such that our corrections actually reflect trajectory corrections, rather than a combination of these and changes in spacecraft orientation. After filtering segments with too few data points (<100), we obtain ACR offset statistics commensurate with the overlap-based estimates. For the horizontal directions, we first need to remove a periodic term first observed when processing the crossover measurements to detect the lunar tidal deformation signal (Mazarico et al., 2014b), due to time-variable laser altimeter pointing errors, potentially caused by the LOLA thermal blanket anomaly.
LROC NAC Observations.
A completely independent measure of orbit quality can be obtained from the high-resolution, narrow-angle cameras onboard LRO. With a resolution of 50 cm/pixel from the nominal 50-km orbit, the LROC NACs repeatedly imaged key sites during the nominal mission (the so-called Constellation sites). LROC has continued to image certain sites at nearly every opportunity, particularly the ‘anthropogenic features’ (Wagner et al., 2017), which has helped refine the calibration parameters (Speyerer et al., 2016). In addition, their locations in the Moon-fixed frame could be determined from these repeat looks since errors due to pointing and orbit were reduced statistically (Wagner et al., 2017). With improved camera calibration, verified pointing precision, and accurate coordinates, these anthropogenic features thus become excellent landmarks to assess the quality of the orbit reconstruction. By comparing the pixel position in which a given artifact appears in an image to its expected position, geodetic accuracy can be assessed. Each observation yields an offset in the line and sample coordinates, which given LRO’s near-polar orbit roughly correspond to the longitude and latitude directions.
The reconstructed LRO orbit presented above was used to perform such an analysis, with 60 unique landmarks observed in 747 unique NAC images, for a total of 1,573 observations of offset residuals. Figure 12 shows the histograms of the errors in the two directions, expressed in meters at the surface. Excluding a few outliers, the RMS values in each direction are similar, at a level of 9–10 m. Given that other error sources contribute to these residuals as well (pointing, coordinate frame, etc.), this independent assessment with the NAC images can be considered in excellent agreement with the overlap analysis.
Figure 12:

Histogram of the residuals in surface position between observed and expected position of 60 anthropogenic features observed by LROC NAC. The line and sample camera coordinate observations were converted to meters at the surface, and are expected to be primarily the result of orbit reconstruction errors.
5.4. Effect of gravity field
From Lunar Prospector to GRAIL.
Before the GRAIL mission (Zuber et al., 2013a,b), our knowledge of the lunar gravity field compared poorly to that of Mars, primarily because of the lack of spacecraft tracking data over the farside due to the Moon’s tidal lock. Although the Japanese Selenological and Engineering Explorer (SELENE) mission included a small relay satellite in an elliptical orbit to enable 4-way indirect tracking of the low-altitude primary spacecraft (Kaguya), it did not yield comparable resolution over the farside as over the nearside (Namiki et al., 2009; Goossens et al., 2011a).
During the first few years of the LRO mission, no GRAIL-derived lunar gravity field was available. LRO-specific gravity field solutions were obtained by combining the historical data (from the 1960’s Lunar Orbiters, 1970’s Apollo sub-satellites, 1990’s Clementine and especially Lunar Prospector) with the LRO tracking data themselves. As shown by Mazarico et al. (2012), this allowed radio-only OD to perform on a par with radio and altimetry OD, using such LRO-specific solutions. Because of the secular trend in inclination of LRO’s orbit and the inherent weakness in the LRO tracking geometry, this good gravity performance could only last approximately a year before significant degradation was obvious. As such, we developed the LLGM-2 gravity field, which contains one additional year of data compared to LLGM-1 introduced by Mazarico et al. (2012). Then, the availability of GRAIL gravity solutions of much higher accuracy and thus OD performance even for the LRO orbit, obviated the need for latter LRO-specific solutions.
To show the transformative impact of GRAIL on lunar orbiter OD, we reprocessed the whole LRO mission period with several pre-GRAIL fields: LLGM-2, LP150Q (Konopliv et al., 2001), and SGM150J (Goossens et al., 2011a). Figure 13 shows the resulting orbit accuracy, evaluated through overlap analysis. The good performance of LLGM-2 for the specific application of LRO is evident, as it achieves orbit quality of 10–20 meters for the first two years despite a coarse resolution with Lmax=150 (by current, post-GRAIL standards). We note that the increasing trend due to the lack of low-inclination LRO tracking data included in LLGM-2 slowly erases the initial performance benefit compared to the other two pre-GRAIL fields. The overlap statistics for LP150Q and SGM150J are near-identical over the whole LRO mission span. All these show a secular degradation in performance, again likely due to the fact that LRO drifted out of the orbit inclination range (Section 2.1) of their primary near-polar contributors, Lunar Prospector (i=90.5°) and SELENE (i=90.0°).
Figure 13:

Orbit overlap over each LRO phase computed from orbit reconstructions performed with the various gravity fields. The pre-GRAIL models (LP150Q, SGM150J, and LLGM-2) are used to their maximum expansion degree of 150, while the GRAIL gravity field is used at both L=150 and L=600. Note the logarithmic scale.
The GRAIL gravity field evaluated to Lmax=600 does not show any of this secular degradation, and performs significantly better over the whole mission span, even at inclinations not directly experienced by the twin GRAIL space-craft Ebb and Flow (i=88.6–89.8°), highlighting its accuracy and the benefits it does and will bring to lunar orbiter OD in any configuration. However, when repeating the analysis, with a significantly-truncated GRAIL field, at the same Lmax=150 as the pre-GRAIL fields we evaluated, we find that its performance is not markedly different. This might indicate the need for larger gravity field expansions to achieve sub-10-m orbit accuracy levels with LRO, both in its nominal ∼50 km orbit and its current elliptical frozen orbit.
Effect of gravity field resolution.
In this section, we investigate the effect of the maximum expansion degree of the GRAIL gravity field utilized during OD. As shown just above, it can have a significant impact on orbit quality. Of course, larger expansions are expected to perform better, especially for truncation degrees below the degree strength of the GRAIL fields (typically >750, Lemoine et al., 2014).
We ran reconstructions of the LRO trajectory over the entire mission period, with various truncation degrees from 100 to 600. We noted that orbit differences between L>300 reconstructions were becoming small, even more so for L>500, so we did not investigate L>600 reconstructions despite the considered gravity field extending to L=900. Figure 14 shows the overlap analysis results in all directions. It demonstrates that when performing LRO OD the GRAIL gravity field should be used to L≥250 to obtain optimal reconstruction quality. Using expansions larger than L=300 is typically not advantageous for the LRO mission, although we note that over the last 2 years of the studied period, the performance of L=600 reconstructions is clearly superior to that with L=300. It could also be beneficial to other missions with more accurate tracking data.
Figure 14:

Orbit overlap over each LRO phase computed from orbit reconstructions performed with the GRAIL gravity field truncated at various degrees between 100 and 600. Accounting for gravitational perturbations from degrees lower than 300 is necessary to obtain high-quality orbits. Note the logarithmic scale.
With improved modeling of the spatial variations of the Moon’s gravitational accelerations on LRO, we expect smaller magnitude and variability of the empirical parameters used in OD to improve the tracking data fit. We calculated the statistics of the estimated empirical constant along-track accelerations (Aemp) and solar radiation scale factor (CR). Discounting the few outliers that skew the computed standard deviations, we find that the spread in CR is reduced from 1.78 for Lmax=100 to 0.26 for Lmax=150 to 0.15 for Lmax=300–600. Similarly, the typical value of the zero-meaned Aemp is reduced from 1.28×10⁻⁸ m/s2 for Lmax=100 to 5.9×10⁻⁹ m/s2 for Lmax=150 and to <1.5×10⁻⁹ m/s2 for Lmax ≥300. The leveling of Aemp beyond degree 300 may indicate that gravitational modeling errors are then negligible and other mismodeling error sources become dominant.
Effect of integration time step.
Here, we address whether the use of the high-resolution of the lunar gravity fields obtained by the GRAIL mission requires integration of the spacecraft trajectory during OD with small time steps. Indeed, an expansion to Lmax=600 has a surface block resolution of 9 kilometers, which LRO travels in ∼5.5 seconds, without considering the oversampling that might be desired to account for the effects of the smallest resolved features.
Our nominal processing is performed with a time step of 1.25 to 2.5 seconds. We reprocessed the complete LRO tracking dataset with time steps of 5, 10 and 15 seconds. Surprisingly, we find little to no difference over the majority of the mission, in both the orbit differences (evaluated every 60 seconds) and thus also the orbit overlap performance, between these fully-iterated integrations. For a few phases, the performance is slightly degraded starting for ∆t>10 s. For ∆t=15 s, we find the performance has degraded since Summer 2015, although there is no indication of degradation for ∆t≤10 s.
Thus, although not expected, it appears that good accuracy and computational performance can be obtained by performing the orbit integration with rather large time steps (∆t=5–10 s), even when using the GRAIL gravity field to high expansion (Lmax=600). We note that this may have changed and needs to be assessed with other orbiters, particularly if the tracking measurement accuracy is significantly better. The relatively low quality of the LRO S-band data may reduce the sensitivity to slight integration effects with different time
5.5. Effect of radio tracking coverage
Loss of USN.
In 2014, as the LRO project considered cost-saving measures in preparation for the ESM2 mission, we performed a study to evaluate the potential impact of losing tracking support by the USN stations. This showed that the USN tracking data contributed very little to the overall orbit quality and orbit consistency during overlap periods (evaluated during White Sands passes).
We updated this study here over the whole LRO mission, and reached identical conclusions. The overlap statistics, especially when evaluated over mission phases, show very small changes only. In nearly half the cases, ignoring the USN data can actually be beneficial to this metric of orbit overlaps, perhaps because the measurement and timing biases affecting the USN data can make it inconsistent with the higher-quality White Sands data.
Loss of White Sands.
As a counterpoint, we studied the dependence of LRO OD quality to the coverage provided by the White Sands station. We reprocessed the USN-only data over the whole mission timespan, using the same arc spans. The statistics of the overlaps degrade, but not substantially, undoubtedly in large part thanks to the availability of highly accurate gravity field information from GRAIL. In the radial direction, the per-phase overlap RMS increases from ∼0.5 m to 1–2 m. The cross-track performance is not degraded for all mission phases, and in that case only by 2–10 m typically. The along-track direction is most affected, though again many mission phases perform nearly as well as the arcs processed with the entire tracking data. Driving the total position error, these increases in along-track overlap RMS are of order 5–10 m, and up to 20 m. Overall, and given the fact that the overlap periods are now over periods not covered by any data at the edges of each arc, the performance of LRO OD with USN coverage alone is rather good. Of course, after September 2014, the USN coverage is too sparse in many cases to enable robust convergence of the OD process.
5.6. Effect of the Empirical Accelerations
Although unsatisfactory, a constant along-track empirical acceleration applied to the spacecraft continues to significantly improve OD quality, even when using GRAIL gravity. Like Mazarico et al. (2012), we only estimated one such parameter per arc, and the recovered values are typically small (1–2×10⁻⁹m/s2, see Section 5.2), so one could have expected the impact of not using them to be small. However, the re-analysis of the data with no such empirical acceleration led to much poorer results, both in terms of data fits and overlap performance. The Doppler residuals per-arc RMS increases from 0.38±0.19 mm/s to 0.93±0.70 mm/s. The per-phase orbit overlaps increase to 3.3 m radially and ∼45 m in total position.
5.7. Effect of Solar Radiation
As noted above, the per-arc solar radiation scale factors (CR) adjust close to the expected value of unity, 1.03±0.24. Unlike the empirical accelerations, the data fits and OD quality are affected only in a minor way, with Doppler RMS values increasing to 0.40±0.19 mm/s. The RMS of the empirical acceleration magnitudes only increase from ∼1.9 to ∼2.0 ×10⁻⁹m/s2.
On the other hand, the solar radiation factors estimated over each arc do show a clear trend when plotted against the β angle (Figure 15), indicating residual mismodeling of the spacecraft. Current work is focused on better understanding this observation, which may be related to self-shadowing effects on the spacecraft cross-section relevant to the albedo and thermal radiation pressure computations and/or the albedo and thermal models used for the lunar surface. However, this does not affect the orbit quality (the orbit overlaps do not show any trend with β), suggesting that the adjustment of empirical accelerations is sufficient to absorb this mismodeling.
Figure 15:

Solar radiation factor, estimated over each arc, plotted against the β angle.
6. Laser altimetry as a tracking measurement
6.1. OD with direct altimetry
After improvements to the implementation of the ‘direct altimetry’ measurement type described in Section 4.4, we demonstrated its use with the high-resolution topographic model SLDEM2015. Focusing on 53 arcs covering approximately four months in early 2010, we processed LRO radio tracking data and LOLA altimetric data in combination to reconstruct the LRO trajectory. To better evaluate the effect of the added altimetry, we considered several subsets of LOLA data spanning different latitudinal ranges around both poles: 80°−90°, 70°−90°, 50°−90°, 30°−90°, and finally the whole globe.
For computational reasons, and also to prevent the altimetry data from completely overwhelming the Doppler and Range measurements in terms of number of observations, we downsampled the LOLA data to one channel (spot #3, least affected by the day-night variations in return rate due to the thermal blanket anomaly) and to 2 Hz. We also varied the resolution of the (cylindrical projection) topographic basemap with latitude, in an effort to maintain a more uniform spatial resolution, around 60 meters/pixel. As such, we used 64 ppd between 80° and 85° latitude, 128 ppd between 70° and 80°, 256 ppd between 50° and 70°, and 512 ppd equatorward of 50° latitude. Poleward of 85°, we used polar stereographic maps based on LOLA data alone, at 20 meters/pixel resolution.
We first compared the orbits obtained from radio-only OD with those that included altimetry, and we find that as more altimetry is included and its coverage improves, the RMS of the differences increase only slightly (Table 1), by about 5±3 meters in total position. The radial differences are very small, only 20 cm RMS, and the changes in both along-track and cross-track directions are comparable.
Table 1:
Assessment of orbit differences and orbit overlap metrics for 4 months in 2010, when using radio data alone or in combination with varying amounts of direct altimetry coverage. The values shown indicate the RMS and standard deviation, in meters.
| Orbit differences of radio+altimetry vs. radio-only orbits (m) | ||||
|---|---|---|---|---|
| Altimetry coverage | Along-Track | Cross-Track | Radial | Total Position |
| 80°−90° | 3.64 ± 2.38 | 3.62 ± 2.56 | 0.18 ± 0.06 | 5.13 ± 3.19 |
| 70°−90° | 3.76 ± 2.28 | 3.73 ± 2.66 | 0.20 ± 0.07 | 5.29 ± 3.10 |
| 50°−90° | 3.54 ± 2.01 | 3.60 ± 2.56 | 0.22 ± 0.09 | 5.05 ± 2.83 |
| 30°−90° | 3.64 ± 2.08 | 3.50 ± 2.51 | 0.27 ± 0.11 | 5.05 ± 2.79 |
| 00°−90° | 3.99 ± 1.94 | 3.43 ± 2.44 | 0.42 ± 0.15 | 5.28 ± 2.55 |
|
Overlaps of radio-only and radio+altimetry orbits (m) | ||||
| Altimetry coverage | Along-Track | Cross-Track | Radial | Total Position |
| Radio only | 5.40 ± 1.85 | 3.71 ± 0.34 | 0.23 ± 0.04 | 6.50 ± 1.59 |
| 80°−90° | 5.44 ± 1.11 | 4.15 ± 1.13 | 0.26 ± 0.06 | 6.88 ± 1.53 |
| 70°−90° | 5.29 ± 1.11 | 4.05 ± 1.03 | 0.27 ± 0.06 | 6.70 ± 1.47 |
| 50°−90° | 4.58 ± 0.98 | 3.49 ± 0.83 | 0.26 ± 0.04 | 5.78 ± 1.25 |
| 30°−90° | 3.81 ± 0.94 | 3.02 ± 0.70 | 0.25 ± 0.03 | 4.89 ± 1.12 |
| 0°−90° | 3.38 ± 0.73 | 2.83 ± 0.47 | 0.27 ± 0.01 | 4.45 ± 0.77 |
|
Overlaps of altimetry-only orbits (m) | ||||
| Altimetry coverage | Along-Track | Cross-Track | Radial | Total Position |
| 80°−90° | 2.43 ± 0.59 | 21.85 ± 5.21 | 0.88 ± 0.25 | 24.00 ± 5.76 |
| 70°−90° | 1.78 ± 0.48 | 8.24 ± 2.62 | 0.60 ± 0.15 | 9.02 ± 2.83 |
| 50°−90° | 1.40 ± 0.40 | 6.13 ± 4.17 | 0.38 ± 0.10 | 6.69 ± 4.36 |
| 30°−90° | 1.28 ± 0.31 | 5.98 ± 3.98 | 0.35 ± 0.08 | 6.52 ± 4.14 |
| 0°−90° | 1.58 ± 0.20 | 5.65 ± 3.38 | 0.33 ± 0.06 | 6.21 ± 3.41 |
Considering the overlap metrics shown in Table 1, we see that the orbit accuracy steadily improves with increasing altimetry coverage in addition to the radio tracking data. In the subset we studied, the improvement is typically ∼ 30% in total position, primarily through improvement of the along-track performance. The cross-track also improves; the radial direction, of much smaller magnitude, is very slightly degraded. In future work, we will proceed with our effort to include the altimetry data in the orbit reconstruction of LRO over the whole mission duration, and we will be able to confirm the trends observed in this first study.
Beyond the improvement of the overlaps and the reconstructed orbit accuracy, direct altimetry may also prove important to detect subtle long-term, long-wavelength spacecraft orbit perturbations, thanks to the use of topographic basemaps as common reference for arcs even widely separated in time.
6.2. Altimetry-only OD
To evaluate the strength of altimetry data themselves for OD, which may be useful is certain applications, we next consider altimetry-only OD. We reconstructed the trajectory of LRO over most of its mission using only direct altimetry data. We only considered the ranging data falling within the two topographic basemaps of the immediate polar regions (85°−90°), with a resolution of 20 meters/pixel). The resulting orbits are in good agreement with the radio-only solutions presented above. The majority of the arcs show statistical measures of the orbit overlap metric on a par with these results. However, although the peak of the distribution of the total position accuracy is below 10 meters, we find that the distribution has a long tail (Figure 16), raising the overall overlap RMS to 20–25 meters in total position, and ∼ 2 meters radially. More of these higher values and outliers occur after 2012, when LRO was in its eccentric orbit and LOLA could only obtain reliable altimetric measurements over the southern hemisphere. Table 2 shows the overlap statistics for the radio-only and altimetry-only cases over the LRO circular phase (September 2009 to December 2011). The fact that the orbits are only determined from data over 10 degrees of arc (85°S-90°S-85°S) is the likely reason for occasional poorer performance. Indeed, with the same 4 months in 2010 as in Section 6.1, the altimetry-only overlaps are significantly reduced with better altimetry coverage (bottom section of Table 1), primarily because of a better consistency between consecutive arcs in the cross-track direction.
Figure 16:

Histogram of orbit overlap in the along-track, cross-track, radial directions, and total position for the LRO circular orbit phase in the case of altimetry-only OD.
Table 2:
Comparison of the overlap performance in the LRO circular orbit between the radio-only and altimetry-only cases. The values shown indicate the RMS and standard deviation, in meters.
| Data Used | Along-Track overlap (m) | Cross-Track overlap (m) | Radial overlap (m) | Total Position overlap (m) |
|---|---|---|---|---|
| Radio only | 7.48 ± 5.73 | 6.21 ± 4.32 | 0.53 ± 0.36 | 9.90 ± 6.82 |
| Altimetry only | 10.19 ± 8.09 | 13.07 ± 9.14 | 2.55 ± 1.98 | 17.74 ± 11.93 |
We also examined the dependence on the orbit observability from Earth (the α angle; Section 5.3), and find no trend with α in any of the orbit frame directions. This agrees with what we expected, given we do not include any ground-based data, and expect the GRAIL gravity field to be of excellent quality and accuracy globally, unlike previous generations of lunar gravity fields which had a nearside-farside asymmetry in their performance.
7. Summary
We presented the results of the orbit determination work carried out in support of the Lunar Reconnaissance Orbiter mission, with the primary goal to obtain high-precision trajectory reconstruction for the production of high-level data products by the various LRO instrument teams. These trajectories, of higher quality than the daily reconstructions by the Navigation team, are archived on the LOLA PDS Data node (imbrium.mit.edu) and on the Planetary Geodynamics Data Archive (PGDA, https://pgda.gsfc.nasa.gov/). We showed how recent force modeling improvements of the perturbations affecting the LRO spacecraft now yield typical orbit reconstruction accuracy below 10 meters in total positional knowledge, and better than 1 meter radially. We also showed how the LOLA altimetric data can be not only used for orbit accuracy assessment, but also as a tracking data type to support orbit reconstruction. Using these data as ‘direct altimetry’ measurements rather than the more complex and sparser ‘crossover’ measurements used in past studies affords both flexibility and accuracy.
The fact that altimetry data alone provide sufficient geodetic constraints to support orbit reconstruction of excellent quality suggests that the geodetic needs of future lunar orbiters could be supported entirely with relatively simple laser altimeters or range finders. Thanks to our knowledge of lunar topography from instruments such as LRO-LOLA and Kaguya-TC, low-frequency (1 Hz) ranging to the lunar surface can achieve accurate orbit reconstruction. Autonomous navigation and onboard OD could be implemented, provided large-size topographic maps could be stored onboard the spacecraft.
Future work will focus on utilizing the entire LOLA dataset for orbit reconstruction, rather than just a short period in 2010 as presented here. Further improvements to the force modeling are possible, through the addition of spacecraft thermal reradiation in our modeling, and more careful computations of the radiation pressure perturbations in particular, with more detailed space-craft shape models and by accounting for self-shadowing effects for the planetary albedo and thermal radiation terms.
Acknowledgements
We thank NASA and the LRO project for supporting this work, as the funding of the LOLA Science Team was essential to carry out this work. We thank Robert Wagner (ASU) for providing the image landmark residuals of anthropogenic features.
Footnotes
References
- Barker M, Mazarico E, Neumann G, Zuber M, Haruyama J, Smith D, 2016. A new lunar digital elevation model from the Lunar Orbiter Laser Altimeter and {SELENE} Terrain Camera. Icarus 273, 346–355. doi: 10.1016/j.icarus.2015.07.039. [DOI] [Google Scholar]
- Bauer S, Hussmann H, Oberst J, Dirkx D, Mao D, Neumann G, Mazarico E, Torrence M, McGarry J, Smith D, Zuber M, 2017. Analysis of one-way laser ranging data to LRO, time transfer and clock characterization. Icarus 283, 38–54. doi: 10.1016/j.icarus.2016.09.026. lunar Reconnaissance Orbiter - Part {II}. [DOI] [Google Scholar]
- Boehm J, Niell A, Tregoning P, Schuh H, 2006. Global mapping function (gmf): A new empirical mapping function based on numerical weather model data. Geophysical Research Letters 33. doi: 10.1029/2005GL025546.l07304. [DOI] [Google Scholar]
- Buccino DR, Seubert JA, Asmar SW, Park RS, 2016. Optical Ranging Measurement with a Lunar Orbiter: Limitations and Potential. Journal of Spacecraft and Rockets 53, 457–463. doi: 10.2514/1.A33415. [DOI] [Google Scholar]
- Chin G, Brylow S, Foote M, Garvin J, Kasper J, Keller J, Litvak M, Mitrofanov I, Paige D, Raney K, Robinson M, Sanin A, Smith D, Spence H, Spudis P, Stern SA, Zuber M, 2007. Lunar Reconnaissance Orbiter Overview: TheInstrument Suite and Mission. Space Science Reviews 129, 391–419. doi: 10.1007/s11214-007-9153-y. [DOI] [Google Scholar]
- Folkner WM, Williams JG, Boggs DH, 2008. The planetary and lunar ephemeris DE 421. IPN Progress Report, 42–178.
- Genova A, Goossens S, Lemoine FG, Mazarico E, Neumann GA, Smith DE, Zuber MT, 2016. Seasonal and static gravity field of Mars from MGS, Mars Odyssey and {MRO} radio science. Icarus 272, 228–245. doi: 10.1016/j.icarus.2016.02.050. [DOI] [Google Scholar]
- Gläser P, Haase I, Oberst J, Neumann GA, 2013. Co-registration of laser altimeter tracks with digital terrain models and applications in planetary science. Planetary and Space Science 89, 111–117. doi: 10.1016/j.pss.2013.09.012. [DOI] [Google Scholar]
- Gläser P, Scholten F, De Rosa D, Marco Figuera R., Oberst J, Mazarico E, Neumann GA, Robinson MS, 2014. Illumination conditions at the lunar south pole using high resolution Digital Terrain Models from LOLA. Icarus 243, 78–90. doi: 10.1016/j.icarus.2014.08.013. [DOI] [Google Scholar]
- Goossens S, Matsumoto K, 2008. Lunar degree 2 potential Love number determination from satellite tracking data. Geophysical Research Letters 35, 10.1029/2007GL031960. l02204. [DOI] [Google Scholar]
- Goossens S, Matsumoto K, Liu Q, Kikuchi F, Sato K, Hanada H, Ishihara Y, Noda H, Kawano N, Namiki N, Iwata T, Lemoine FG, Rowlands DD, Harada Y, Chen M, 2011a. Lunar gravity field determination using SELENE same-beam differential VLBI tracking data. Journal of Geodesy 85, 205–228. doi: 10.1007/s00190-010-0430-2. [DOI] [Google Scholar]
- Goossens S, Matsumoto K, Rowlands DD, Lemoine FG, Noda H, Araki H, 2011b. Orbit determination of the SELENE satellites using multi-satellite data types and evaluation of SELENE gravity field models. Journal of Geodesy 85, 487–504. doi: 10.1007/s00190-011-0446-2. [DOI] [Google Scholar]
- Goossens S, Sabaka TJ, Nicholas JB, Lemoine FG, Rowlands DD, Mazarico E, Neumann GA, Smith DE, Zuber MT, 2014. High-resolution local gravity model of the south pole of the Moon from GRAIL extended mission data. Geophysical Research Letters 41, 3367–3374. doi: 10.1002/2014GL060178. [DOI] [PMC free article] [PubMed] [Google Scholar]
- Gruener J, Jolliff BL, Lawrence S, Robinson MS, Plescia JB, Wiseman SM, Li R, Archinal BA, Howington-Kraus AE, 2009. LRO Camera Imaging of Constellation Sites. AGU Fall Meeting Abstracts
- Haruyama J, Hara S, Hioki K, Iwasaki A, Morota T, Ohtake M, Matsunaga T, Araki H, Matsumoto K, Ishihara Y, Noda H, Sasaki S, Goossens S, Iwata T, 2012. Lunar Global Digital Terrain Model Dataset Produced from SELENE (Kaguya) Terrain Camera Stereo Observations, in: Lunar and Planetary Science Conference, p. 1200. [Google Scholar]
- Kegege O, Fuentes M, N., M., Sil A, 2012. Three-Dimensional Analysis of Deep Space Network Antenna Coverage, in: 2012 IEEE Aerospace Conference, p. 9. doi: 10.1109/AERO.2012.6187124. [DOI] [Google Scholar]
- Konopliv A, Asmar S, Carranza E, Sjogren W, Yuan D, 2001. Recent Gravity Models as a Result of the Lunar Prospector Mission. Icarus 150, 1–18. doi: 10.1006/icar.2000.6573. [DOI] [Google Scholar]
- Lemoine FG, Goossens S, Sabaka TJ, Nicholas JB, Mazarico E, Rowlands DD, Loomis BD, Chinn DS, Caprette DS, Neumann GA, et al. , 2013. High–degree gravity models from GRAIL primary mission data. Journal of Geophysical Research: Planets 118, 1676–1698. [Google Scholar]
- Lemoine FG, Goossens S, Sabaka TJ, Nicholas JB, Mazarico E, Rowlands DD, Loomis BD, Chinn DS, Neumann GA, Smith DE, Zuber MT, 2014. GRGM900C: A degree 900 lunar gravity model from GRAIL primary and extended mission data. Geophysical Research Letters 41, 3382–3389. doi: 10.1002/2014GL060027. [DOI] [PMC free article] [PubMed] [Google Scholar]
- Lemoine FG, Smith DE, Rowlands DD, Zuber MT, Neumann GA, Chinn DS, Pavlis DE, 2001. An improved solution of the gravity field of Mars (GMM-2B) from Mars Global Surveyor. Journal of Geophysical Research: Planets 106, 23359–23376. doi: 10.1029/2000JE001426. [DOI] [Google Scholar]
- Lemoine FGR, Smith DE, Zuber MT, Neumann GA, Rowlands DD, 1997. A 70th degree lunar gravity model (GLGM-2) from Clementine and other tracking data. Journal of Geophysical Research: Planets 102, 16339–16359. doi: 10.1029/97JE01418. [DOI] [Google Scholar]
- Luthcke SB, Rowlands DD, McCarthy JJ, Pavlis DE, Stoneking E, 2000. Spaceborne Laser-Altimeter-Pointing Bias Calibration from Range Residual Analysis. Journal of Spacecraft and Rockets 37, 374–384. doi: 10.2514/2.3571. [DOI] [Google Scholar]
- Maier A, Baur O, 2016. Orbit determination and gravity field recovery from Doppler tracking data to the Lunar Reconnaissance Orbiter. Planetary and Space Science 122, 94–100. doi: 10.1016/j.pss.2016.01.014. [DOI] [Google Scholar]
- Mao D, McGarry JF, Mazarico E, Neumann GA, Sun X, Torrence MH, Zagwodzki TW, Rowlands DD, Hoffman ED, Horvath JE, Golder JE, Barker MK, Smith DE, Zuber MT, 2017. The laser ranging experiment of the Lunar Reconnaissance Orbiter: Five years of operations and data analysis. Icarus 283, 55–69. doi: 10.1016/j.icarus.2016.07.003. [DOI] [Google Scholar]
- Mao D, Rowlands DD, McGarry JF, Zuber MT, Smith DE, Torrence MH, Neumann GA, Mazarico E, Golder J, Sun X, Zagwodzki TW, Cavanaugh JF, 2011. Laser ranging experiment on Lunar Reconnaissance Orbiter: timing determination and orbit constraints, in: 17th International Workshop on Laser Ranging [Google Scholar]
- Mao D, Rowlands DD, McGarry JF, Zuber MT, Smith DE, Torrence MH, Neumann GA, Mazarico E, Golder J, Sun X, Zagwodzki TW, Cavanaugh JF, 2013. Improved Precision Orbit Determination of Lunar Orbiters from the GRAIL-Derived Lunar Gravity Models, in: 23rd AAS/AIAA Space Flight Mechanics Meeting, p. 274. [Google Scholar]
- Marshall JA, Luthcke SB, 1994. Modeling radiation forces acting on Topex/Poseidon for precision orbit determination. Journal of Spacecraft and Rockets 31, 99–105. doi: 10.2514/3.26408. [DOI] [Google Scholar]
- Mazarico E, Barker MK, Neumann GA, Zuber MT, Smith DE, 2014a. Detection of the lunar body tide by the lunar orbiter laser altimeter. Geophysical Research Letters 41, 2282–2288. doi: 10.1002/2013GL059085. [DOI] [PMC free article] [PubMed] [Google Scholar]
- Mazarico E, Genova A, Goossens S, Lemoine FG, Neumann GA, Zuber MT, Smith DE, Solomon SC, 2014b. The gravity field, orientation, and ephemeris of Mercury from MESSENGER observations after three years in orbit. Journal of Geophysical Research: Planets 119, 2417–2436. doi: 10.1002/2014JE004675. [DOI] [Google Scholar]
- Mazarico E, Genova A, Goossens S, Lemoine FG, Neumann GA, Zuber MT, Smith DE, Solomon SC, 2015. Orbit Determination of the Dawn Spacecraft with Radiometric and Image Data. Journal of Spacecraft and Rockets 52, 1331–1337. doi: 10.2514/1.A33224. [DOI] [Google Scholar]
- Mazarico E, Lemoine FG, Han SC, Smith DE, 2010a. GLGM-3: A degree-150 lunar gravity model from the historical tracking data of NASA Moon orbiters. Journal of Geophysical Research: Planets 115, 10.1029/2009JE003472. e05001. [DOI] [Google Scholar]
- Mazarico E, Neumann G, Smith D, Zuber M, Torrence M, 2011. Illumination conditions of the lunar polar regions using {LOLA} topography. Icarus 211, 1066–1081. doi: 10.1016/j.icarus.2010.10.030. [DOI] [Google Scholar]
- Mazarico E, Neumann GA, Rowlands DD, Smith DE, 2010b. Geodetic constraints from multi-beam laser altimeter crossovers. Journal of Geodesy 84, 343–354. doi: 10.1007/s00190-010-0379-1. [DOI] [Google Scholar]
- Mazarico E, Rowlands DD, Neumann GA, Smith DE, Torrence MH, Lemoine FG, Zuber MT, 2012. Orbit determination of the Lunar Reconnaissance Orbiter. Journal of Geodesy 86, 193–207. doi: 10.1007/s00190-011-0509-4. [DOI] [Google Scholar]
- Mazarico E, Zuber MT, Lemoine FG, Smith DE, 2007. Martian exo-spheric density using Mars Odyssey radio tracking data. Journal of Geophysical Research: Planets 112, 10.1029/2006JE002734. e05014. [DOI] [Google Scholar]
- Mazarico E, Zuber MT, Lemoine FG, Smith DE, 2008. Observation of atmospheric tides in the Martian exosphere using Mars Reconnaissance Orbiter radio tracking data. Geophysical Research Letters 35, 10.1029/2008GL033388. l09202. [DOI] [Google Scholar]
- McGarry J, Mao DD, Mazarico E, Neumann G, Sun X, Torrence MH, Barker MK, Hoffman E, Horvath J, Smith D, Zuber M, 2016. The contributions of ILRS laser ranging to the Lunar Reconnaissance Orbiter Mission, in: 20th International Workshop on Laser Ranging [Google Scholar]
- Mitrofanov IG, Bartels A, Bobrovnitsky YI, Boynton W, Chin G, Enos H, Evans L, Floyd S, Garvin J, Golovin DV, Grebennikov AS, Harshman K, Kazakov LL, Keller J, Konovalov AA, Kozyrev AS, Krylov AR, Litvak ML, Malakhov AV, McClanahan T, Milikh GM, Mokrousov MI, Ponomareva S, Sagdeev RZ, Sanin AB, Shevchenko VV, Shvetsov VN, Starr R, Timoshenko GN, Tomilina TM, Tretyakov VI, Trombka J, Troshin VS, Uvarov VN, Varennikov AB, Vostrukhin AA, 2010. Lunar Exploration Neutron Detector for the NASA Lunar Reconnaissance Orbiter. Space Science Reviews 150, 183–207. doi: 10.1007/s11214-009-9608-4. [DOI] [Google Scholar]
- Namiki N, Iwata T, Matsumoto K, Hanada H, Noda H, Goossens S, Ogawa M, Kawano N, Asari K, Tsuruta S.i., Ishihara Y, Liu Q, Kikuchi F, Ishikawa T, Sasaki S, Aoshima C, Kurosawa K, Sugita S, Takano T, 2009. Farside Gravity Field of the Moon from Four-Way Doppler Measurements of SELENE (Kaguya). Science 323, 900–905. doi: 10.1126/science.1168029. [DOI] [PubMed] [Google Scholar]
- Neumann GA, Rowlands DD, Lemoine FG, Smith DE, Zuber MT, 2001. Crossover analysis of Mars Orbiter Laser Altimeter data. Journal of Geophysical Research: Planets 106, 23753–23768. doi: 10.1029/2000JE001381. [DOI] [Google Scholar]
- Noll CE, 2010. The crustal dynamics data information system: A resource to support scientific analysis using space geodesy. Advances in Space Research 45, 1421–1440. doi: 10.1016/j.asr.2010.01.018. dORIS: Scientific Applications in Geodesy and Geodynamics. [DOI] [Google Scholar]
- Pavlis D, Wimert J, McCarthy J, 2012. GEODYN II System Description Vols. 1–5. Contractor Report SGT Inc. [Google Scholar]
- Robinson MS, Brylow SM, Tschimmel M, Humm D, Lawrence SJ, Thomas PC, Denevi BW, Bowman-Cisneros E, Zerr J, Ravine MA, Caplinger MA, Ghaemi FT, Schaffner JA, Malin MC, Mahanti P, Bartels A, Anderson J, Tran TN, Eliason EM, McEwen AS, Turtle E, Jolliff BL, Hiesinger H, 2010. Lunar Reconnaissance Orbiter Camera (LROC) Instrument Overview. Space Science Reviews 150, 81–124. doi: 10.1007/s11214-010-9634-2. [DOI] [Google Scholar]
- Rowlands DD, Lemoine FG, Chinn DS, Luthcke SB, 2008. A simulation study of multi-beam altimetry for lunar reconnaissance orbiter and other planetary missions. Journal of Geodesy 83, 709. doi: 10.1007/s00190-008-0285-y. [DOI] [Google Scholar]
- Rowlands DD, Pavlis DE, Lemoine FG, Neumann GA, Luthcke SB, 1999. The use of laser altimetry in the orbit and attitude determination of mars global surveyor. Geophysical Research Letters 26, 1191–1194. doi: 10.1029/1999GL900223. [DOI] [Google Scholar]
- Saastamoinen J, 1972. Atmospheric Correction for the Troposphere and Stratosphere in Radio Ranging Satellites. American Geophysical Union pp. 247–251. doi: 10.1029/GM015p0247. [DOI]
- Smith DE, Zuber MT, Neumann GA, Lemoine FG, Mazarico E, Torrence MH, McGarry JF, Rowlands DD, Head JW, Duxbury TH, Aharonson O, Lucey PG, Robinson MS, Barnouin OS, Cavanaugh JF, Sun X, Liva P, Mao D, Smith JC, Bartels AE, 2010a. Initial observations from the Lunar Orbiter Laser Altimeter (LOLA). Geophys. Res. Lett 37. doi: 10.1029/2010GL043751. [DOI] [Google Scholar]
- Smith DE, Zuber MT, Neumann GA, Mazarico E, Lemoine FG, Head JW, Lucey PG, Aharonson O, Robinson MS, Sun X, Torrence MH, Barker MK, Oberst J, Duxbury TC, Mao D, Barmouin OS, Jha K, Rowlands DD, Goossens S, Baker D, Bauer S, Glaeser P, Lemelin M, Rosenburg M, Sori MM, Whitten J, McClanahan TP, 2017. Summary of the Results from the Lunar Orbiter Laser Altimeter after Seven Years in Lunar Orbit. Icarus 283, 70–91. doi: 10.1016/j.icarus.2016.06.006. [DOI] [Google Scholar]
- Smith DE, Zuber MT, Phillips RJ, Solomon SC, Hauck SA, Lemoine FG, Mazarico E, Neumann GA, Peale SJ, Margot JL, Johnson CL, Torrence MH, Perry ME, Rowlands DD, Goossens S, Head JW, Taylor AH, 2012. Gravity Field and Internal Structure of Mercury from MESSENGER. Science doi: 10.1126/science.1218809. [DOI] [PubMed]
- Smith DE, Zuber MT, Phillips RJ, Solomon SC, Neumann GA, Lemoine FG, Peale SJ, Margot JL, Torrence MH, Talpe MJ III, J.W.H., II, S.A.H., Johnson CL, Perry ME, Barnouin OS Jr., R.L.M., Oberst J, 2010b. The equatorial shape and gravity field of Mercury from {MESSENGER} flybys 1 and 2. Icarus 209, 88–100. doi: 10.1016/j.icarus.2010.04.007. mercury after Two {MESSENGER} Flybys. [DOI] [Google Scholar]
- Speyerer EJ, Wagner RV, Robinson MS, Licht A, Thomas PC, Becker K, Anderson J, Brylow SM, Humm DC, Tschimmel M, 2016. Pre-flight and On-orbit Geometric Calibration of the Lunar Reconnaissance Orbiter Camera. Space Science Reviews 200, 357–392. doi: 10.1007/s11214-014-0073-3. [DOI] [Google Scholar]
- Tapley BD, Schutz BE, Born GH, 2004. Statistical Orbit Determination Elsevier, Boston, Mass. [Google Scholar]
- Wagner R, Nelson D, Plescia J, Robinson M, Speyerer E, Mazarico E, 2017. Coordinates of anthropogenic features on the Moon. Icarus 283, 92–103. doi: 10.1016/j.icarus.2016.05.011. lunar Reconnaissance Orbiter -Part {II}. [DOI] [Google Scholar]
- Williams JG, Boggs DH, Folkner WM, 2008. DE421 Lunar Orbit, Physical Librations, and Surface Coordinates. JPL Memorandum IOM 335-JW,DB,WF-20080314–001.
- Zuber MT, Head JW, Smith DE, Neumann GA, Mazarico E, Torrence MH, Aharonson O, Tye AR, Fassett CI, Rosenburg MA, Melosh HJ, 2012. Constraints on the volatile distribution within Shackleton crater at the lunar south pole. Nature 486, 378–381. doi: 10.1038/nature11216. lunar Reconnaissance Orbiter - Part {II}. [DOI] [PubMed] [Google Scholar]
- Zuber MT, Smith DE, Cheng AF, Garvin JB, Aharonson O, Cole TD, Dunn PJ, Guo Y, Lemoine FG, Neumann GA, Rowlands DD, Torrence MH, 2000. The Shape of 433 Eros from the NEAR-Shoemaker Laser Rangefinder. Science 289, 2097–2101. doi: 10.1126/science.289. 5487.2097. [DOI] [PubMed] [Google Scholar]
- Zuber MT, Smith DE, Lehman DH, Hoffman TL, Asmar SW, Watkins MM, 2013a. Gravity Recovery and Interior Laboratory (GRAIL): Mapping the Lunar Interior from Crust to Core. Space Science Reviews 178, 3–24. doi: 10.1007/s11214-012-9952-7. [DOI] [Google Scholar]
- Zuber MT, Smith DE, Watkins MM, Asmar SW, Konopliv AS, Lemoine FG, Melosh HJ, Neumann GA, Phillips RJ, Solomon SC, Wieczorek MA, Williams JG, Goossens SJ, Kruizinga G, Mazarico E, Park RS, Yuan DN, 2013b. Gravity Field of the Moon from the Gravity Recovery and Interior Laboratory (GRAIL) Mission. Science 339, 668–671. doi: 10.1126/science.1231507. [DOI] [PubMed] [Google Scholar]
- Zuber MT, Smith DE, Zellar RS, Neumann GA, Sun X, Katz RB, Kleyner I, Matuszeski A, McGarry JF, Ott MN, Ramos-Izquierdo LA, Rowlands DD, Torrence MH, Zagwodzki TW, 2010. The Lunar Reconnaissance Orbiter Laser Ranging Investigation. Space Science Reviews 150, 63–80. doi: 10.1007/s11214-009-9511-z. [DOI] [Google Scholar]