

Abstract
A prevalence of diabetes is increasing among the patients undergoing coronary artery bypass grafting (CABG). Data on whether health-related quality of life improves similarly after CABG in diabetics and nondiabetics are limited. We assessed long-term mortality and changes in quality of life (RAND-36 Health Survey) after CABG.
Seventy-four of the 508 patients (14.6%) operated on in a single institution had a history of diabetes and were compared with nondiabetics. The RAND-36 Health Survey was used as an indicator of quality of life. Assessments were made preoperatively and repeated 1 and 12 years later.
Thirty-day mortality was 2.7 versus 1.6 ( p = 0.511) in the diabetics and nondiabetics. One- and 10-year survival rates in the diabetics and nondiabetics were 94.6% versus 97.0% ( p = 0.287) and 63.5% versus 81.6% ( p < 0.001), respectively. After 1 year, diabetics improved significantly ( p < 0.005) in seven, and nondiabetics ( p < 0.001) in all eight RAND-36 dimensions. Despite an ongoing decline in quality of life over the 12-year follow-up, an improvement was maintained in four out of eight dimensions among diabetics and in seven dimensions among nondiabetics. Physical and mental component summary scores on the RAND-36 improved significantly ( p < 0.001) in both groups after 1 year, and at least slight improvement was maintained during the 12-year follow-up time.
Diabetics have inferior long-term survival after CABG as compared with nondiabetics. They gain similar improvement of quality of life in 1 year after surgery, but they have a stronger decline tendency over the years.
Keywords: quality of life, survival, CABG, diabetes mellitus, mortality, angina pectoris, complication
Diabetes is a well-established risk factor for atherosclerotic coronary heart disease, 1 and coronary heart disease has long been a leading cause of death among adult diabetics accounting for three times as many deaths among diabetics as among nondiabetics. 2 Coronary artery disease is not only more prevalent in diabetic patients compared with the rest of the population but tends to be more extensive, involving multiple vessels and being rapidly progressive. 3 Diabetes may also be a risk factor in association with myocardial revascularization procedures, 4 5 but coronary artery bypass grafting (CABG) has still been the treatment of choice in the diabetics with a three-vessel disease. 6 7
The profile of patients undergoing CABG has altered toward higher age with frequent preoperative comorbid conditions, especially diabetes, and increased postoperative morbidity. 8 9 10 Their gain in added years of life achieved by the CABG may be limited. Quality of life (QOL) thus becomes a pertinent issue as providers and consumers of health care debate on the benefits to be gained from expensive medical and surgical interventions. We have earlier reported a short-term data on QOL changes after CABG in diabetics. 11 However, there are limited long-term data available on whether health-related QOL improves and remains similarly after CABG in diabetic and nondiabetic patients. We therefore assessed a long-term survival and the changes in health-related QOL (RAND-36) as well as the New York Heart Association (NYHA) classification during the 12 years after CABG surgery in diabetics. We also compared the preoperative risk profiles, perioperative variables, early postoperative outcome, and hospital readmissions between the diabetics and nondiabetics.
Patients and Methods
Procedure and Subjects
The data were obtained from Tampere University Hospital between May 2, 1999 and November 30, 2000. The study was approved by the institutional review board of Tampere University Hospital and each patient gave written informed consent to participate. The cohort comprised of 508 patients who underwent isolated CABG electively or urgently. Emergently operated patients and those urgently operated who were unable to complete the baseline survey were excluded from the study. Excluded ones proved to be on the average 5 years older (median age, 68 vs. 63 years, p < 0.001) and less often men (64.8% vs. 82.7%, p < 0.001). There were 420 (82.7%) male patients in the sample. Age range was from 34 to 92 years (median, 63 years). Three-fourths (78.3%) of the procedures were performed electively.
Seventy-four (14.6%) patients had a history of diabetes mellitus that had necessitated active therapy with medication. Noninsulin-dependent (52.7%) and insulin-dependent diabetes mellitus patients (47.3%) were analyzed together for a reasonable statistical handling.
During the primary hospital stay, a comprehensive preoperative, perioperative, and postoperative medical data body was collected. Most patients were discharged postoperatively to the local district hospital. The data from these 18 secondary discharge hospitals were collected by referring physicians and sent to the first author (O.J.) for analysis. All outcome events and complications were recorded for joint analysis with the primary hospital data. Statistics Finland provided causes and dates of death after discharging and survival curve for age-, sex-, and hospital-catchment-area-matched controls (3:1).
Assessment of Health-Related Quality of Life and Functional Capacity
All assessments were made preoperatively and repeated 1 and 12 years later. The baseline self-report questionnaire was given to the patients the day before surgery. The follow-up questionnaire including the same measures was mailed first time to the participants 1 year after the operation. Seventeen (3.3%) had died during the first postoperative year. Four hundred and sixty-five (94.7%) of the 491 surviving patients returned the follow-up questionnaire, mean time of follow-up being 12.6 (standard deviation: 1.2) months. Compared with the 465 patients who completed the form, those 26 patients who did not were younger (median age, 54 vs. 63 years, p = 0.006). There were no significant differences in the other variables, including sex, EuroSCORE risk sum, priority of operation, or in the NYHA class. Next time, the same follow-up questionnaire was mailed to the participants 12 years after the operation. One hundred and eleven patients had died during this second period, and 296 (83.6%) of the 354 surviving patients returned the follow-up questionnaire, mean time of follow-up being 11.8 (standard deviation: 0.48) years. Those who did not complete the form were on average 3 years older (median age, 73.2 vs. 70.3 years, p = 0.390). Otherwise variables between the groups were closely equal.
We used the Finnish adaptation of the RAND-36 generic health-related QOL scale, for which there are age- and sex-adjusted reference values available for the Finnish population. 12 The RAND-36 is a widely used and validated scale, which yields scores for eight dimensions of health-related QOL: (1) general health, (2) physical functioning, (3) role limitations due to physical problems, (4) bodily pain, (5) emotional well-being, (6) role limitations due to emotional problems, (7) social functioning, and (8) energy. 13 14 The scores for each domain range from 0 to 100, 0 being the poorest and 100 the best possible health status. To reduce the number of outcome variables, two summary scores can also be used: the Physical Component Summary (PCS) equals the mean value of physical subscales (1–4), while the Mental Component Summary (MCS) equals subscales (5–8) reflecting psychosocial functioning. 15 16 17 Preoperative as well as 1- and 12-year postoperative functional capacity was ranked according to the NYHA classification.
Statistical Analysis
Categorical variables between the diabetics and nondiabetics were compared by using the chi-square test. Continuous variables were compared by the independent samples t -test for variables with normal distributions and the Mann–Whitney test for variables with nonnormal distributions. Baseline and 1-year follow-up variables were compared using paired-samples t -test and intergroup differences were analyzed by independent samples t -tests. Variance analysis for repeated measures was used when variables in all the three time points were compared. Putative predictors of decreased QOL scores were taken for binary logistic regression analysis to investigate their independency as predictors. Results are presented as odds ratios (ORs) with 95% confidence intervals (CIs). The Kaplan–Meier survival curves (10 years) are shown for diabetics and nondiabetics and matched controls. Sex- and age-weighted reference values for the RAND-36 domains were calculated and used separately for the groups in both follow-up points. Statistical analyses were performed using SPSS 20.0 for Windows.
Results
Preoperative Data
The diabetic group was characterized by slightly higher EuroSCORE risk score mean, and more patients with triple-vessel disease, low ejection fraction, raised serum creatinine concentration, and extracardiac arteriopathy. Diabetics and nondiabetics were closely similar in terms of other preoperative characteristics. Details are given in Table 1 .
Table 1. Preoperative data.
| Variable | Diabetic patients, n = 74 (%) |
Nondiabetic patients, n = 434 (%) |
p |
|---|---|---|---|
| Mean age, y (SD) | 63.0 (8.3) | 62.2 (9.5) | 0.48 |
| Male gender | 78.4 | 83.4 | 0.290 |
| EuroSCORE, mean | 3.4 | 2.6 | 0.021 |
| Left main stenosis > 50% | 80.8 | 78.6 | 0.663 |
| Ejection fraction < 50% | 37.0 | 15.3 | < 0.001 |
| Previous PTCA | 4.1 | 7.9 | 0.107 |
| Previous CABG | 9.5 | 4.4 | 0.067 |
| NYHA IV in preceding wk | 10.8 | 11.5 | 0.859 |
| AMI within 90 d | 17.6 | 12.7 | 0.253 |
| Smoking | 20.3 | 27.2 | 0.211 |
| Hypertension | 60.8 | 51.4 | 0.133 |
| Body mass index > 30 | 25.7 | 18.3 | 0.140 |
| COPD | 10.8 | 5.8 | 0.103 |
| Creatinine > 141 µmol/L | 6.8 | 0.5 | < 0.001 |
Abbreviations: AMI, acute myocardial infarction; CABG, coronary artery bypass grafting; COPD, chronic obstructive pulmonary disease; NYHA, New York Heart Association; PTCA, percutaneous coronary angioplasty; SD, standard deviation.
Intraoperative Data
Details of intraoperative data are given in Table 2 . Main target vessel revascularization was achieved in 94.6% of diabetics and 94.5% of nondiabetics, when compared with the initial preoperative coronary angiogram.
Table 2. Intraoperative data.
| Variable | Diabetic patients, n = 74 (%) |
Nondiabetic patients, n = 434 (%) |
p |
|---|---|---|---|
| Urgent operation | 23.0 | 21.2 | 0.772 |
| Use of CPB | 91.9 | 88.5 | 0.386 |
| CPB duration, mean, min (SD) | 108.2 (30.3) | 96.5 (29.8) | 0.002 |
| X-clamp time, mean, min (SD) | 78.3 (25.2) | 69.6 (24.8) | 0.040 |
| No. of distal anastomosis, mean (SD) | 3.4 (1.0) | 3.1 (1.1) | 0.040 |
| Use of internal thoracic artery graft | 93.2 | 93.8 | 0.812 |
| Use of radial artery graft | 27.0 | 22.8 | 0.017 |
Abbreviations: CPB, cardiopulmonary bypass; SD, standard deviation; X-clamp, aortic cross clamp.
Early Postoperative Outcome
Diabetes was a significant risk factor (OR = 2.74 [95% CI: 1.39–5.41], p = 0.003) for superficial sternal and limb wound infections in a univariate analysis. The diabetic group had slightly longer mean intensive care unit and hospital stay. In other adverse events, the diabetics and nondiabetics were closely equal ( Table 3 ).
Table 3. Early postoperative outcome.
| Diabetic patients, n = 74 (%) |
Nondiabetic patients, n = 434 (%) |
p | |
|---|---|---|---|
| Mechanical ventilation time, mean, h (SD) | 16.7 (7.2) | 16.3 (16.9) | 0.070 |
| Intensive care unit stay, mean, d (range) | 2.1 (1–32) | 1.5 (1–13) | 0.010 |
| Intensive care unit stay ≥ 3 d | 13.9 | 10.7 | 0.430 |
| Postoperative hospital stay, mean, d (SD) | 14.2 (7.2) | 12.6 (5.9) | 0.026 |
| Stroke | 2.7 | 1.8 | 0.623 |
| Perioperative myocardial infarction | 1.4 | 3.0 | 0.173 |
| Rise in creatinine level > 50% | 17.1 | 18.2 | 0.879 |
| Need for dialysis | 0 | 1.2 | 0.352 |
| Mediastinitis | 2.7 | 1.2 | 0.290 |
| Superficial sternal or limb wound infection | 18.9 | 7.8 | 0.003 |
| Resternotomy for bleeding | 1.4 | 2.8 | 0.477 |
| New atrial fibrillation | 28.4 | 34.1 | 0.334 |
| 30-d mortality | 2.7 | 1.6 | 0.511 |
Abbreviation: SD, standard deviation.
Mortality
Thirty-day mortality was 1.7 times higher although not significantly associated with diabetes; two (2.7%) deaths occurred in the diabetic group and seven (1.6%) in the nondiabetic group ( p = 0.511). The 1-year survival rates were 94.6% for the diabetic and 97.0% for nondiabetic ( p = 0.287) groups, respectively. All deaths in the diabetic group were directly attributable to cardiac-related factors, whereas in the nondiabetic group 46.2% of deaths were for cardiac reasons. The 10-year Kaplan–Meier survival curves are shown in Fig. 1 . Diabetes associated significantly ( p < 0.001) with worse long-term prognosis, since 10-year survival rates for diabetics and nondiabetics were 63.5 and 81.6%, respectively.
Fig. 1.
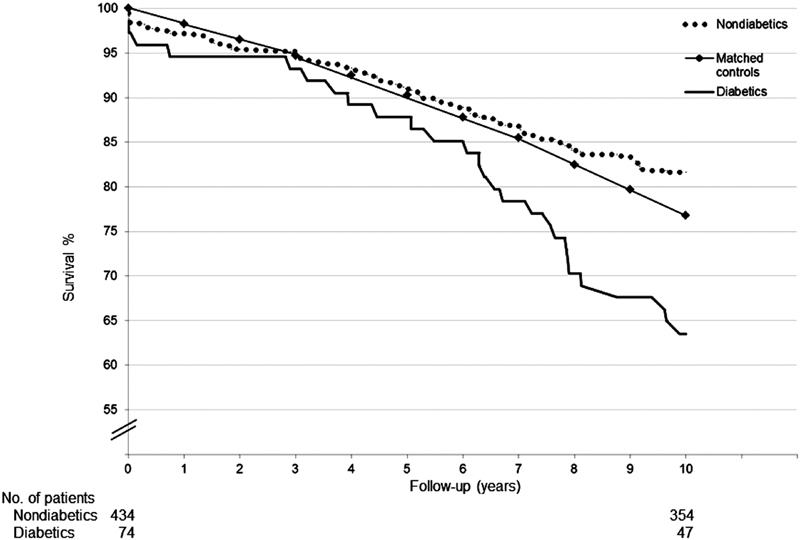
Kaplan–Meier survival curves for nondiabetics and diabetics (log-rank, p = 0.001) and matched controls.
Subsequent Outcome
During the first postoperative year, 8.1% of the diabetic and 12.2% of the nondiabetic ( p = 0.321) patients were readmitted to a secondary referral or primary hospital for cardiac-related reasons (such as recurrent chest pain, myocardial infarction, arrhythmia, dyspnea, and congestive heart failure). Eighty percent and 84.9% of the diabetic and nondiabetic patients ( p = 0.621) had improved by at least 1 NYHA functional class 1 year after the operation, and the corresponding numbers after 12 years were 75.9 and 81.1% ( p < 0.05), respectively. However, 13.8 and 9.5% of the patients ( p = 0.280) after 1 year and 17.2 and 9.5% after 12 years ( p = 0.005), respectively, were in NYHA functional class III or IV.
Changes in Health-Related Quality of Life
Both diabetic and nondiabetic patients evidenced depressed preoperative health status in all eight dimensions of the RAND-36 as compared with the reference values derived from the general Finnish population ( Fig. 2 ). The baseline scores between the study groups were closely similar being, however, in the diabetic group slightly lower in four and moderately lover in two (general health and physical functioning) of the eight RAND-36 dimensions. One year after the surgery, all health scores improved significantly ( p < 0.001) among the patients without diabetes. In diabetics, significant ( p < 0.05) changes were seen in all but one RAND-36 dimension (emotional well-being). Group differences between the diabetics and nondiabetics were statistically nonsignificant in all but two dimensions (role limitation due to physical problem, mean changes in diabetics vs. nondiabetics being +7.14 vs. +38.6, p < 0.005, and role limitation due to emotional problems, 6.4 vs. 26.5, p = 0.005, respectively) indicating almost similar improvement for diabetics and nondiabetics in six out of eight RAND-36 dimensions 1 year after the surgery.
Fig. 2.
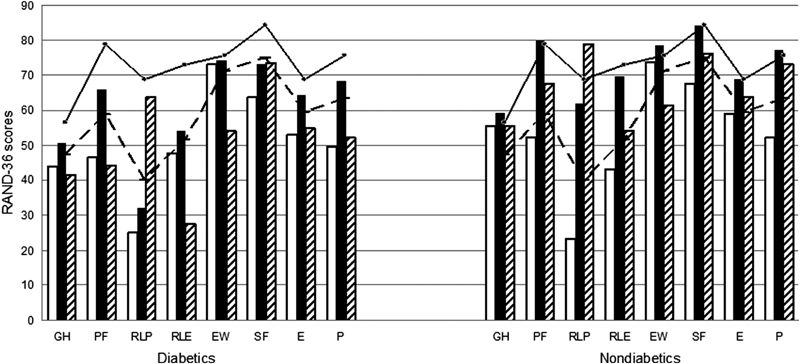
Preoperative (white bars), 1-year follow-up (black bars), and 12-year follow-up (ruled bars) RAND-36 quality of life (QOL) scores for diabetics and nondiabetics. Solid line indicates reference values for the general population in the beginning and broken line in the end of the follow-up. Dimensions are as follows: GH, general health; PF, physical functioning; RLP, role limitations due to physical problems; RLE, role limitations due to emotional problems; EW, emotional well-being; SF, social functioning; E, energy; P, pain.
In the 12-year follow-up, general decline tendency in the RAND-36 dimensions were seen ( Fig. 2 ). In both the study groups, however, there was a rise in the scores between 1 and 12 years in “role limitations due to physical problems,” and a very minor rise was also seen in “social functioning” among the diabetics and in “general health” among nondiabetics. As compared with the baseline scores, diabetics maintained at least slight improvement in four and nondiabetics in seven out of eight RAND-36 dimensions. As compared with the reference values of that age, diabetics had lower and nondiabetics higher scores in seven out of eight RAND-36 dimensions after 12 years. Repeated measures analysis of variance showed that diabetes has a significant adverse effect on the magnitude of RAND-36 improvement 1 year after the surgery and also on the decline in the 12-year follow-up in three dimensions: physical functioning, p = 0.001, role limitations due to physical problems, p < 0.005, and pain, p < 0.005.
One year after the surgery, highly significant ( p < 0.001) improvement was seen in the RAND-36 MCS and PCS summary mean scores in both patient groups ( Fig. 3 ). Diabetic patients experienced less benefit than nondiabetics, but these differences were not statistically significant ( p -values were 0.306 for the MCS and 0.086 for the PCS scores). Fourteen percent of the patients, however, showed a small reduction in their RAND-36 PCS scores at 1-year follow-up. When altogether 11 preoperative putative predictors of an adverse outcome (diabetes, higher age, female gender, left ventricular ejection fraction under 50 %, EuroSCORE risk scores of at least 6, extracardiac arteriopathy, redo surgery, multivessel disease, unstable angina, creatinine level of at least 141 µmol/L, and the use of cardiopulmonary bypass) were taken for multivariate regression analysis, only higher age proved to be an independent predictor (OR = 2.54 [95% CI: 1.22–5.30], p = 0.013) of this adverse QOL change.
Fig. 3.
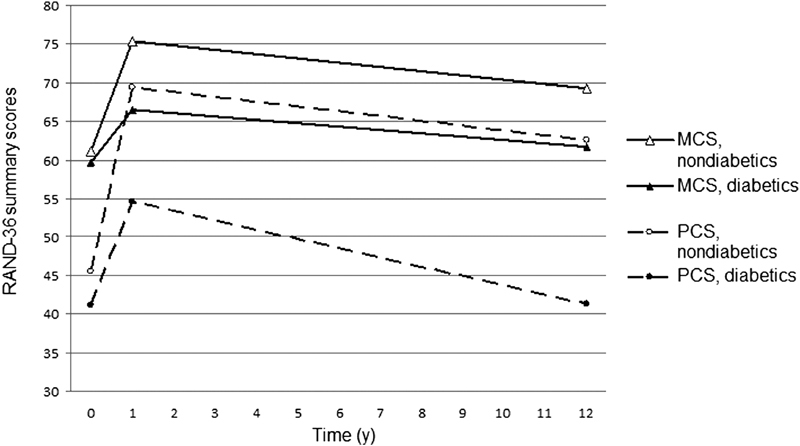
Preoperative, 1-year postoperative, and 12-year postoperative RAND-36 Mental Component Summary (MCS) and Physical Component Summary (PCS) scores of diabetics and nondiabetics.
Even though there was a significant deterioration in the MCS and PCS summary scores between 1 and 12 years after surgery, the mean scores remained superior to that before surgery in both study groups. Due to the slightly less marked improvement after 1 year and also emphasized decline during the later follow-up, however, diabetics appeared to have clearly lower scores than nondiabetics in the 12-year follow-up.
Discussion
An increasing proportion of patients undergoing CABG in Europe or in the United States are diabetic, proportions ranging from 11.8 to 27.7%. 18 19 20 In our institution, the rate has varied between 12 and 15% annually but is now, more than 10 years after beginning of the study, over 20%. Some incident reports show that QOL gain is at maximum at 1 year after the operation and that diabetic patients may gain less QOL from the operation. 21 22 We have earlier reported that although diabetic patients differ from nondiabetics having slightly inferior QOL before and 1 year after CABG, they gain similar improvement of QOL in 1 year after surgery when compared with nondiabetics. 11 Less is known, however, about their real long-term QOL.
The FREEDOM trial shows that CABG is still the treatment of choice in diabetics with multivessel disease as compared with percutaneous coronary intervention with drug-eluting stents. 23 24 In our study, the differences in 30-day and 1-year mortalities between the diabetics and nondiabetics did not reach statistical significance. However, in agreement with some previous studies, 25 26 we found an unfavorable effect of diabetes on outcome, with a 1.7-fold increased risk of 30-day mortality and a 1.8-fold risk of 1-year mortality compared with nondiabetic patients. Diabetes was significantly associated with a poorer long-term prognosis, since they had double the risk to die in 10 years' time. Diabetics had lower, whereas nondiabetics had higher survival than matched controls.
As also previously reported, 27 we identified diabetes as a significant risk factor causing superficial wound infections. Otherwise, the diabetics and nondiabetics were closely equal in terms of postoperative complications. Moreover, the prevalence of hospital readmissions for cardiac-related reasons during the first postoperative year was even slightly more common among the nondiabetic patients as compared with those with diabetes.
Even though diabetic individuals had wider spread coronary artery disease, they experienced closely similar freedom from angina symptoms at 1 year. At 10 years, however, the proportion of patients suffering angina pectoris (NYHA III or IV) was nearly double among the diabetics as compared with nondiabetics. This may reflect the fact that development of atherosclerosis is more rapid among the diabetics.
We chose the Finnish version of the RAND-36 Health Survey questionnaire, because it has been carefully translated and yields population-based reference values derived from the representative samples of Finnish population. 12 The generic health-related QOL measure has previously been used to evaluate health status in general population surveys, to determine the effectiveness of medical treatments in patients with angina, 28 and also more recently to evaluate the impact of mitral valve 29 and CABG surgery 11 30 31 on patients' QOL.
Importantly, although slightly lower in the diabetics, the RAND-36 baseline scores were still well comparable between the diabetics and nondiabetics. Moreover, the mean ages did not differ between the groups, thus simplifying the analysis because we have earlier shown higher age to predict less marked improvement in health-related QOL after CABG. 30 The overall QOL benefit 1 year after the operation was considerable in both groups. This could be demonstrated in significantly increased postoperative scores in all eight QOL dimensions in the nondiabetics and in seven out of eight dimensions among the diabetics. A significant improvement was seen also in the RAND-36 MCS and PCS scores in both groups, although a slight and nonsignificant tendency toward less marked improvement among the diabetics was seen. Furthermore, multivariate logistic regression analysis revealed higher age (but not diabetes) to be an independent predictor of lower score at 1-year follow-up.
In the 12-year follow-up, diabetics appeared to have clearly lower RAND-36 scores than nondiabetics. This is partly because of the slightly lower baseline scores and slightly less marked improvement after 1 year, but mainly due to more rapid decline during the later years. However, as compared with the baseline scores, diabetics maintained at least slight improvement in half of the RAND-36 dimensions. This is a good result, since the natural course of the QOL during the long follow-up period should be descending. As compared with the age- and sex-adjusted population-based reference values, diabetics had lower scores after the 12-year follow-up. However, this may be more due to the chronic disease itself than diabetics getting less benefit after the CABG.
Our study included individuals entering CABG in a geographically well-defined area where our institution was the only provider of cardiac operations. For practical reasons, not all of the patients were able to fill in the RAND-36 score data; acutely ill, emergently operated, and those with very high age were in some instances unable to fill in this comprehensive baseline self-report data. Although we could partly control the potential effects of election in the total population by comparing the baseline data between the studied individuals to those in whom QOL data were not available, the selection bias due to this incomplete recruitment is a factor which may limit the generalization of our results. The follow-up of the study cohort, on the other hand, was complete in 95 and 84% of the alive patients at 1 and 12 years, respectively, and except for younger age at 1-year follow-up, no other differences were found between the nonresponders and responders in preoperative clinical characteristics. Therefore, the conclusions well represent our cohort and nonresponse bias is not likely to affect the comparisons much.
To conclude, diabetics have inferior long-term survival after CABG as compared with nondiabetics. They gain nearly similar improvement of QOL in 1 year after surgery, but they have stronger downward trend over the years.
Acknowledgment
None.
Footnotes
Conflict of Interest There are no conflicts of interest.
References
- 1.Koskinen P, Mänttäri M, Manninen V, Huttunen J K, Heinonen O P, Frick M H. Coronary heart disease incidence in NIDDM patients in the Helsinki Heart Study. Diabetes Care. 1992;15(07):820–825. doi: 10.2337/diacare.15.7.820. [DOI] [PubMed] [Google Scholar]
- 2.Aronson D, Rayfield E J. Philadelphia: Lippincott-Raven; 1996. Diabetes and obesity; pp. 327–359. [Google Scholar]
- 3.Cariou B, Bonnevie L, Mayaudon H, Dupuy O, Ceccaldi B, Bauduceau B. Angiographic characteristics of coronary artery disease in diabetic patients compared with matched non-diabetic subjects. Diabetes Nutr Metab. 2000;13(03):134–141. [PubMed] [Google Scholar]
- 4.Stewart R D, Campos C T, Jennings B, Lollis S S, Levitsky S, Lahey S J. Predictors of 30-day hospital readmission after coronary artery bypass. Ann Thorac Surg. 2000;70(01):169–174. doi: 10.1016/s0003-4975(00)01386-2. [DOI] [PubMed] [Google Scholar]
- 5.Herlitz J, Caidahl K, Wiklund I et al. Impact of a history of diabetes on the improvement of symptoms and quality of life during 5 years after coronary artery bypass grafting. J Diabetes Complications. 2000;14(06):314–321. doi: 10.1016/s1056-8727(00)00115-x. [DOI] [PubMed] [Google Scholar]
- 6.Alderman E, Bourassa M, Brooks M M. Influence of diabetes on 5-year mortality and morbidity in a randomized trial comparing CABG and PTCA in patients with multivessel disease: the Bypass Angioplasty Revascularization Investigation (BARI) Circulation. 1997;96(06):1761–1769. doi: 10.1161/01.cir.96.6.1761. [DOI] [PubMed] [Google Scholar]
- 7.Detre K M, Lombardero M S, Brooks M M et al. The effect of previous coronary-artery bypass surgery on the prognosis of patients with diabetes who have acute myocardial infarction. N Engl J Med. 2000;342(14):989–997. doi: 10.1056/NEJM200004063421401. [DOI] [PubMed] [Google Scholar]
- 8.Cornwell L D, Omer S, Rosengart T, Holman W L, Bakaeen F G. Changes over time in risk profiles of patients who undergo coronary artery bypass graft surgery: the Veterans Affairs Surgical Quality Improvement Program (VASQIP) JAMA Surg. 2015;150(04):308–315. doi: 10.1001/jamasurg.2014.1700. [DOI] [PubMed] [Google Scholar]
- 9.Estafanous F G, Loop F D, Higgins T L et al. Increased risk and decreased morbidity of coronary artery bypass grafting between 1986 and 1994. Ann Thorac Surg. 1998;65(02):383–389. doi: 10.1016/s0003-4975(97)01125-9. [DOI] [PubMed] [Google Scholar]
- 10.Järvinen O, Huhtala H, Laurikka J, Tarkka M R. Higher age predicts adverse outcome and readmission after coronary artery bypass grafting. World J Surg. 2003;27(12):1317–1322. doi: 10.1007/s00268-003-7033-5. [DOI] [PubMed] [Google Scholar]
- 11.Järvinen O, Julkunen J, Saarinen T, Laurikka J, Tarkka M R. Effect of diabetes on outcome and changes in quality of life after coronary artery bypass grafting. Ann Thorac Surg. 2005;79(03):819–824. doi: 10.1016/j.athoracsur.2004.08.030. [DOI] [PubMed] [Google Scholar]
- 12.Aalto A-M, Aro A R, Teperi J. RAND-36 as a measure of health-related quality of life. Reliability, construct validity and reference values in the Finnish general population (in Finnish with English summary). Helsinki: Stakes. Res Reprod. 1999;101:101. [Google Scholar]
- 13.Hays R D, Sherbourne C D, Mazel R M. The RAND 36-item health survey 1.0. Health Econ. 1993;2(03):217–227. doi: 10.1002/hec.4730020305. [DOI] [PubMed] [Google Scholar]
- 14.Ware J E, Jr, Sherbourne C D. The MOS 36-item short-form health survey (SF-36). I. Conceptual framework and item selection. Med Care. 1992;30(06):473–483. [PubMed] [Google Scholar]
- 15.Hays R D, Stewart A L.The structure of self-reported health in chronic disease patients. Psychological assessment J Consult Clin Psychol 19905822–30.2181001 [Google Scholar]
- 16.Hays R D, Marshall G N, Wang E YI, Sherbourne C D. Four-year cross-lagged associations between physical and mental health in the Medical Outcomes Study. J Consult Clin Psychol. 1994;62(03):441–449. doi: 10.1037//0022-006x.62.3.441. [DOI] [PubMed] [Google Scholar]
- 17.Rumsfeld J S, Magid D J, O'Brien M et al. Changes in health-related quality of life following coronary artery bypass graft surgery. Ann Thorac Surg. 2001;72(06):2026–2032. doi: 10.1016/s0003-4975(01)03213-1. [DOI] [PubMed] [Google Scholar]
- 18.Abramov D, Tamariz M G, Fremes S E et al. Trends in coronary artery bypass surgery results: a recent, 9-year study. Ann Thorac Surg. 2000;70(01):84–90. doi: 10.1016/s0003-4975(00)01249-2. [DOI] [PubMed] [Google Scholar]
- 19.Nashef S AM, Roques F, Michel P et al. Coronary surgery in Europe: comparison of the national subsets of the European system for cardiac operative risk evaluation database. Eur J Cardiothorac Surg. 2000;17(04):396–399. doi: 10.1016/s1010-7940(00)00380-8. [DOI] [PubMed] [Google Scholar]
- 20.Smith S C, Jr, Faxon D, Cascio W et al. Prevention Conference VI (AHA conference proceedings): diabetes and cardiovascular disease: Writing Group VI: revascularization in diabetic patients. Circulation. 2002;105:e165–e169. doi: 10.1161/01.cir.0000013957.30622.05. [DOI] [PubMed] [Google Scholar]
- 21.Yun K L, Sintek C F, Fletcher A D et al. Time related quality of life after elective cardiac operation. Ann Thorac Surg. 1999;68(04):1314–1320. doi: 10.1016/s0003-4975(99)00675-x. [DOI] [PubMed] [Google Scholar]
- 22.Herlitz J, Wiklund I, Caidahl K et al. Determinants of an impaired quality of life five years after coronary artery bypass surgery. Heart. 1999;81(04):342–346. doi: 10.1136/hrt.81.4.342. [DOI] [PMC free article] [PubMed] [Google Scholar]
- 23.Farkouh M E, Domanski M, Sleeper L A et al. Strategies for multivessel revascularization in patients with diabetes. N Engl J Med. 2012;367(25):2375–2384. doi: 10.1056/NEJMoa1211585. [DOI] [PubMed] [Google Scholar]
- 24.Hlatky M A. Compelling evidence for coronary-bypass surgery in patients with diabetes. N Engl J Med. 2012;367(25):2437–2438. doi: 10.1056/NEJMe1212278. [DOI] [PubMed] [Google Scholar]
- 25.Herlitz J, Wognsen G B, Emanuelsson H et al. Mortality and morbidity in diabetic and nondiabetic patients during a 2-year period after coronary artery bypass grafting. Diabetes Care. 1996;19(07):698–703. doi: 10.2337/diacare.19.7.698. [DOI] [PubMed] [Google Scholar]
- 26.Cohen Y, Raz I, Merin G, Mozes B; Israeli Coronary Artery Bypass (ISCAB) Study Consortium.Comparison of factors associated with 30-day mortality after coronary artery bypass grafting in patients with versus without diabetes mellitus Am J Cardiol 199881017–11. [DOI] [PubMed] [Google Scholar]
- 27.Ridderstolpe L, Gill H, Granfeldt H, Ahlfeldt H, Rutberg H. Superficial and deep sternal wound complications: incidence, risk factors and mortality. Eur J Cardiothorac Surg. 2001;20(06):1168–1175. doi: 10.1016/s1010-7940(01)00991-5. [DOI] [PubMed] [Google Scholar]
- 28.Charlier L, Dutrannois J, Kaufman L. The SF-36 questionnaire: a convenient way to assess quality of life in angina pectoris patients. Acta Cardiol. 1997;52(03):247–260. [PubMed] [Google Scholar]
- 29.Goldsmith I RA, Lip G YH, Patel R L. A prospective study of changes in the quality of life of patients following mitral valve repair and replacement. Eur J Cardiothorac Surg. 2001;20(05):949–955. doi: 10.1016/s1010-7940(01)00952-6. [DOI] [PubMed] [Google Scholar]
- 30.Järvinen O, Saarinen T, Julkunen J, Huhtala H, Tarkka M R. Changes in health-related quality of life and functional capacity following coronary artery bypass graft surgery. Eur J Cardiothorac Surg. 2003;24(05):750–756. doi: 10.1016/s1010-7940(03)00413-5. [DOI] [PubMed] [Google Scholar]
- 31.Hokkanen M, Järvinen O, Huhtala H, Laurikka J. The effect of obesity on long-term survival and health-related quality of life after coronary artery bypass grafting: a 12-year follow-up. Coron Artery Dis. 2018;29(05):378–383. doi: 10.1097/MCA.0000000000000622. [DOI] [PubMed] [Google Scholar]