

Abstract
Background
This is an updated version of a previously published review in The Cochrane Library (2005, Issue 2) on 'Megestrol acetate for the treatment of anorexia‐cachexia syndrome'. Megestrol acetate (MA) is currently used to improve appetite and to increase weight in cancer‐associated anorexia. In 1993, MA was approved by the US Food and Drug Administration for the treatment of anorexia, cachexia or unexplained weight loss in patients with AIDS. The mechanism by which MA increases appetite is unknown and its effectiveness for anorexia and cachexia in neoplastic and AIDS (acquired immunodeficiency syndrome) patients is under investigation.
Objectives
To evaluate the efficacy, effectiveness and safety of MA in palliating anorexia‐cachexia syndrome in patients with cancer, AIDS and other underlying pathologies.
Search methods
We sought studies through an extensive search of electronic databases, journals, reference lists, contact with investigators and other search strategies outlined in the methods. The most recent search for this update was carried out in May 2012.
Selection criteria
Studies were included in the review if they assessed MA compared to placebo or other drug treatments in randomised controlled trials of patients with a clinical diagnosis of anorexia‐cachexia syndrome related to cancer, AIDS or any other underlying pathology.
Data collection and analysis
Two independent review authors conducted data extraction and evaluated methodological quality. We performed quantitative analyses using appetite and quality of life as a dichotomous variable, and analysed weight gain as continuous and dichotomous variables.
Main results
We included 35 trials in this update, the same number but not the same trials as in the previous version of the review. The trials comprised 3963 patients for effectiveness and 3180 for safety. Sixteen trials compared MA at different doses with placebo, seven trials compared different doses of MA with other drug treatments and 10 trials compared different doses of MA. Meta‐analysis showed a benefit of MA compared with placebo, particularly with regard to appetite improvement and weight gain in cancer, AIDS and other underlying conditions, and lack of benefit in the same patients when MA was compared to other drugs. There was insufficient information to define the optimal dose of MA, but higher doses were more related to weight improvement than lower doses. Quality of life improvement in patients was seen only when comparing MA versus placebo but not other drugs in both subcategories: cancer and AIDS. Oedema, thromboembolic phenomena and deaths were more frequent in the patients treated with MA. More than 40 side effects were studied.
Authors' conclusions
This review shows that MA improves appetite and is associated with slight weight gain in cancer, AIDS and in patients with other underlying pathology. Despite the fact that these patients are receiving palliative care they should be informed of the risks involved in taking MA.
Plain language summary
Megestrol acetate for treatment of anorexia‐cachexia syndrome
Anorexia‐cachexia syndrome (ACS) is a common clinical problem characterised by loss of appetite and weight loss. It is common in patients who suffer from advanced cancer, AIDS and some other conditions. At present, there is no cure for ACS.
Megestrol acetate (MA) is classified as a female hormone and is taken by mouth. It is currently used to improve appetite and to increase weight in ACS.
This updated review shows that:
‐ MA improves appetite and has a small effect on weight gain;
‐ MA does not improve quality of life;
‐ side effects are more frequent in patients treated with MA.
This review shows that MA is associated with an increased risk of blood clots (which may result in swelling, pain or redness of one extremity and not the other, sudden difficulty in breathing, severe headache or vision changes), fluid retention (resulting in swelling of the feet or hands) and death.
In patients who take MA, approximately one in four will have an increase in their appetite, one in 12 will have an increase in their weight and one in 23 will die.
Limited data are available regarding the safety of using MA, especially in the long term.
Summary of findings
Summary of findings for the main comparison. Megestrol acetate for cachexia anorexia syndrome.
| Megestrol acetate for cachexia anorexia syndrome | ||||||
| Patient or population: cachexia anorexia syndrome Settings: cancer patients, AIDS patients and patients with other underlying conditions Intervention: megestrol acetate | ||||||
| Outcomes | Illustrative comparative risks* (95% CI) | Relative effect (95% CI) | No of participants (studies) | Quality of the evidence (GRADE) | Comments | |
| Assumed risk | Corresponding risk | |||||
| Control | Megestrol acetate | |||||
| Appetite improvement compared with placebo Subjective sense of appetite, responses to follow‐up questionnaire Follow‐up: mean 4 to 12 weeks | Moderate | RR 2.19 (1.41 to 3.4) | 699 (5 studies) | ⊕⊝⊝⊝ very low1,2,3 | NNTB = 4 (95% CI 2 to 11) | |
| 214 per 1000 | 469 per 1000 (302 to 728) | |||||
| Weight improvement compared with placebo % of patients that improved their weight in kg Follow‐up: mean 4 to 12 weeks | Study population | RR 1.51 (1.08 to 2.11) | 1106 (10 studies) | ⊕⊝⊝⊝ very low3,4,5 | NNTB = 12 (95% CI 6 to 69) | |
| 246 per 1000 | 329 per 1000 (260 to 408) | |||||
| Moderate | ||||||
| 233 per 1000 | 312 per 1000 (247 to 387) | |||||
| Appetite improvement compared to other drugs Questionnaire of appetite rating Follow‐up: median 8 weeks | Study population | RR 1.03 (0.64 to 1.67) | 475 (1 study) | ⊕⊕⊝⊝ low6,7 | NNTB = NS | |
| 325 per 1000 | 335 per 1000 (208 to 543) | |||||
| Moderate | ||||||
| 325 per 1000 | 335 per 1000 (208 to 543) | |||||
| Weight improvement compared to other drugs % of patients that improved their weight in kg Follow‐up: mean 8 to 15 weeks | Study population | RR 1.66 (1.09 to 2.52) | 1131 (7 studies) | ⊕⊝⊝⊝ very low3,8,9,10 | NNTB = 22 (95% CI 9 to 159) | |
| 72 per 1000 | 119 per 1000 (78 to 180) | |||||
| Moderate | ||||||
| 57 per 1000 | 95 per 1000 (62 to 144) | |||||
| Deaths Follow‐up: mean 2 to 15 weeks | Study population | RR 1.42 (1.04 to 1.94) | 1307 (10 studies) | ⊕⊝⊝⊝ very low11,12,13,14 | NNTH = 23 (95% CI 10 to 200) | |
| 102 per 1000 | 146 per 1000 (107 to 200) | |||||
| Moderate | ||||||
| 48 per 1000 | 69 per 1000 (50 to 94) | |||||
| High | ||||||
| 0 per 1000 | 0 per 1000 (0 to 0) | |||||
| Thromboembolic phenomena including thrombophlebitis Follow‐up: mean 4 to 16 weeks | Moderate | RR 1.84 (1.07 to 3.18) | 1544 (11 studies) | ⊕⊝⊝⊝ very low13,15,16 | NNTH = 55 (95% CI 22 to 385) NNTH = 11 (95% CI 4 to 77) NNTH = 2 (95% CI 1 to 15) 17 | |
| 100 per 1000 | 191 per 1000 (113 to 323) | |||||
| High | ||||||
| 500 per 1000 | 955 per 1000 (565 to 1000) | |||||
| Oedema Follow‐up: mean 2 to 12 weeks | Study population | RR 1.36 (1.07 to 1.72) | 2182 (12 studies) | ⊕⊝⊝⊝ very low18,19 | NNTH = 28 (95% CI 4 to 143) | |
| 104 per 1000 | 141 per 1000 (111 to 179) | |||||
| Moderate | ||||||
| 109 per 1000 | 148 per 1000 (117 to 187) | |||||
| *The basis for the assumed risk (e.g. the median control group risk across studies) is provided in footnotes. The corresponding risk (and its 95% confidence interval) is based on the assumed risk in the comparison group and the relative effect of the intervention (and its 95% CI). CI: confidence interval;NNTB: number needed to treat for an additional beneficial outcome; RR: risk ratio | ||||||
| GRADE Working Group grades of evidence High quality: Further research is very unlikely to change our confidence in the estimate of effect. Moderate quality: Further research is likely to have an important impact on our confidence in the estimate of effect and may change the estimate. Low quality: Further research is very likely to have an important impact on our confidence in the estimate of effect and is likely to change the estimate. Very low quality: We are very uncertain about the estimate. | ||||||
1 Adequate sequence generation was low risk only in Feliu 1992. Allocation concealment was unclear in all studies. In three out of five studies appetite was rated as high risk of bias because it could be sensitive to lack of blinding. 2 The two different subcategories (cancer and AIDS patients) showed similar effects. Heterogeneity was moderate (I2 = 59%) and is due to the study of Schmoll 1991. Heterogeneity without this study became low (I2 = 39%). The confidence intervals of the studies overlap. 3 Doses of MA were very different (960 mg, 800 mg, 480 and 160 mg) compared with placebo. 4 Eight out of 10 studies were rated as unclear for adequate sequence generation; only one study was rated as low risk for allocation concealment. All studies were rated as low risk of bias for blinding. Schmoll 1991, Schmoll 1992 and Von Roenn 1994 were rated low risk because lack of blinding is not related to weight. Only one study was rated as high risk of bias for incomplete outcome data. All trials were rated unclear with respect to freedom from 'other bias'. 5 The effect is quite similar and CI values overlap for most of the studies. However, two studies (Feliu and Schmoll) showed greater effects and the CI was quite wide. The study of Yeh 2000 showed different results in patients with geriatric cachexia to patients with neoplasia and AIDS. Heterogeneity was moderate (I2 = 53%). 6 The only study found was rated as unclear risk of bias for adequate sequence generation and allocation concealment. It was not a blinded study and was rated as high risk of bias for the blinding item. 7 We pooled the results of two comparisons: MA versus dexamethasone and fluoxymesterone. 8 All studies except Mwamburi 2004 were rated as unclear risk of bias for adequate sequence generation and allocation concealment study. 9 Heterogeneity was moderate (I2 = 51%) but heterogeneity between subgroups was high. The effect seemed to be different in cancer and AIDS patients. The CI values overlapped for most of the studies. Cancer patients showed a better response for weight. 10 The CI interval (9 to 159) is too wide to establish a true effect. 11 Only one study out of seven was rated as low risk of bias for adequate sequence generation and allocation concealment. 12 Although the I2 in both subgroups was 0% and the overall I2 was low (6.4%), patients with cancer, AIDS and other pathologies were quite different. Moreover the comparator included placebo and other drugs. 13 Different doses of MA in each subgroup. 14 The CI interval for the NNT (10 to 200) is too wide to establish a true effect. 15 Adequate sequence generation was rated as low risk in three out of 10 trials and allocation concealment was rated low risk only in two out of 10. 16 Although the I2 in both subgroups was 0% and the overall I2 was low (0%), patients with cancer, AIDS and other pathologies were quite different. Moreover the comparator included placebo and other drugs. 17 The first NNTH was calculated with data of this Systematic Review. The second NNTH was calculated with an expected value of 0.10% and the last was calculated with an expected rate of 50%. 18 Only three out of 11 trials were rated as low risk for adequate sequence generation. Only two out of 11 trials were rated as low risk for allocation concealment. 19 Although the I2 in both subgroups was 0% and the overall I2 was low (0%), patients with cancer, AIDS and other pathologies such as COPD were quite different. Moreover the comparator included placebo and other drugs.
Background
Description of the condition
This review is an update of a previously published review in The Cochrane Library (2005, Issue 2) on megestrol acetate for anorexia‐cachexia syndrome. Anorexia‐cachexia syndrome is a common clinical problem that substantially impacts upon the quality of life and survival of affected patients. It is characterised by loss of appetite, weight loss and tissue wasting, accompanied by a decrease in muscle mass and adipose tissue, impoverishing quality of life and often preceding the patient's death (Nelson 1994; Splinter 1992).
More than two‐thirds of patients dying from advanced cancer suffer from anorexia‐cachexia syndrome (Argilés 2001). Anorexia‐cachexia syndrome is also described in other pathologies such as in acquired immune deficiency syndrome (AIDS), anorexia nervosa, degenerative illnesses of the central nervous system and terminally ill patients (Von Roenn 1996). Incidence is variable and difficult to determine but in general the syndrome may occur in 15% to 40% of patients with cancer, and in more than 80% of patients with advanced illness (Bruera 1992).
The mechanism that causes cachexia is poorly understood, but inflammatory cytokines probably have a role, such as tumour necrosis factor‐alpha (which is also nicknamed 'cachexin' or 'cachectin'), angiotensin II and glucocorticoids, interferon gamma and interleukin 6, as well as the tumour‐secreted proteolysis‐inducing factor (Tisdale 2009). Ghrelin levels are also high in patients who have cancer‐induced cachexia (Wolf 2006).
An international consensus statement defines cachexia as weight loss greater than 5%, or weight loss greater than 2% in individuals already showing depletion according to current body weight and height (body mass index (BMI) < 20 kg/m2) or skeletal muscle mass (sarcopaenia) (Fearon 2011).
Description of the intervention
Early intervention and attention to nutritional status are essential in patients with anorexia‐cachexia syndrome. Pharmacological interventions for neoplastic cachexia include drugs that stimulate the appetite: megestrol acetate (MA) and dronabinol; cytokine inhibitors (such as cyproheptadine, thalidomide, pentoxifylline and an eicosapentaenoic acid (EPA)); and anabolic agents such as nandrolone decanoate, oxandrolone and corticosteroids (Balog 1998). EPA seems to suppress well‐characterised mediators of cancer‐associated wasting, including interleukin‐6, an inflammatory cytokine. It also acts over the proteolysis‐inducing factor, another well‐described mediator (Barber 1999; Wigmore 1997).
MA is a synthetic progestogen agent. It was first synthesised in England in 1963. Developed as an oral contraceptive, the agent was first tested in the treatment of breast cancer in 1967 and, later on, for the treatment of endometrial cancer. MA is currently used to improve appetite and to increase weight in cancer‐associated anorexia. From September 1993, MA was approved by the Food and Drug Administration (FDA) in the USA for the treatment of anorexia, cachexia or unexplained weight loss in patients with AIDS. In addition, there are recent reports of the drug being used to improve the quality of life of elderly patients with cachexia. A possible role in anorexia nervosa has also been proposed (Yeh 2000).
MA is only available as a tablet of 20 to 40 mg or liquid form (200 mg or 625 mg/5ml MA). A great variability in dosage is observed in the scientific literature, ranging from 100 mg to 1600 mg per day (Tchekmedyian 1992; Von Roenn 1994). The liquid form is usually dosed at 800 mg per day and the oral form at four tablets per day. The recommended duration of treatment is six weeks or more. MA is considered a relatively non toxic drug with a low incidence of adverse effects, such as fluid retention, venous thrombosis, diarrhoea, rash, impotence, pruritus, increased blood sugar level and headache (Loprinzi 1990a; Vadell 1998; Von Roenn 1994). The recommended adult initial dosage of MA oral suspension in HIV patients is 800 mg/day (20 ml/day); clinically effective dosages are expected to range from 312.5 to 625 mg daily. In patients with neoplastic disease the most common dosages used range from 480 to 600 mg daily.
How the intervention might work
Although the mechanism by which MA increases appetite is unknown, most hypotheses point to action on cytokines, which inhibit the action of tumour necrosis factor on fatty tissue and its products. Currently, interest is especially focused on its effectiveness in the treatment of anorexia and cachexia in neoplastic and AIDS patients. Studies at the Mayo Clinic and The North Central Cancer Treatment Group Study have reported and reviewed multiple placebo‐controlled, randomised, double‐blind clinical trials of MA and other drugs for the improvement of anorexia‐cachexia syndrome in all types of cancer (Jatoi 2004; Loprinzi 1990a).
Why it is important to do this review
This is an update of a previous systematic review. In this update we identified new trials and found that more diseases have begun to be treated with MA. We focused on the adverse events of MA as main outcomes.
Objectives
To evaluate the effectiveness and safety of MA in palliating anorexia‐cachexia syndrome in subgroups of patients with cancer, AIDS and other underlying pathologies.
Methods
Criteria for considering studies for this review
Types of studies
Randomised controlled trials (RCTs) which may be double‐blind, single‐blind or unblinded.
In the previous version of the review we included some cross‐over studies. However, in the current update we decided not to include these studies, because the time between the two phases is too short to be certain whether any adverse event or outcome, such as weight or appetite, is due to MA or placebo. Moreover, treating with MA or placebo in the first phase could result in groups in the second phase not having the same basal characteristics. Finally, due to the fact that these patients are very frail and have high mortality, the number of patients in such studies could be too low.
Types of participants
Patients with a clinical diagnosis of anorexia‐cachexia related to cancer, AIDS or another underlying pathology (independent of gender, age or race) were included. We decided to include only trials with patients who clearly had some previous weight loss or definition of cachexia‐anorexia syndrome.
Types of interventions
The review focuses on the following treatment comparisons:
MA at any dose versus placebo;
MA at any dose versus other active drug treatments (stimulants of appetite such as dronabinol, cytokine inhibitors such as cyproheptadine, eicosapentaenoic acid (EPA) and anabolic agents such as nandrolone decanoate and corticosteroids);
MA at different doses.
Types of outcome measures
We assessed the following outcome measures.
Primary outcomes
Weight gain, measured as a dichotomous variable (number of patients who gained weight) and as a continuous variable in kg (difference between baseline and the end of treatment).
Improvement in quality of life by means of a validated instrument, or with scales of functional scores (e.g. Karnofsky Index and performance status) that measure the well‐being status of the patient. The quality of life measures will depend on the instrument used, e.g. patient assessments using a Likert‐type scale based on patients' statements and self report questionnaires, or the use of the Spitzer Index of quality of life, completed by the clinician.
Adverse effects: we analysed these as the number of patients who suffered an event described as a side effect by the authors of each study.
Secondary outcomes
Appetite increase, expressed as a dichotomous variable (number of patients who experienced appetite increase) or a continuous variable.
Measurements of the mid‐arm circumference and triceps skin fold thickness by anthropometry, as a percentage of the differences in the total body muscle and fat mass.
Deaths.
Study withdrawals and drop‐outs were analysed as:
total number of drop‐outs and withdrawals;
number of withdrawals due to lack of effectiveness of treatment;
number of withdrawals due to adverse effects.
Search methods for identification of studies
Electronic searches
We searched the following electronic databases to identify relevant studies:
Cochrane Pain, Palliative and Supportive Care Group Trials Register (2011, Issue 3) (see Appendix 1);
Cochrane Central Register of Controlled Trials (CENTRAL) (The Cochrane Library 2011, Issue 3);
MEDLINE from 1966 to May 2012 (see Appendix 2);
EMBASE from 1980 to May 2012 (see Appendix 3).
We combined the general strategy for identifying RCTs in MEDLINE with a strategy designed to retrieve trials of MA for cachexia. For the identification of studies to include in or consider for this review, we developed detailed search strategies for each database searched.
Searching other resources
We checked lists of references from systematic reviews of MA and from the included studies to identify further trials.
Studies were not excluded on the basis of language or publication status (published, unpublished, in press and in progress).
We sought additional data from published trials by contacting authors. We consulted the information made available by the main researchers/sponsors.
We also reviewed information on the clinical trial meta‐register database (http://www.controlled‐trials.com/mrct/).
Data collection and analysis
Selection of studies
Two review authors independently reviewed the titles and abstracts of studies identified in the search to assess which studies might potentially meet the inclusion criteria. Where there was doubt, we acquired the full article for further inspection. We then obtained potential studies identified by this process and two authors independently screened them to see if they met the review criteria. We created an Excel spreadsheet. We did not need to resolve any disagreements through discussion.
Data extraction and management
Two authors independently extracted data using a data collection form (in Excel). We checked any disagreements in the data collection and we reviewed the studies again only if there was a mismatch between them. We collected, when possible, data for intention‐to‐treat populations as raw numbers, summary measures with standard deviations, confidence intervals and P values of outcomes reported and compiled these into the Excel spreadsheet.
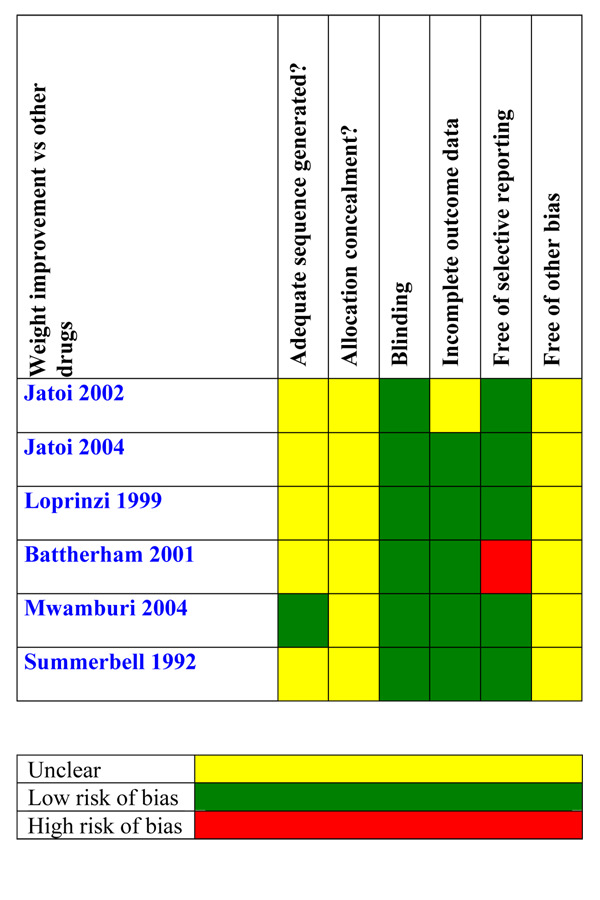
Assessment of risk of bias in included studies
According to the recommendations in the Cochrane Handbook for Systematic Reviews of Interventions, we assessed the risk of bias by creating a summary of 'Risk of bias' table (Higgins 2011).
The main criteria used to measure the risk of bias included: blinding of participants, allocation concealment, random sequence generation, incomplete outcome data, selective reporting of outcomes and other bias (early stopping of trials or imbalance in the baseline of people in the groups). We explicitly judged the risk of bias in each study on the basis of the following criteria: low risk of bias, high risk of bias, unclear risk of bias (either lack of information or uncertainty over the potential bias). These criteria were included in the tables. Disagreements were resolved by discussion between the two review authors. If needed, a third review author was available for discussion in case of unresolved disagreements.
We also evaluated the methodological quality of the studies using a validated scale called the Oxford Quality Scale (Jadad 1996), according to the following domains: concealment of allocation, double‐blinding, intention‐to‐treat analysis and loss to follow‐up. We also assessed each study using the zero to five‐point scale described by Jadad 1996, as summarised below.
Was the study described as randomised? (1 = yes; 0 = no).
Was the study described as double‐blind? (1 = yes; 0 = no).
Were withdrawals and drop‐outs described? (1 = yes; 0 = no).
Was the method of randomisation well‐described and appropriate? (1 = yes; 0 = no); deduct one point if inappropriate.
Was the double‐blinding well‐described and appropriate? (1= yes; 0 = no); deduct one point if inappropriate.
Measures of treatment effect
We use the risk ratio (RR) because it is more intuitive (Boissel 1999) than the odds ratio and because odds ratios tend to be interpreted as RR by clinicians (Higgins 2011). We used the risk difference to quantify the number needed to treat for an additional beneficial outcome (NNTB) (Laupacis 1988). For continuous data we used mean differences (MD) when the results were measured in the same way in different studies. We used standardised mean differences (SMD) when the results obtained were conceptually the same but used different measurement scales. We recorded the central estimate (mean) and standard deviation. Where these were not directly stated we calculated them from the standard error.
Unit of analysis issues
Most of the studies used a simple parallel‐group design, in which participants are individually randomised to one of two intervention groups. Unit of analysis was not an issue in this review.
Dealing with missing data
We carried out an intention‐to‐treat analysis. Everyone allocated to the intervention was counted whether they completed the follow‐up or not. We have assumed that those who dropped out had no change in their outcome. This rule is conservative concerning response to treatment, because it assumes that those discontinuing the studies would not have responded. It is not conservative concerning adverse effects, but we felt that assuming that all those leaving early would have developed side effects would overestimate risk.
When published data were missing, incomplete or inconsistent with RCT protocols or meeting abstracts, we asked for further information from the authors/manufacturers. We have only excluded abstracts of studies that are interim reports of studies that have not yet finished recruiting.
Assessment of heterogeneity
We explored heterogeneity between the trials using the Chi2 test for heterogeneity with a 10% level of significance, and the I2 statistic. We complied with the recommendations in the Cochrane Handbook for Systematic Reviews of Interventions, which determine that an I2 value of 0% to 40% might not be important; 30% to 60% may represent moderate heterogeneity; 50% to 90% may represent substantial heterogeneity; and 75% to 100% considerable heterogeneity (Deeks 2008).
Assessment of reporting biases
We planned to explore reporting bias using funnel plots if we had a meta‐analysis of 10 or more studies. The items in the assessment biases were: 1) Allocation 2) Blinding 3) Incomplete outcome data 4) Selective reporting 5) Other potential source of bias
Data synthesis
We explored the need to analyse the results according to a fixed or random‐effects analysis (Laird 1990). In the event of significant heterogeneity we may have made a decision not to present combined result (Schulz 1993). We calculated the number needed to treat for an additional beneficial outcome (NNT or NNTB) and the number needed for an additional harmful outcome (NNTH). We used the mean difference to calculate the benefit (absolute change expressed as both a percentage and in its original units) for continuous outcomes such as Karnofsky Index score or weight gain.
For dichotomous variables, we computed treatment effects as risk ratios (RR) with 95% confidence intervals (CI). For continuous variables such as weight gain or appetite gain we calculated differences in means and their 95% CI (mean difference (MD)) and for quality of life (including different scales), we calculated differences in means and their 95% CI (standardised mean difference (SMD)). Only validated scales with a normal distribution were included in the analysis. We determined validity of the scale from the psychometric properties of the instrument as described in the trial by the review authors.
We used a random‐effects model in the analysis. We analysed statistical heterogeneity between studies with the Chi2 test, using P < 0.1 as a cut‐off value to represent the presence of significant heterogeneity. When a high level of heterogeneity was detected, we made attempts to identify the sources of the heterogeneity and performed subsequent meta‐analysis using a random‐effects model.
We used the 'Grades of Recommendation, Assessment, Development and Evaluation' approach developed by the GRADE Working Group for grading the quality of evidence. The GRADE approach specifies four levels of quality. The highest quality rating is for randomised trial evidence. Review authors can, however, downgrade randomised trial evidence to moderate, low or even very low‐quality evidence, depending on the presence of five specific factors (Higgins 2011, chapter 11).
We used GRADE software to provide an overall grading of the quality of the evidence by outcome.
Subgroup analysis and investigation of heterogeneity
If heterogeneity was detected we planned to carry out subgroup analysis (Yusuf 1991) and/or a meta‐regression in order to explain it (Thompson 1999).
Subgroup analyses were planned for:
patients with AIDS;
patients with cancer;
patients with other underlying disease (elderly, chronic obstructive pulmonary disease (COPD), cardiac heart failure);
high doses of MA (=> 800 mg/d) versus low doses of MA (< 800 mg/d);
duration of trial, size and methodological quality.
Sensitivity analysis
In order to explore the impact of specific factors on the meta‐analysis results, we undertook sensitivity analyses with:
studies of high methodological quality, defined as studies with appropriate concealment of allocation, appropriate blinding and analysis by intention‐to‐treat (ITT);
studies where patients received more than six weeks of treatment.
We carried out the statistical analyses using the statistical package in Review Manager 5.1.6 (RevMan 2011).
Results
Description of studies
Results of the search
Searching the electronic databases identified:
385 references in MEDLINE;
401 references in EMBASE; and
164 references in the Cochrane Central Register of Controlled Trials (CENTRAL).
We located an additional reference through Google and one more through a researcher who was involved in one trial that was never published.
We updated the first search to May 2012 (see Appendix 2; Appendix 3; Appendix 1) and one trial was added (Madeddu 2012).
A flowchart of included studies, according to the PRISMA recommendations, is shown in Figure 1
1.
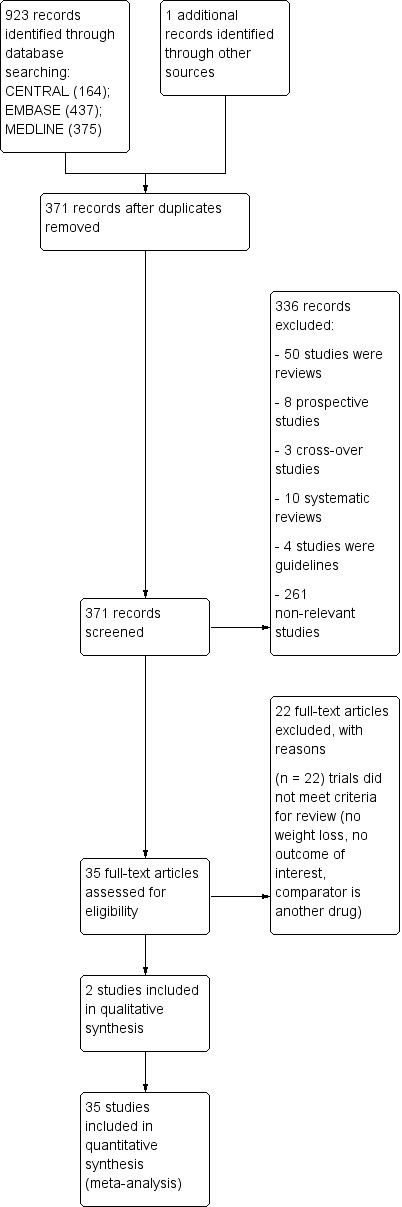
Study flow diagram.
Included studies
We included most of the trials that were in the previous version of the review: Batterham 2001; Beller 1997; De Conno 1998; Eubanks 2002; Feliu 1992; Fietkau 1996; Gambardella 1998; Gebbia 1996; Heckmayr 1992; Jatoi 2002; Jatoi 2004; Loprinzi 1990b; Loprinzi 1994; Loprinzi 1999a; McMillan 1994; Oster 1994; Sancho‐Cuesta 1993; Schmoll 1992; Tchekmedyian 1992; Ulutin 2002; Vadell 1998; Von Roenn 1994; Weisberg 2002; Yeh 2000 and included the following new trials: Casado 2008; Giacosa 1997; Herrejon 2011; Lesser 2006; Madeddu 2012; Macbeth 1994; Mwamburi 2004; Schmoll 1991; Summerbell 1992;Timpone 1997; Wanke 2007. Ultimately we included 35 trials, representing 3963 patients studied for effectiveness and 3240 for safety. We could not use the data from the included trials Lesser 2006 and Gambardella 1998. See Characteristics of included studies table.
Many of these citations were replicated across the three databases.
The designs of the 35 trials were as follows:
MA at different doses compared with placebo
Seventeen trials compared MA at different doses with placebo: Beller 1997; Casado 2008; De Conno 1998; Eubanks 2002; Feliu 1992; Fietkau 1996; Herrejon 2011; Loprinzi 1990b; McMillan 1994; Oster 1994; Schmoll 1991; Schmoll 1992; Tchekmedyian 1992; Vadell 1998; Von Roenn 1994; Weisberg 2002; Yeh 2000. In Madeddu 2012 one arm was carnitine plus celecoxib and the second arm was carnitine plus celecoxib plus MA 300 mg/day. In this trial only few safety data were available for the meta‐analysis and we decided include it in this comparison.
MA at different doses compared with other treatment drugs
Seven trials compared different doses of MA with other drug treatments. MA was compared with dronabinol in two studies (Jatoi 2002; Timpone 1997); dexamethasone and fluoxymesterone in one study (Loprinzi 1999); nandrolone decanoate in one study (Batterham 2001); cyproheptadine in one study (Summerbell 1992); oxandrolone in two studies (Lesser 2006; Mwamburi 2004); prednisolone in one study (Macbeth 1994) and eicosapentaenoic acid (EPA) in one study (Jatoi 2004).
MA at different doses
Ten trials compared different doses of MA.
Beller 1997: MA 160 mg versus MA 480 mg
Casado 2008: MA 160 mg versus MA 960 mg versus placebo
Gebbia 1996: MA 160 mg versus MA 320 mg
Heckmayr 1992: MA 160 versus MA 480 mg
Loprinzi 1994: MA 160 versus MA 480 mg versus MA 800 mg versus MA 1280 mg
Sancho‐Cuesta 1993: MA 160 versus MA 320 mg
Schmoll 1991: MA 480 mg versus MA 960 mg versus placebo
Schmoll 1992: MA 480 mg versus MA 960 mg versus placebo
Ulutin 2002: MA 160 mg versus MA 320 mg
Vadell 1998: MA 160 mg versus MA 480 mg versus placebo
Wanke 2007: MA 575 mg versus MA 800 mg
We categorised the included studies according to the healthcare problem of the patient ‐ see Table 2 for a summary.
1. Patient condition and numbers recruited to each trial.
| Study | Lung cancer | Gastrointestinal and pancreas | Head and neck cancer | Gynaecological cancer | Other cancer | AIDS | COPD | Cystic fibrosis | Elderly |
| Batterham 2001 | | | | | | 15 | | | |
| Beller 1997 | 48 | 106 | 18 | | 68 | | | | |
| Casado 2008 | 35 | 21 | 11 | 6 | 21 | | | | |
| De Conno 1998 | 21 | 10 | 6 | | 5 | | | | |
| Eubanks 2002 | | | | | | | | 17 | |
| Feliu 1992 | 75 | 36 | 9 | | 30 | | | | |
| Fietkau 1996 | | | 64 | | | | | | |
| Gambardella 1998 | No data | No data | No data | No data | No data | | | | |
| Gebbia 1996 | 50 | 22 | 40 | | 10 | | | | |
| Giacosa 1997 | 3 | 10 | | | 5 | | | | |
| Heckmayr 1992 | 66 | | | | | | | | |
| Herrejon 2011 | | | | | | | 40 | | |
| Jatoi 2001 | 208 | 139 | | | 121 | | | | |
| Jatoi 2004 | 166 | 141 | | | 114 | | | | |
| Lesser 2006 | No data | No data | No data | No data | 74 | | | | |
| Loprinzi 1990b | 42 | 53 | | | 38 | | | | |
| Loprinzi 1994 | 130 | 111 | | | 101 | | | | |
| Loprinzi 1999 | 192 | 171 | 114 | | | | | | |
| Mwamburi 2004 | | | | | | 40 | | | |
| McMillan 1994 | | 26 | | | 12 | | | | |
| Macbeth 1994 | 75 | | | | | | | | |
| Madeddu 2012 | 12 | 24 | 13 | 7 | | | | | |
| Oster 1994 | | | | | | 100 | | | |
| Sancho‐Cuesta 1993 | | | | | | | | | |
| Schmoll 1991 | | | | | | | | | |
| Schmoll 1992 | | | | | | | | | |
| Tchekmedyian 1992 | 27 | 23 | 4 | | 35 | | | | |
| Von Roenn 1994 | | | | | | 270 | | | |
| Ulutin 2002 | 119 | | | | | | | | |
| Timpone 1997 | | | | | | 50 | | | |
| Vadell 1998 | 75 | 35 | 5 | 8 | 27 | | | | |
| Weisberg 2002 | | | | | | | 145 | | |
| Yeh 2000 | | | | | | | | | 69 |
| Total | 1342 | 928 | 284 | 21 | 907 | 475 | 185 | 17 | 69 |
Patient characteristics
A total of 4234 patients were included in this update.
Patients with any cancer
Twenty‐three trials (3428 patients) (Beller 1997; Casado 2008; De Conno 1998; Feliu 1992; Fietkau 1996; Gambardella 1998; Gebbia 1996; Giacosa 1997; Heckmayr 1992; Jatoi 2002; Jatoi 2004; Lesser 2006Loprinzi 1990b; Loprinzi 1994; Loprinzi 1999; McMillan 1994; Macbeth 1994; Madeddu 2012; Sancho‐Cuesta 1993Schmoll 1991; Schmoll 1992; Tchekmedyian 1992; Ulutin 2002Vadell 1998) assessed the effectiveness/safety of MA for anorexia‐cachexia syndrome in cancer patients where the primary site was:
lung cancer(1342 patients);
gastrointestinal and pancreatic cancer(928 patients);
head and neck cancer(284 patients);
gynaecological cancer (21 patients);
non‐specified sites(907 patients).
Patients with AIDS
Five trials (475 patients) assessed the effectiveness of MA for anorexia‐cachexia syndrome in AIDS patients (Batterham 2001; Mwamburi 2004; Oster 1994; Timpone 1997; Von Roenn 1994).
Patients with other underlying conditions
Four trials (271 patients) assessed the effectiveness of MA for anorexia‐cachexia syndrome in patients with the following conditions:
COPD: two trials with 185 patients (Herrejon 2011; Weisberg 2002);
cystic fibrosis: one trial with 17 patients (Eubanks 2002);
elderly: one trial with 69 patients (Yeh 2000).
Dose
Across the studies, the dose of MA ranged from 100 mg per day to 1600 mg per day in at least one of the study arms.
The doses of MA assessed were as follows:
400 mg per day or less
Seventeen trials: (Batterham 2001 400 mg per day; Beller 1997 160 mg per day; De Conno 1998 320 mg per day; Feliu 1992 240 mg per day; Fietkau 1996 160 mg per day; Gebbia 1996 160 mg and 320 mg per day; Giacosa 1997 320 mg per day; Heckmayr 1992 160 mg per day; Herrejon 2011 320 mg per day; Loprinzi 1994 160 mg per day; Madeddu 2012 320 mg/per day Sancho‐Cuesta 1993 160 mg per day; Summerbell 1992 40 mg daily on alternate weeks to a maximum of 160 mg daily; Timpone 1997 250 mg per day; Ulutin 2002 160 mg and 320 mg per day; Vadell 1998 160 mg per day; Von Roenn 1994 100 mg and 400 mg per day).
480 mg per day
Seven trials: Beller 1997; Heckmayr 1992; Loprinzi 1994; McMillan 1994; Schmoll 1991; Schmoll 1992; Vadell 1998.
575 to 600 mg per day
Two trials: (Wanke 2007 575 mg per day; Jatoi 2004 600 mg per day).
750 to 800 mg per day
Ten trials: (Timpone 1997 750 mg per day; Jatoi 2002; Loprinzi 1990b; Loprinzi 1994; Loprinzi 1999; Mwamburi 2004; Oster 1994; Von Roenn 1994; Weisberg 2002; Yeh 2000 (all 800 mg per day)).
1280 mg per day
One trial: Loprinzi 1994.
1600 mg per day
One trial: Tchekmedyian 1992.
One trial in children with cystic fibrosis assessed MA at a dose of 10 mg/kg per day (Eubanks 2002).
Study duration
The study duration ranged from two weeks to 24 weeks. The median trial duration time was eight weeks. Seventeen trials had a duration of 12 weeks or more. (See Characteristics of included studies table).
Final assessment at two weeks (Beller 1997; De Conno 1998).
Assessment at four weeks/one month (Gebbia 1996; Heckmayr 1992; Loprinzi 1990b).
Assessment at six weeks (Fietkau 1996; Tchekmedyian 1992).
Assessment at eight weeks/two months (Feliu 1992; Jatoi 2002; Herrejon 2011; Macbeth 1994; Mwamburi 2004; Loprinzi 1994; Loprinzi 1999b; Schmoll 1991; Schmoll 1992; Weisberg 2002).
Assessment at 12 weeks/three months (Batterham 2001; Casado 2008; Jatoi 2004; Lesser 2006; McMillan 1994; Oster 1994; Timpone 1997; Ulutin 2002; Vadell 1998; Von Roenn 1994; Wanke 2007).
Assessment at 13 to 16 weeks (Madeddu 2012; Summerbell 1992; Yeh 2000).
Assessment at six months or more (Eubanks 2002; Sancho‐Cuesta 1993).
Excluded studies
We excluded a total of 110 studies.
In the present update we excluded the following studies that had been included in the previous review: Bruera 1990(cross‐over study); Bruera 1998(cross‐over study); Chen 1997 (a trial of patients with head and neck cancers but only 18% were underweight; moreover 11% were overweight); Erkurt 2000 (this study included a proportion of patients without weight loss in the previous six months and in addition patients were not balanced in both arms, specifically while in the MA arm 27% of the patients received oral nutrition support, in the placebo group 72% of patients received it); Lai 1994 (patients did not have cachexia or any weight loss); Marchand 2000 (cross‐over study); McQuellon 2002 (patients were not described as patients with cachexia); Rowland 1996 (patients were not described as patients with cachexia and anorexia); and Zeca 1995 (a trial that included patients with cancer and anorexia, but cachexia was not needed as a inclusion criterion).
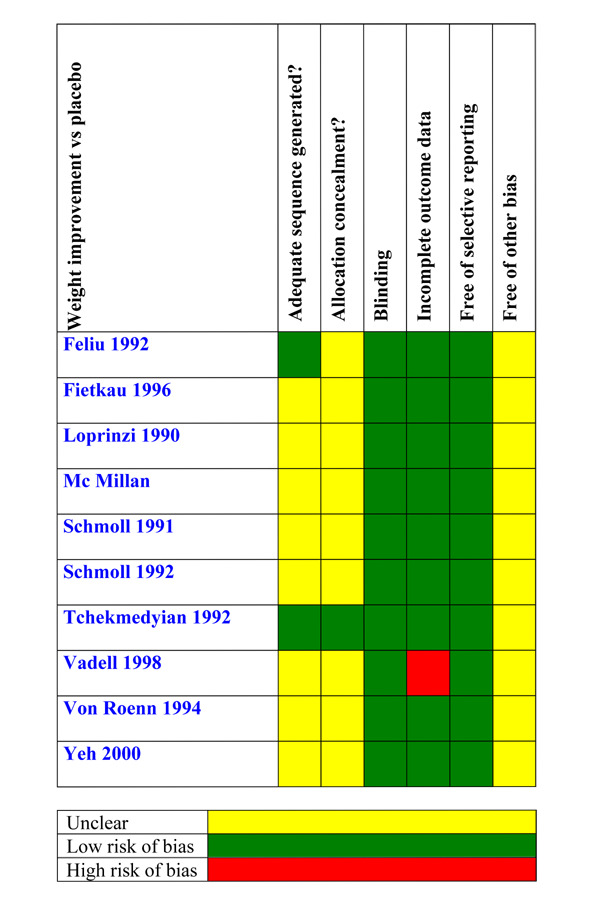
Risk of bias in included studies
We assessed the methodological quality of the included studies using the Oxford Quality Scale (Jadad 1996). The review authors scored each report independently for quality using the three‐item scale described in the Methods section above and agreed a 'consensus' score. The scores for methodological quality are shown in Characteristics of included studies .
Eighteen trials (51%) scored three or more out of a maximum of five: Beller 1997; De Conno 1998; Eubanks 2002; Feliu 1992; Fietkau 1996; Herrejon 2011; Jatoi 2002; Jatoi 2004; Loprinzi 1990b; McMillan 1994; Mwamburi 2004; Oster 1994; Tchekmedyian 1992; Timpone 1997; Vadell 1998; Wanke 2007; Weisberg 2002; Yeh 2000.
Seventeen trials 49% achieved a low score (two points or lower): Batterham 2001; Casado 2008; Gambardella 1998; Gebbia 1996; Giacosa 1997; Heckmayr 1992; Lesser 2006; Loprinzi 1994; Loprinzi 1999a; Macbeth 1994; Madeddu 2012; Sancho‐Cuesta 1993; Schmoll 1991; Schmoll 1992; Summerbell 1992; Ulutin 2002; Von Roenn 1994.
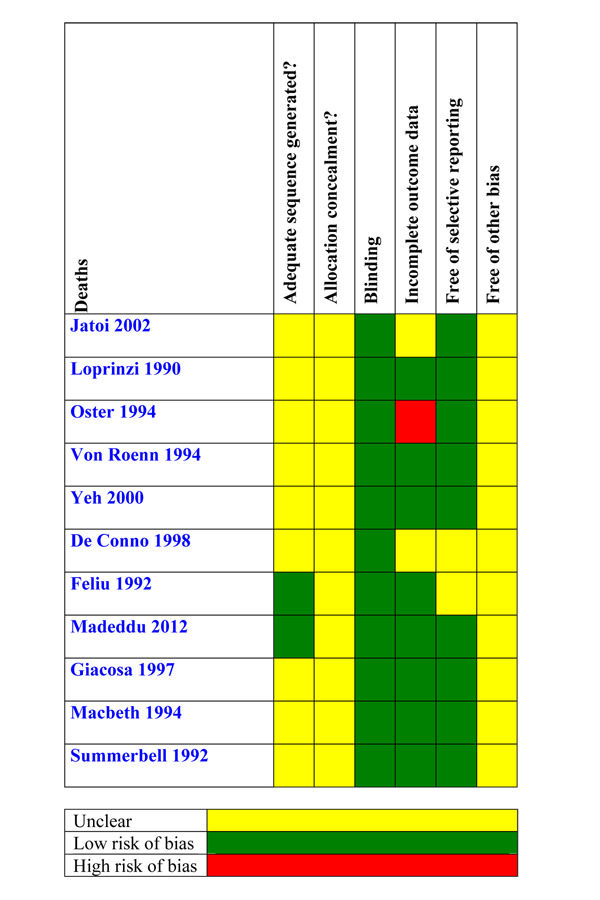
The scores of risk of bias are shown in Figure 2
2.
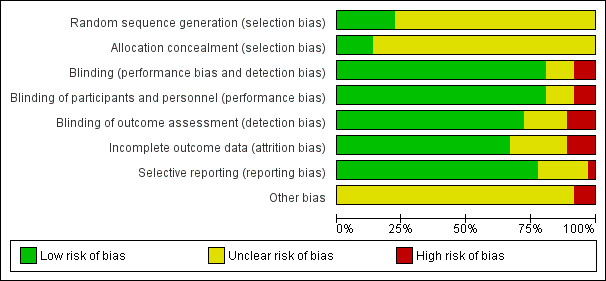
Risk of bias
Allocation
Beller 1997; Herrejon 2011; Tchekmedyian 1992; Timpone 1997 and Wanke 2007 adequately described the methods used to ensure that allocation of participants to treatment groups was concealed. The remaining studies did not report the method used.
Blinding
Eleven studies were not blinded: Batterham 2001; Casado 2008; Gebbia 1996; Giacosa 1997; Heckmayr 1992; Lesser 2006; Loprinzi 1999a; Loprinzi 1999b; Macbeth 1994;Madeddu 2012; Ulutin 2002; Wanke 2007.
Ten more studies were described as blinded but did not describe the methods used to ensure that participants and interacting investigators were unable to differentiate between the treatment and control tablets: Beller 1997; De Conno 1998; Fietkau 1996; Gambardella 1998; Loprinzi 1994; McMillan 1994; Tchekmedyian 1992; Von Roenn 1994; Weisberg 2002; Yeh 2000.
The remaining seven studies were blinded and provided adequate information: Eubanks 2002; Herrejon 2011; Jatoi 2002; Jatoi 2004; Loprinzi 1990b; Oster 1994; Vadell 1998.
We have rated trials that were not blinded as follows: when the main outcome was weight, we decided that this outcome was not likely to the influenced for patients or researchers, so we rated the risk of bias as 'low'. When the main outcome was appetite, we decided that this could be influenced by patients and researchers, and we rated risk of bias as 'high'.
Incomplete outcome data
In Schmoll 1992, withdrawals were higher in the placebo group (44%) than in both MA groups (30%) and explanations were not provided. In Vadell 1998, the rate of withdrawals was very high (only 64 out of 152 initial patients remained in the study after 12 weeks). In both cases we rated risk of bias as 'high'. We rated the remaining studies as low risk, either because of lack of drop‐outs or losses in the follow‐up or because the number of drop‐outs was low and equitably balanced between intervention groups.
Selective reporting
The protocols for the studies were not available (except for Herrejon 2011), which we rated low risk of bias. In view of the fact that the authors only reported data at 12 weeks and not at 24 weeks we rated this a high risk bias in Batterham 2001. We rated the rest of the studies as unclear risk of bias because all the predefined outcomes were available.
Other potential sources of bias
Studies with small group sizes and poor quality (allocation sequence, concealment of allocation or adequate blinding) tend to overestimate efficacy (Kjaergard 2001; Nüesch 2010). In this review, 18 out of 34 trials had a sample size of less than 100 and poor quality; in particular the following: Batterham 2001 (15 patients); De Conno 1998 (48 patients); Eubanks 2002 (17 patients); Fietkau 1996 (61 patients); Gambardella 1998 (30 patients); Giacosa 1997 (28 patients); Heckmayr 1992 (66 patients); Lesser 2006 (74 patients); Madeddu 2012 (60 patients); Macbeth 1994 (75 patients); McMillan 1994 (38 patients); Mwamburi 2004 (40 patients); Schmoll 1991 (55 patients); Schmoll 1992 (91 patients); Summerbell 1992 (14 patients); Timpone 1997 (50 patients); Wanke 2007 (63 patients); and Yeh 2000 (69 patients).
Additionally, we rated three trials as high risk of bias: Macbeth 1994 (stopped early for safety); Summerbell 1992 (discontinued because the recruitment was too slow) and Lesser 2006 (we only have a conference proceeding dated 2006; we have not found any paper with all the relevant data for this trial).
Effects of interventions
See: Table 1
We meta‐analysed data from the included studies in three groups.
Megestrol acetate (MA) versus placebo
MA versus other active drug treatments
MA at different doses
We further categorised the studies as follows.
Patients with cancer
Patients with AIDS
Patients with other underlying pathologies
We used risk ratio (RR) to assess quality of life, weight and appetite and used mean difference (MD) for weight and appetite gain as continuous variables. When quality of life was described as a continuous variable we used standardised mean difference (SMD) because this item was reported using different scales (Karnofsky Index, linear analogue self assessment, etc.).
Megestrol acetate versus placebo
Weight gain
The overall results show weight improvement for patients treated with MA (RR 1.51, 95% CI 1.08 to 2.11) (Analysis 1.3). Eight trials were studied. The result for the subcategory of cancer patients was RR 1.55 (95% CI 1.06 to 2.26) (Analysis 1.3). One trial was found for each of the subcategories AIDS and other underlying pathologies. No overall results for these subcategories could be achieved. The quality of the trials for this outcome is shown in Figure 3.
1.3. Analysis.

Comparison 1 Megestrol acetate versus placebo (ITT), Outcome 3 Weight improvement.
3.
For weight gain, the overall results show an improvement for patients treated with MA (MD 1.93, 95% CI 0.95 to 2.91) (Analysis 1.4). Both the subcategories cancer patients and patients with other underlying pathologies show improvement (MD 1.63, 95% CI 0.87 to 2.38 and MD 1.47, 95% CI 0.06 to 2.87, respectively) (Analysis 1.4).
1.4. Analysis.
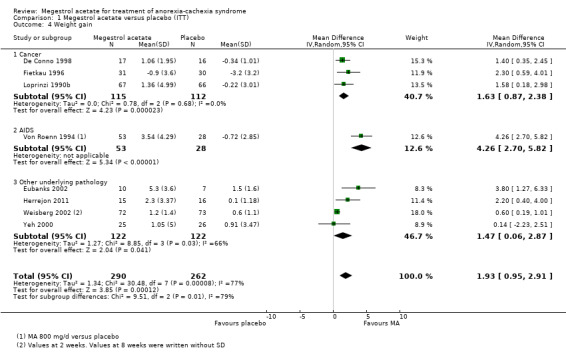
Comparison 1 Megestrol acetate versus placebo (ITT), Outcome 4 Weight gain.
We explored heterogeneity between the trials using the Chi2 test, with a 10% level of significance, and the I2 statistic. When we explored weight improvement in the MA versus placebo comparison, we obtained an I2 of 66 %. We applied the recommendations in the Cochrane Handbook for Systematic Reviews of Interventions, which suggest that an I2 value more than 60% may represent high heterogeneity (Deeks 2008). When we analysed data without the trials of Weisberg 2002; Yeh 2000 the I2 became 2%. Those two trials with patients with COPD and geriatric cachexia could be quite different from the overall and could explain heterogeneity.
Quality of life
The overall results show improvement in quality of life for patients treated with MA (RR 1.78, 95% CI 1.09 to 2.92) (Analysis 1.5). The overall results for the cancer and AIDS patients subcategories were RR 1.91 (95% CI 1.02 to 3.59) and RR 1.49 (95% CI 0.47 to 4.69), respectively (Analysis 1.5). However, quality of life as a continuous variable shows no improvement (SMD 0.50, 95% CI ‐0.13 to 1.13) (Analysis 1.6).
1.5. Analysis.
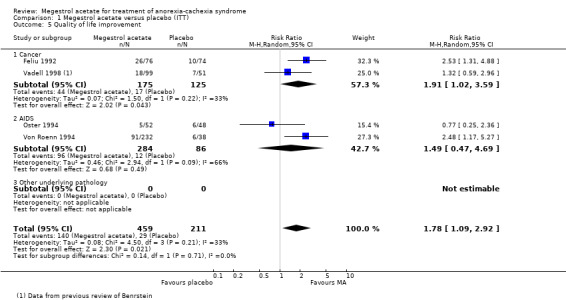
Comparison 1 Megestrol acetate versus placebo (ITT), Outcome 5 Quality of life improvement.
1.6. Analysis.
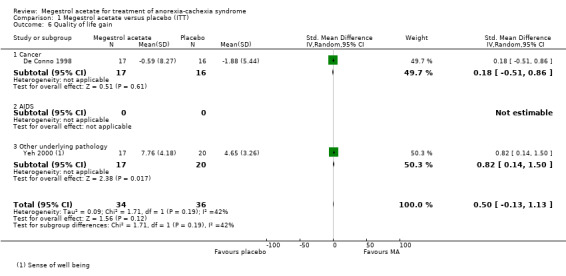
Comparison 1 Megestrol acetate versus placebo (ITT), Outcome 6 Quality of life gain.
Appetite
The overall results show appetite improvement for patients treated with MA (RR 2.19, 95% confidence interval (CI) 1.41 to 3.40)) (Analysis 1.1). The only subcategory that could be analysed was cancer patients and appetite improvement was detected (RR 2.57, 95% CI 1.48 to 4.49). We could not analyse the subcategories of AIDS patients and patients with other underlying pathologies because there was only one trial including AIDS patients. The quality of trials for this outcome is shown in Figure 4.
1.1. Analysis.

Comparison 1 Megestrol acetate versus placebo (ITT), Outcome 1 Appetite improvement.
4.

For appetite gain, we did not find trials with patients with cancer or AIDS and only one subcategory could be analysed. There were patients with other underlying pathologies, namely chronic obstructive pulmonary disease (COPD) and geriatric cachexia (Herrejon 2011; Yeh 2000). The overall results show an improvement for patients treated with MA (SMD 0.91, 95% CI 0.43 to 1.39) (Analysis 1.2)
1.2. Analysis.

Comparison 1 Megestrol acetate versus placebo (ITT), Outcome 2 Appetite gain.
Anthropometric values
Seven studies showed results for triceps skinfold thickness (TST). Only four of them had results which were statistically significant (Herrejon 2011; Vadell 1998; Von Roenn 1994; Weisberg 2002) and three did not show statistical significance (Beller 1997; Fietkau 1996; Tchekmedyian 1992; )
Two studies showed results for mid‐arm circumference (MAC). Only one had results which were statistically significant (Eubanks 2002) and (Tchekmedyian 1992)did not show statistical significance.
In Beller 1997 the average difference in TST in mm between baseline and subsequent weeks was ‐0.28, ‐0.70 and +0.15 (P = 0.72) for placebo, lower doses of MA and higher doses of MA, respectively.
In Eubanks 2002 TST and MAC measurements were also increased compared with baseline for the entire MA‐treated group at two, three and six months (P < 0.001 at all time points).
In Fietkau 1996, “There was no decrease or even a slight increase in the thickness of the triceps skinfold in MA group compared with a continuous decrease in the control group" and "No differences in upper arm muscle circumferences were observed between the groups”.
In Herrejon 2011 the mean differences in TST at eight weeks were 0.8 versus ‐0.1 (P = 0.003) for the MA and placebo group, respectively.
In Vadell 1998 a significant increase in TST was noted in patients receiving higher doses of MA after the second month of treatment.
In Von Roenn 1994a “MA treatment presented the decrease of TST in patients receiving placebo and resulted in an increase in all doses tested”.
In Weisberg 2002 the mean TST values in the MA group increased significantly when compared to the placebo group: 1.35 ± 2.38 (n = 72) versus 0.13 ± 2.24 (n = 73). Only Weisberg’s trial described mean difference and standard deviation (SD)
In Tchekmedyian 1992 there were no significant changes in MAC or TST in either group at one month.
Megestrol acetate versus other drugs
We found seven trials in this group: Loprinzi 1999a; Loprinzi 1999b; Jatoi 2002; Jatoi 2004 in the subcategory of cancer and Batterham 2001; Mwamburi 2004; Summerbell 1992; Timpone 1997 in the subcategory of AIDS. Loprinzi 1999 (Loprinzi 1999a; Loprinzi 1999b) compared MA to fluoxymesterone and dexamethasone, respectively. The analysis of Loprinzi 1999 was carried out by dividing the total number of placebo patients by two. In other words, the number of placebo patients in each comparison was taken to be 79 instead of 158
Weight gain
The overall results show weight improvement (RR 1.66, 95% CI 1.09 to 2.52) (Analysis 2.3). Three studies in the subcategory of cancer patients (Jatoi 2002; Jatoi 2004; Loprinzi 1999a; Loprinzi 1999b) and two in the subcategory of AIDS patients (Mwamburi 2004; Summerbell 1992) were considered.
2.3. Analysis.

Comparison 2 Megestrol acetate versus other drugs (ITT), Outcome 3 Weight improvement.
The overall results for the outcome weight gain show improvement (MD 2.50, 95% CI 0.37 to 4.64) (Analysis 2.4). However, the overall results for each subcategory show no weight gain either in cancer or in AIDS patients (MD 0.61, 95% CI ‐0.15 to 1.38 and MD 4.85, 95% CI ‐0.79 to 10.49, respectively) (Analysis 2.4).
2.4. Analysis.

Comparison 2 Megestrol acetate versus other drugs (ITT), Outcome 4 Weight gain.
Quality of life
Two trials (Jatoi 2002; Loprinzi 1999a) included in the analysis measured health‐related quality of life as an outcome using different instruments. Quality of life did not show any benefit (RR 1.05, 95% CI 0.77 to 1.44 and SMD 0.20, 95% CI ‐0.02 to 0.43, respectively).
Appetite
When we looked at the overall results, MA did not show benefits in terms of appetite improvement in comparison with other drugs in any category (RR 1.03, 95% CI 0.64 to 1.67) (Analysis 2.1). The only trial available in this analysis was Loprinzi 1999.
2.1. Analysis.
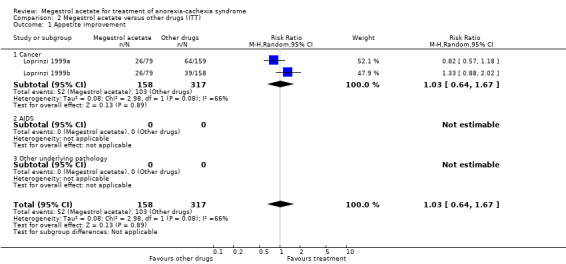
Comparison 2 Megestrol acetate versus other drugs (ITT), Outcome 1 Appetite improvement.
Appetite gain as a continuous variable could only be analysed in one trial (Batterham 2001) and shows lack of efficacy (MD 1.60, 95% CI ‐1.28 to 4.48) (Analysis 2.2).
2.2. Analysis.
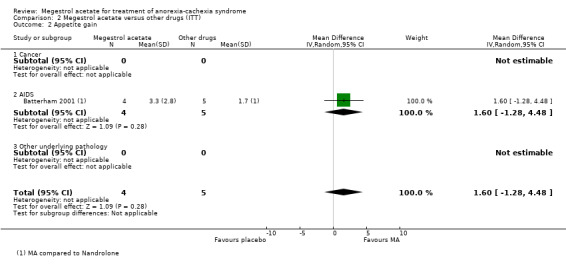
Comparison 2 Megestrol acetate versus other drugs (ITT), Outcome 2 Appetite gain.
The quality of trials for the outcomes appetite and weight improvement is shown in Figure 3 and Figure 5.
5.
Anthropometric values
In Macbeth 1994 there was no evidence of statistical significance in the median change in TST at 12 weeks in either group.
Different dose levels of megestrol acetate
We analysed low doses versus high doses of megestrol. However, the definitions of low dose and high dose were according to those used in each trial. Accordingly, in some trials (such as Beller 1997) low doses of MA were described as 160 mg and high doses as 480 mg; while in Wanke 2007 low doses were defined as 575 mg and high doses as 800 mg.
Weight gain
The overall results show weight improvement with high doses versus low doses (RR 0.77, 95% CI 0.64 to 0.93) (Gebbia 1996; Heckmayr 1992; Loprinzi 1994; Sancho‐Cuesta 1993; Schmoll 1992; Ulutin 2002) (Analysis 3.2). All these trials were in the subcategory of cancer patients. When we analysed 160 mg of MA versus higher doses, the results remained unchanged, i.e. higher doses showed weight improvement (RR 0.72, 95% CI 0.52 to 0.99) (Analysis 3.3).
3.2. Analysis.

Comparison 3 Megestrol acetate versus megestrol acetate (ITT), Outcome 2 Weight improvement.
3.3. Analysis.
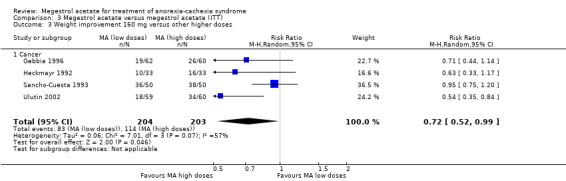
Comparison 3 Megestrol acetate versus megestrol acetate (ITT), Outcome 3 Weight improvement 160 mg versus other higher doses.
Only two trials were found for the outcome weight gain as a continuous variable and demonstrated no statistical significance (MD ‐0.94, 95% CI ‐3.33 to 1.45); both were in the subcategory of AIDS patients (Analysis 3.4).
3.4. Analysis.

Comparison 3 Megestrol acetate versus megestrol acetate (ITT), Outcome 4 Weight gain.
Quality of life
Two studies included in this analysis (Von Roenn 1994; Wanke 2007) measured health‐related quality of life as an outcome using different instruments. Quality of life did not show any benefit related to dose (RR 0.81, 95% CI 0.58 to 1.11and SMD 0.26, 95% CI ‐0.23 to 0.76) (Analysis 3.5; Analysis 3.6).
3.5. Analysis.
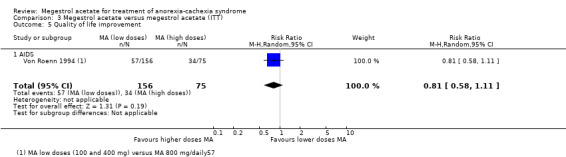
Comparison 3 Megestrol acetate versus megestrol acetate (ITT), Outcome 5 Quality of life improvement.
3.6. Analysis.

Comparison 3 Megestrol acetate versus megestrol acetate (ITT), Outcome 6 Quality of life gain.
Appetite
The overall results show no differences in appetite improvement between doses (high and low doses) (Gebbia 1996; Schmoll 1992; Ulutin 2002). All trials were in the subcategory of cancer patients.
Anthropometric values
In Wanke 2007 there were no significant changes in TST or MAC in either group.
Safety
More than 40 adverse events were studied, categorised into more and less than 800 mg of MA.
Fifteen trials reported 'any adverse events' and show an increase in the risk of suffering some of them, independent of dose (RR 1.20, 95% CI 1.07 to 1.36) (Analysis 4.3). All studies except Jatoi 2002 are shown in the forest plot because this study had more 'any adverse events' in both arms than there were patients: 186/159 and 155/152 in the MA and placebo arm respectively. Therefore, 458 'any adverse events' were detected in 830 patients in the MA arm and 358 in 722 patients in the control arm. However, the overall results were the same.
4.3. Analysis.
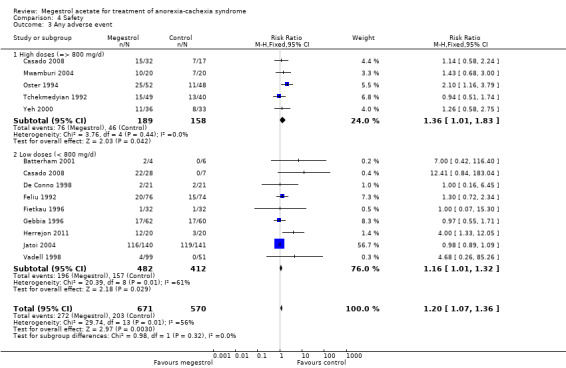
Comparison 4 Safety, Outcome 3 Any adverse event.
The numbers of serious adverse events (SAE) were reported in four trials, but without further information. In these cases, SAEs seemed not to be related to MA (RR 2.10, 95% CI 0.98 to 4.47) (Analysis 4.2). Lower doses seemed to produce more SAEs (RR 4.65, 95% CI 1.33 to 16.29).
4.2. Analysis.
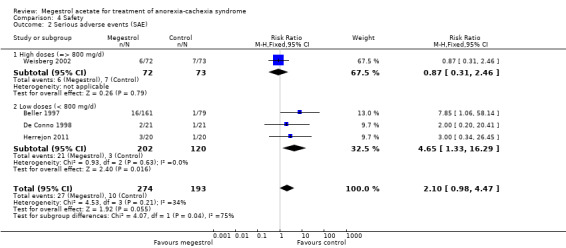
Comparison 4 Safety, Outcome 2 Serious adverse events (SAE).
Dyspnoea was reported in eight trials and was related to MA (RR 2.23, 95% CI 1.01 to 4.93) (Analysis 4.11). Lower doses seemed to produce more dyspnoea (RR 2.80, 95% CI 1.02 to 7.67).
4.11. Analysis.

Comparison 4 Safety, Outcome 11 Dyspnoea.
Deaths were reported in 11 trials and MA seemed to produce more deaths (RR 1.42, 95% CI 1.04 to 1.94) (Analysis 4.13). Higher doses seemed to produce more deaths (RR 1.66, 95% CI 1.08 to 2.57).
4.13. Analysis.
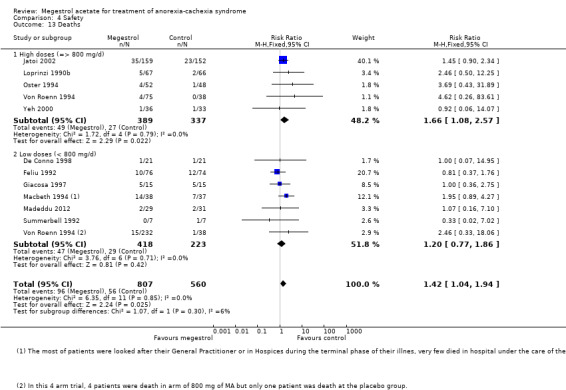
Comparison 4 Safety, Outcome 13 Deaths.
Oedema was reported in 15 trials and could be related to MA (RR 1.36, 95% CI 1.07 to 1.72) (Analysis 4.31). Higher doses seemed to produce more oedema (RR 1.37, 95% CI 1.04 to 1.81).
4.31. Analysis.

Comparison 4 Safety, Outcome 31 Oedema.
Impotence was reported in 13 trials and MA produced more impotence than placebo or other drugs (RR 2.58, 95% CI 1.78 to 3.75) (Analysis 4.24). Both lower and higher doses were related to this adverse event (RR 2.89, 95% CI 1.33 to 6.26 and RR 2.49, 95% CI 1.63 to 3.81, respectively).
4.24. Analysis.
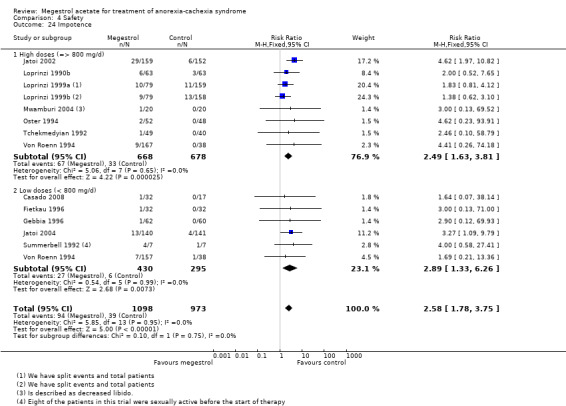
Comparison 4 Safety, Outcome 24 Impotence.
Nausea and vomiting were reported in 12 trials and MA produced less nausea and vomiting (RR 0.58, 95% CI 0.45 to 0.74) (Analysis 4.29). Both lower and higher doses were related to this adverse event (RR 0.51, 95% CI 0.37 to 0.72 and RR 0.68, 95% CI 0.46 to 1.00, respectively).
4.29. Analysis.
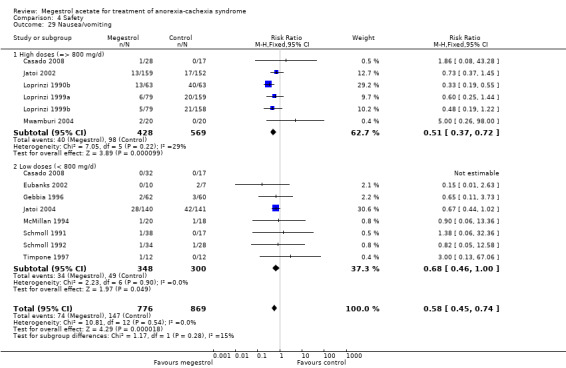
Comparison 4 Safety, Outcome 29 Nausea/vomiting.
Thromboembolic phenomena including thrombophlebitis were reported in 11 trials and MA produced an overall increased risk (RR 1.84, 95% CI 1.07 to 3.18) (Analysis 4.42). However, neither higher doses nor lower doses showed statistical significance (RR 2.35, 95% CI 0.93 to 5.94 and RR 1.62, 95% CI 0.82 to 3.18, respectively).
4.42. Analysis.
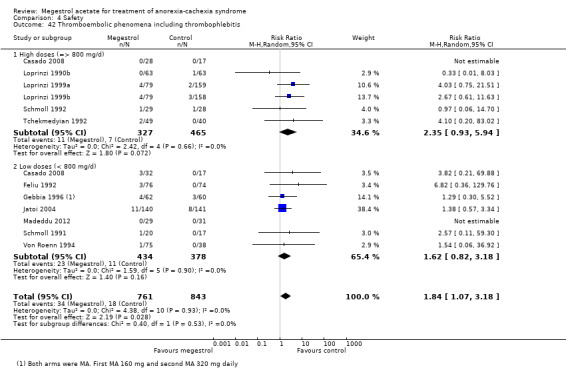
Comparison 4 Safety, Outcome 42 Thromboembolic phenomena including thrombophlebitis.
Sixteen trials described withdrawals (RR 0.94, 95% CI 0.83 to 1.06) (Analysis 4.44). Neither higher doses nor low doses showed statistical significance in the MA group versus the placebo group (RR 0.92, 95% CI 0.80 to 1.06 and RR 0.98, 95% CI 0.75 to 1.28, respectively).
4.44. Analysis.
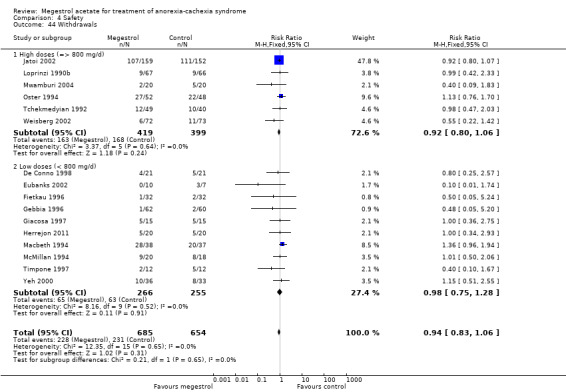
Comparison 4 Safety, Outcome 44 Withdrawals.
The quality of trials for the outcome of death is shown in Figure 6.
6.
Sensitivity analysis
This 2013 update of the review does not show any change with regard to the sensitivity analyses from the previous review (2006).
We undertook sensitivity analysis with trials where patients received more than 12 weeks of MA versus any drugs or placebo for any condition (cancer patients, AIDS, other underlying pathology). We analysed three outcomes: appetite improvement, weight improvement and weight gain.
One trial studied appetite at six weeks and did not show an increase in appetite compared to more than six weeks (Analysis 5.1). Appetite did not change with treatment for less or more than 12 weeks (RR 1.80, 95% CI 1.06 to 3.04 and RR 1.56, 95% CI 1.13 to 2.16, respectively) (Analysis 5.2).
5.1. Analysis.

Comparison 5 Sensitivity analyses, Outcome 1 Appetite improvement treatment duration 6 weeks.
5.2. Analysis.

Comparison 5 Sensitivity analyses, Outcome 2 Appetite improvement treatment duration 12 weeks.
No differences were shown for weight improvement with less or more than 12 weeks of treatment (RR 1.40, 95% CI 0.90 to 2.18 and RR 1.46, 95% CI 0.92 to 2.31, respectively) (Analysis 5.6).
5.6. Analysis.
Comparison 5 Sensitivity analyses, Outcome 6 Weight improvement 12 weeks.
Weight gain was related to treatment duration of less of 12 weeks, but not to more than 12 weeks (MD 1.96 , 95% CI 1.06 to 2.87 and MD 1.94, 95% CI ‐1.64 to 5.53, respectively) (Analysis 5.8).
5.8. Analysis.
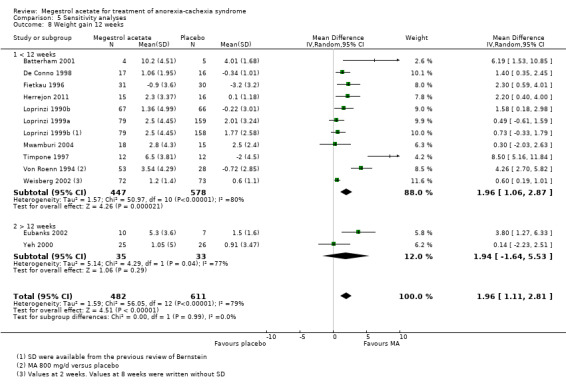
Comparison 5 Sensitivity analyses, Outcome 8 Weight gain 12 weeks.
Although appetite is a subjective perception and could be related to blinding, we did not detect this association; on the contrary, we found that only blinded trials showed an increase in appetite (RR 1.96, 95% CI 1.17 to 3.27 and RR 1.53, 95% CI 0.82 to 2.87 for blinded and open‐label trials, respectively) (Analysis 5.9).
5.9. Analysis.
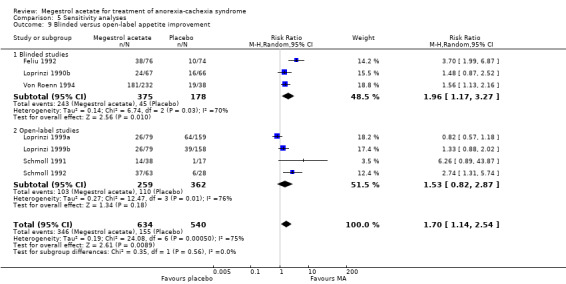
Comparison 5 Sensitivity analyses, Outcome 9 Blinded versus open‐label appetite improvement.
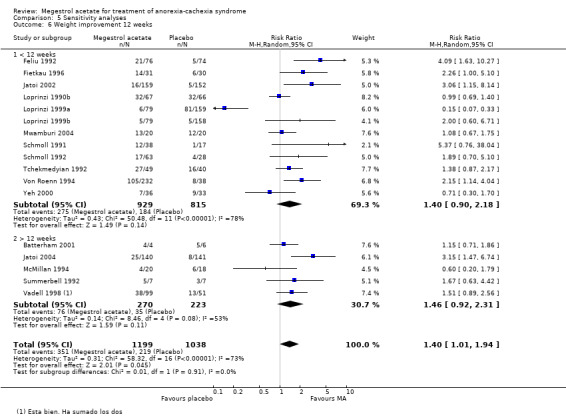
Weight improvement only showed benefit in blinded trials (RR 1.63, 95% CI 1.15 to 2.32 and RR 1.14, 95% CI 0.53 to 2.47 for blinded and open‐label trials, respectively) (Analysis 5.11).
5.11. Analysis.
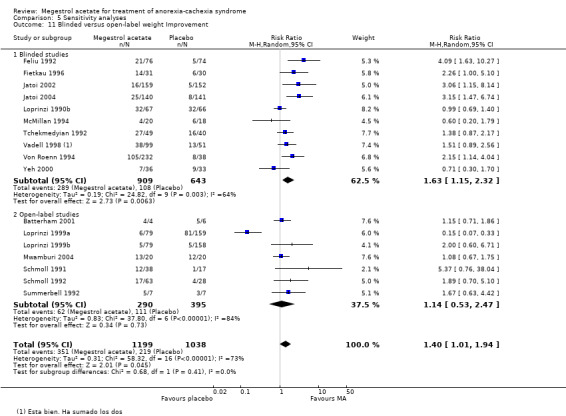
Comparison 5 Sensitivity analyses, Outcome 11 Blinded versus open‐label weight Improvement.
We also analysed according to a more broad definition of quality, using the Jadad scale of high quality (3 to 5 points) or low quality (0 to 2 points). Appetite was not related to quality (high quality RR 2.31, 95% CI 0.93 to 5.72 and low quality RR 1.47, 95% CI 0.96 to 2.27) (Analysis 5.13). Weight improvement was not related to quality (high quality RR 1.50, 95% CI 1.07 to 2.10 and low quality RR 1.60, 95% CI 1.17 to 2.20) (Analysis 5.14). When we analysed weight gain according to quality, both the categories of high and low quality were favourable to MA (MD 1.90, 95% CI 0.89 to 2.91 and MD 2.30, 95% CI 0.25 to 4.35) (Analysis 5.15).
5.13. Analysis.
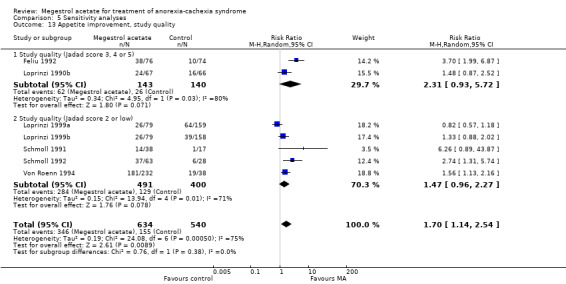
Comparison 5 Sensitivity analyses, Outcome 13 Appetite improvement, study quality.
5.14. Analysis.
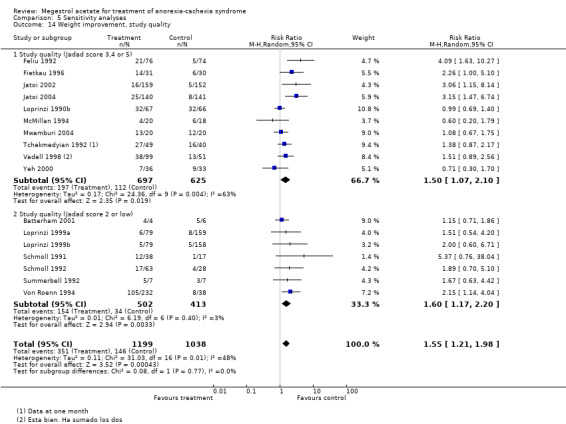
Comparison 5 Sensitivity analyses, Outcome 14 Weight improvement, study quality.
5.15. Analysis.
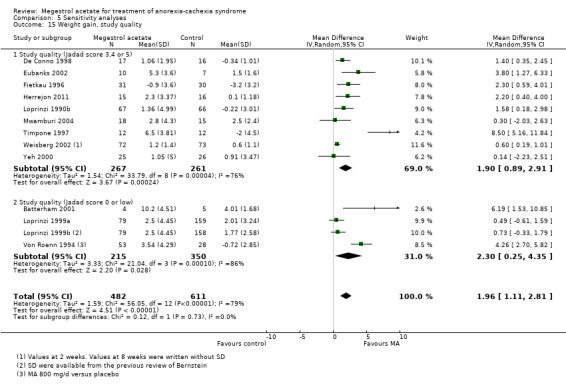
Comparison 5 Sensitivity analyses, Outcome 15 Weight gain, study quality.
We also analysed whether the number of patients in the trials could be related to results for the main outcomes. We analysed two groups with more and fewer than 100 patients. Neither appetite nor weight improvement were related (Analysis 5.19 and Analysis 5.12, respectively). However, weight gain in studies with fewer than 100 patients showed a MD of 3.45 (95% CI 0.82 to 6.08) and a MD of 1.13 (95% CI 0.59 to 1.68) with more than 100 patients (Analysis 5.20). Consequently, small trial size may be related to weight gain.
5.19. Analysis.

Comparison 5 Sensitivity analyses, Outcome 19 Sensitivity number of patients in trial appetite improvement.
5.12. Analysis.

Comparison 5 Sensitivity analyses, Outcome 12 Sensitivity number patients weight improvement.
5.20. Analysis.
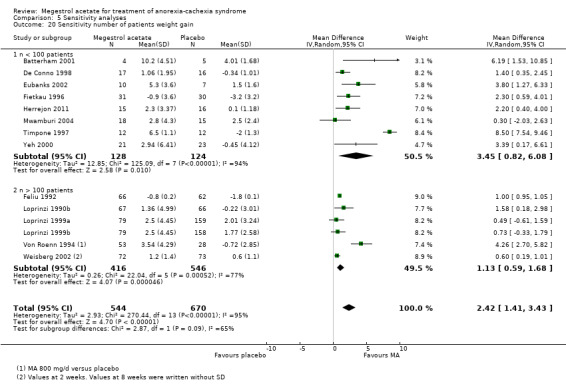
Comparison 5 Sensitivity analyses, Outcome 20 Sensitivity number of patients weight gain.
We explored the duration of trials with oedema as an adverse event. This seemed to be related to trials of shorter duration: one to four weeks (RR 1.81, 95% CI 1.07 to 3.08), five to eight weeks (RR 1.43, 95% CI 1.04 to 1.97) versus 9 to 12 weeks (RR 1.10, 95% CI 0.82 to 1.46) (Analysis 5.16). When we explored trials with thromboembolic phenomena the shortest trials, with less than 12 weeks of follow‐up, showed a RR of 2.59(95% CI 1.16 to 5.76) whereas trials with follow‐up of 12 or more weeks did not show statistical significance (RR 1.45, 95% CI 0.71 to 2.94) (Analysis 5.17).
5.16. Analysis.
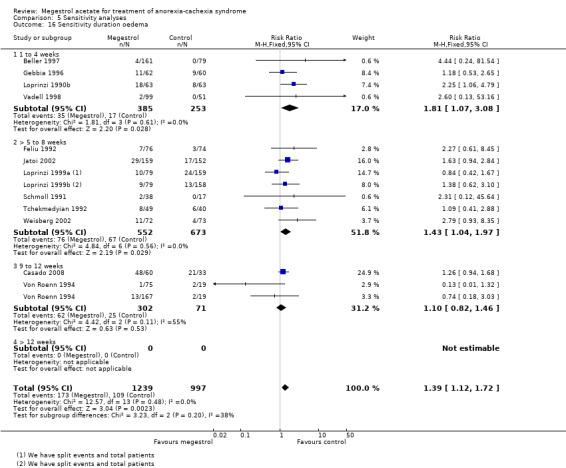
Comparison 5 Sensitivity analyses, Outcome 16 Sensitivity duration oedema.
5.17. Analysis.
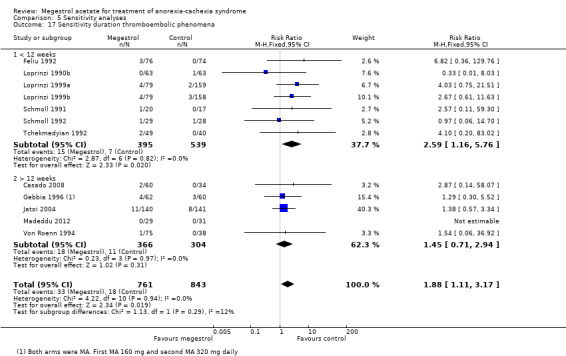
Comparison 5 Sensitivity analyses, Outcome 17 Sensitivity duration thromboembolic phenomena.
We carried out two sensitivity analyses to study death. In the first one, we explored duration of exposure to MA and this suggested a link (Analysis 5.25). When deaths and pathology were explored, the association was not significant, but cancer and AIDS patients were more likely to suffer death as an adverse event (Analysis 5.26). The explanation could be thromboembolic phenomena, although pulmonary embolism was not detected in the trials (only two trials reported this). It is known that pulmonary embolism is frequently unreported in 'real life'. We need to emphasise that the mortality results are sensitive to the trial of Jatoi 2002, so this result needs to be interpreted with caution.
5.25. Analysis.
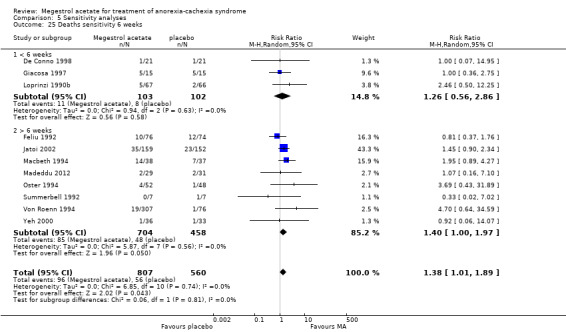
Comparison 5 Sensitivity analyses, Outcome 25 Deaths sensitivity 6 weeks.
5.26. Analysis.
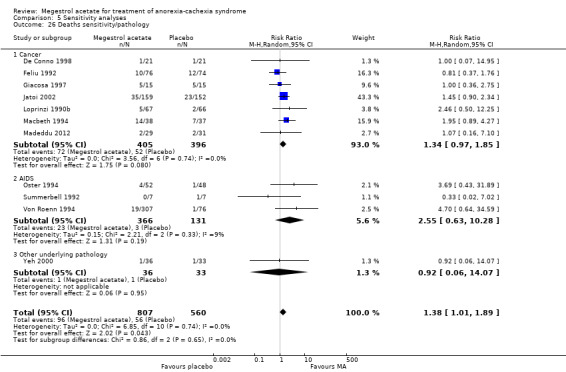
Comparison 5 Sensitivity analyses, Outcome 26 Deaths sensitivity/pathology.
Discussion
Summary of main results
The aim of the present update of the review was to assess the efficacy, effectiveness and safety of megestrol acetate (MA) for the management of anorexia‐cachexia syndrome, a common clinical problem that substantially impacts upon the quality of life and survival of affected patients.
Our search strategy allowed us to identify all relevant studies. We tried to include more data by requesting this from authors but unfortunately very few new data were introduced in this update.
Our systematic review suggests that patients with cachexia‐anorexia syndrome treated with MA improve their weight and appetite (mean difference (MD) for weight gain 1.96 kg (95% confidence interval (CI) 1.11 kg to 2.81 kg) (Analysis 5.15); risk ratio (RR) for appetite improvement for any condition at six or more weeks of follow‐up 1.70 (95% CI 1.14 to 2.54) (Analysis 5.1)). This overall result was obtained from trials with a duration of 14 to 180 days. Most of the trials had a follow‐up of around 56 to 84 days.
Appetite and weight improvement was seen in the subcategories of cancer and AIDS patients when comparing MA with placebo. When MA was compared with other drugs, weight improvement was only seen in cancer patients. Quality of life improvement was seen in both subcategories of cancer and AIDS, when comparing MA‐treated patients with placebo, but not against other drugs. However, no clear benefits were detected for quality of life gain (standardised mean difference (SMD) 0.32, 95% CI ‐0.02 to 0.65).
More adverse events were related to MA than placebo ('any adverse event') (RR 1.20, 95% CI 1.07 to 1.36). Serious adverse events were related to lower doses (< 800 mg/day RR 4.65, 95% CI 1.33 to 16.29). Dyspnoea seemed to be related to lower doses of MA (RR 2.23, 95% CI 1.01 to 4.93). Oedema and thromboembolic phenomena were common adverse events (RR 1.36, 95% CI 1.07 to 1.72 and RR 1.91, 95% CI 1.13 to 3.23, respectively). Deaths seemed to be increased (RR 1.43, 95% CI 1.05 to 1.96), especially with higher doses (RR 1.66, 95% CI 1.08 to 2.57). We could not pool data for anthropometrics values, but all results from the included trials are shown in Effects of interventions.
Overall completeness and applicability of evidence
All the planned outcomes have been analysed. Unfortunately, a large proportion of data available in the included trials could not be pooled because the authors did not provide enough information or data were not complete. This review has focused on the patients that were selected in the initial design of the review. Cancer and AIDS patients were the most common disease categories; the elderly and patients with chronic obstructive pulmonary disease (COPD) were new subcategories included in this review.
The mortality associated with cachexia‐anorexia syndrome was high and the review failed to show any improvement with MA; in fact mortality was increased. This conclusion should be taken with caution, however, because the severity of illness in these patients is high and they have a high risk of death. Increased death was related only to higher doses in all trials except Yeh 2000. It must also be stressed that these results are sensitive to the removal of the trial with most weight (Jatoi 2002) (RR 2.69, 95% CI 0.93 to 7.78), so must be taken with caution. However, none of the trials included in the review were designed to investigate mortality as primary endpoint and duration of follow‐up was very short in most, so this unexpected result requires serious additional research in the form of clinical trials with longer follow‐up and survival as a main outcome.
Most trials defined weight loss as a loss of more than 5% of previous weight. Appetite and weight gain showed benefits, however, in most of the trials this weight gain did not result in the recovery of the initial weight. In particular, the benefits of weight gain compared with placebo were in the range of 2 kg. The likelihood of oedema and thromboembolic phenomena means that patients should be informed of these adverse events.
The included trials did not have long‐term follow‐up. Since MA can be prescribed for several months in the treatment of cachexia‐anorexia syndrome, adverse events could be more relevant than those described in the present review.
Quality of the evidence
The main results are shown in Table 1 and we rated the quality from low to high using the GRADE system. We have calculated numbers needed to treat for an additional beneficial outcome (NNTB) from the risk ratio according to the formula NNT or NNH = 1/ACR*(1‐RR), where ACR = assumed control risk and RR = risk ratio.
Appetite improvement versus placebo (Figure 4). There is an improvement in appetite but the quality of the evidence is downgraded to very low because the risk bias for sequence generation was low only in Feliu 1992. Moreover, allocation concealment was unclear in all trials and in three out of five trials we rated the outcome appetite as high risk of bias because it could be sensitive to lack of blinding. The statistical test for heterogeneity was moderate (P < 0.04 and I2 = 59%; NNTB = 4, 95% CI 2 to 11). Doses of MA compared with placebo were very different, ranging from 160 mg to 960 mg in each subgroup.
Weight improvement versus placebo (Figure 3). We rated eight out of 10 trials as unclear regarding adequate sequence generation; we rated only one trial as low risk for allocation concealment. We rated all studies as low risk of bias for blinding. We rated Schmoll 1991; Schmoll 1992 and Von Roenn 1994 as low risk because lack of blinding is not related to weight. We rated only one study as high risk of bias due to incomplete outcome data addressed. We rated all trials as unclear with respect to 'other bias'. The results were quite similar and CI values overlapped for most of the trials. However, two studies (Feliu 1992; Schmoll 1991) showed higher effects and the CI was quite wide. The statistical test for heterogeneity was moderate (P = 0.02 and I2 = 53%). The quality of the evidence is very low and the NNTB = 12 (95% CI 6 to 69).
Appetite improvement versus other drugs (Figure not shown). Only one trial showed improvement but there was an unclear risk of bias for sequence generation and allocation concealment and a high risk of bias for blinding. The quality of the evidence was low and the NNTB was not statistically significant.
Weight improvement versus other drugs (Figure 5). We rated all studies except Mwamburi 2004 as unclear risk of bias for adequate sequence generation and allocation concealment. The statistical test for heterogeneity was moderate (P = 0.05 and I2 = 51%). The CI values overlapped for most of the studies. Cancer patients showed a better response in terms of weight. The quality of the evidence was very low and the NNTB = 22 (95% CI 9 to 159).
Deaths (Figure 6). We rated only two trials out of 11 as low risk of bias for adequate sequence generation and blinding. Allocation concealment was unclear in all trials. The CI values did not overlap. There was no large variation in the effect. The statistical test for heterogeneity was low (P < 0.05 and I2 = 0%). Follow‐up for this outcome was very short (up to 15 weeks) and we cannot disregard the possibility that in 'real life' very sick patients taking MA for a longer time, the number of deaths could increase. The quality of the evidence was very low and the number needed to treat for an additional harmful outcome (NNTH) = 23 (95% CI 10 to 200).
Thromboembolic phenomena (Figure not shown). We rated adequate sequence generation as low risk in three out of 10 trials, and rated allocation concealment as low risk only in two out of 10 trials. The statistical test for heterogeneity was low (P < 0.9 and I2 = 0%). Thrombosis is a common complication in cancer patients and venous thromboembolism (VTE) is found at autopsy in at least 50% of cancer patients (Thompson 1952). However, assessment of the true incidence of VTE in cancer patients is difficult because most of these patients receive chemotherapy or hormonal therapy which could precipitate VTE. In addition, many cancer patients have indwelling central venous lines, which can also initiate thrombotic events in relation to the catheter (Verso 2003). Consequently, we have calculated the NNTH assuming different basal risks from those obtained in the trials, namely 0.02, 0.10 and 0.50 in cancer patients. The resulting NNTH values were NNTH = 55 (95% CI 22 to 385), NNTH = 11 (95% CI 4 to 77) and NNTH = 2 (95% CI 1 to 15), respectively. The quality of the evidence was very low.
Oedema (Figure not shown). We rated only three out of 11 trials as low risk regarding adequate sequence generation. We rated only two out of 11 trials as low risk for allocation concealment. We rated incomplete outcome data as low risk in eight out of 11 trials. The statistical test for heterogeneity was low (P = 0.76 and I2 = 0%). The quality of the evidence was rated as very low (NNTH = 28, 95% CI 4 to 143).
Potential biases in the review process
We have estimated that the potential bias in this review is low. Objectivity during the review process cannot be assessed, but the evaluation of trials to be included was done in pairs. We detected one trial that was unpublished due to early stopping because of increased mortality. Despite the fact that this trial was removed, mortality remained unchanged. We created funnels plot for all outcomes with more than 10 trials and these did not suggest publication bias. (These figures are not shown). The authors of this review do not have any conflicts of interest regarding MA.
Agreements and disagreements with other studies or reviews
Previous systematic reviews have shown similar results despite the fact that they did not include the same trials. Ruiz‐Garcia 2002 found weight gain (MD 0.448 kg, CI 95% 0.02 to 0.87) only with low MA doses (≤ 240 mg). Pascual 2004 concluded that MA improved appetite (RR 2.31, 95% CI 1.52 to 3.59), led to weight gain (RR 1.88, 95% CI 1.43 to 2.47) and improved health‐related quality of life (RR 1.52, 95% CI 1.00 to 2.30). Lesniak 2008 concluded, as in the present review, that MA increases appetite (RR 3.00, 95% CI 1.86 to 4.84, NNT = 3) and leads to weight gain (RR 1.71, 95% CI 1.24 to 2.36, NNT = 8). None of the reviews mentioned showed an increase in mortality in MA arm. Additionally, they either did not explicitly analyse adverse events or did not include them in their protocols.
In palliative medicine, quality of life means not only the control of physical symptoms, functioning in daily life and psychological and social well being; quality of life also implies care of the patient's spiritual and existential concerns and also the perception by members of the patient's family of the quality of their care. It is our opinion that improving appetite and slight weight gain is not enough to improve quality of life in these patients.
Prevalence of cachexia in AIDS patients is high (from 18% to 38% in cohort studies) despite antiretroviral therapy (Campa 2005; Tang 2005). The prevalence of weight loss and wasting has not changed over time; it is as frequent now as it was in 1997 (Tang 2005). The conclusion of the present review is in line with the statement of Mangili 2006, "Although there has been the presumption that, if weight loss is associated with morbidity and mortality in HIV infection, then improvements in weight would lead to improved QoL, there has been little data that support this”. The conclusions of this review regarding geriatric patients are in line with the guidelines of the American Geriatrics Society (Fick 2012) which state “Rationale: minimal effect on weight; increases risk of thrombotic events and possibly risk of death in older.. Recomendation: Avoid; Quality of evidence: moderate; Strenght of recommendation: Strong".
Authors' conclusions
Implications for practice.
The new trials identified and included in the present review update have not led to significant changes to the conclusions of the previous review (megestrol acetate (MA) improves appetite and slightly increases weight, without clinical relevance), except for adverse events. MA may be prescribed in patients with cancer to increase appetite and improve weight gain. Currently, there is no evidence to recommend MA to improve quality of life. This update has followed The Cochrane Collaboration guidelines for an unbiased review. Quality is difficult to define, since it depends on the design, conduct and analysis of a trial, its clinical relevance or the quality of reporting. Studies of low methodological quality can alter the interpretation of the benefit of an intervention. In this update, we assessed 58% of the trials as high quality for some outcomes such as improvement of weight.
Many concerns remain unresolved. Health‐related quality of life is an important goal in health care and cancer clinical trials, and is the cornerstone for delivery of good palliative medicine. The increasing recognition of patient autonomy means that subjective measures will become more important and, in the current climate of evidence‐based medicine, such measures must be valid and reliable.
Despite MA being approved US Food and Drug Administration for use in AIDS patients, this drug failed to show weight improvement and weight gain when compared with other drugs. MA compared with placebo was effective in AIDS patients in one trial.
In summary, MA could be prescribed to improve appetite in the context of palliative medicine, but it should be emphasised that this drug will probably not lead to full weight loss recovery or improve quality of life, and it is related to adverse events, including an increased risk of death.
Implications for research.
This update of the review shows that there is still a need for high‐quality trials focused on the evaluation of the effectiveness of MA. Trials with long‐term follow‐up are needed to rule out an increase in mortality. Even though the US Food and Drug Administration has approved MA for use in AIDS patients, more research is needed in this respect.
Feedback
Feedback submitted, 26 September 2018
Summary
Name: Anna Sutherland Email Address: anna.sutherland@cochrane.nhs.uk Affiliation: Oxford University Hospitals Foundation Trust Role: ST5 Palliative Medicine
I have found this review very helpful in informing practice and have certainly seen a trend away from the use of megesterol in clinical practice in light of these results. However, I feel this review would be even more accessible and useful if the GRADE assessment for each outcome (and what that means about the certainty of the results in clinical practice) were reported in the abstract and the text of the review as the summary of findings table is not as accessible to all readers. For example: "In patients who take MA, approximately one in four will have an increase in their appetite (very low quality), one in 12 will have an increase in their weight (very low quality) and one in 23 will die (very low quality)."
Reply
The Editors thank Anna Sutherland for her comments. We have liaised with the authors who would like to draw your attention to their co‐publication of this review available here: https://doi.org/10.1002/jcsm.12292.
This review was last published in 2013, and was stabilised in 2017. At the next update, we will consider incorporating your suggestions into the abstract, which comply with the current MECIR standards.
Contributors
Feedback Editor Hayley Barnes, Co‐ordinating Editor Christopher Eccleston, and Managing Editor Anna Erskine.
What's new
| Date | Event | Description |
|---|---|---|
| 14 March 2019 | Feedback has been incorporated | See Feedback. |
| 7 July 2017 | Review declared as stable | See Published notes. |
History
Protocol first published: Issue 3, 2003 Review first published: Issue 2, 2005
| Date | Event | Description |
|---|---|---|
| 24 June 2012 | New citation required and conclusions have changed | In the current update we decided not to include cross‐over studies and to include only trials with patients who clearly had some previous weight loss or any definition of cachexia‐anorexia syndrome. None of the original authors remaining in this review. Eleven studies were excluded: Bruera 1990; Bruera 1998; Chen 1997; Erkurt 2000; Lai 1994; Marchand 2000; McQuellon 2002; Pardo 2003a; Rowland 1996; Westman 1999; Zeca 1995. Thirteen new studies were included: Casado 2008; Giacosa 1997; Herrejon 2011; Lesser 2006; ; Macbeth 1994; Madeddu 2012; Mwamburi 2004; Schmoll 1991; Summerbell 1992; Timpone 1997; Wanke 2007. We included 35 trials which represent 3963 patients studied for effectiveness and 3240 for safety. We could not use the data from the included trials Lesser 2006 and Gambardella 1998, therefore 863 fewer patients were ultimately studied in this update. There are changes to the previous conclusions of the review. More than 40 side effects were studied. Oedema, thromboembolic phenomena and deaths were more frequent in the patients treated with megestrol acetate (MA). Despite MA being approved for use in AIDS patients by US Food and Drug Administration, this drug failed to show weight improvement and weight gain when compared with other drugs. MA compared with placebo was effective in one trial in AIDS patients. MA could be prescribed to improve appetite in the context of palliative medicine, but it should be emphasised that this drug probably will not recover full weight loss, nor increase quality of life and it is related to adverse events, including increased mortality. |
| 24 June 2012 | New search has been performed | The search was updated on 7 May 2012. |
| 11 May 2011 | Amended | Contact details updated. |
| 30 October 2008 | Amended | Converted to new review format. |
| 20 August 2007 | New search has been performed | For the update for Issue 4, 2007 the following changes were made: Four new studies and three abstracts were identified, two of these studies were full text and were included in this updated review (Jatoi 2004; Ulutin 2002). These trials added 540 additional participants to the review. Two of these studies were excluded (Macbeth 1994; Yeh 2004). There was no change to the previous conclusions of the review. |
Notes
We performed full searches in February 2015, and April and December 2016, intending to complete a full update, but we did not identify any potentially relevant studies likely to change the conclusions. Therefore, this review has now been stabilised following discussion with the authors and editors. If appropriate, we will update the review if new evidence likely to change the conclusions is published, or if standards change substantially which necessitate major revisions.
Acknowledgements
Previous review
We are grateful to Dr CL Loprinzi and Paul Novotny from the Mayo Clinic; Professor E Bruera, Department of Palliative Care and Rehabilitation Medicine at Cross Cancer Institute, University of Alberta, Edmonton, and MD Anderson for supplying additional data for this review. We would also like to thank Marcelo García Diéguez and NicolasGarrigue from Argentina who have helped us with the search strategy and comments. We would like to thank Sylvia Bickley (Trials Search Co‐ordinator, Cochrane Pain, Palliative Care & Supportive Care Group) for performing the bibliographic searches in the previous version of this review.
Present review
We would like to thank Graciella Berenstein (deceased in 2011) and Zulma Ortiz for his inspiration, and for what they started in 2002. We would like to thank Dr Herrejon, Dr Casado, Dr McMillan and Dra Vadell who provided us with explanations of their work. We would like to thank Ms Jane Hayes for the electronic searches. We would like to thank Warren Anthony Stevens who reviewed the English draft. This update systematic review is dedicated to the memory of Graciella Bernstein, who was the first author of the previous version of this review.
Appendices
Appendix 1. Cochrane Pain, Palliative and Supportive Care Group's Trial Register
| #1 MeSH descriptor Cachexia, this term only |
| #2 MeSH descriptor Anorexia, this term only |
| #3 anorexi* |
| #4 cachex* or cachectic |
| #5 MeSH descriptor Weight Loss explode all trees |
| #6 MeSH descriptor Appetite, this term only |
| #7 weight or wasting or appetite |
| #8 (#1 OR #2 OR #3 OR #4 OR #5 OR #6 OR #7) |
| #9 MeSH descriptor Megestrol explode all trees |
| #10 megestrol |
| #11 (#9 OR #10) |
| #12 (#8 AND #11) |
| Issue 3 2011; we have rerun the searches from Issue 3 to Issue 5, 2012 |
Appendix 2. MEDLINE search strategy in OVID
| 1 Cachexia/ |
| 2 Anorexia/ |
| 3 anorexi*.mp. |
| 4 (cachex* or cachectic).mp. |
| 5 exp Weight Loss/ |
| 6 Appetite/ |
| 7 (weight or wasting or appetite).mp. |
| 8 1 or 2 or 3 or 4 or 5 or 6 or 7 |
| 9 exp Megestrol/ |
| 10 megestrol.mp. |
| 11 9 or 10 |
| 12 randomised controlled trial.pt. |
| 13 controlled clinical trial.pt. |
| 14 randomized.ab. |
| 15 placebo.ab. |
| 16 drug therapy.fs. |
| 17 randomly.ab. |
| 18 trial.ab. |
| 19 groups.ab. |
| 20 12 or 13 or 14 or 15 or 16 or 17 or 18 or 19 |
| 21 8 and 11 and 20 |
| Key: mp = protocol supplementary concept, rare disease supplementary concept, title, original title, abstract, name of substance word, subject heading word, unique identifier; pt = publication type; ab = abstract: fs = floating subheading; MEDLINE 1948 to July week 3, 2011; we have rerun the searches from 2011 to May week 2 2012 |
Appendix 3. EMBASE search strategy in OVID
| 1 cachexia/ |
| 2 anorexia/ |
| 3 anorexi*.mp. |
| 4 (cachex* or cachectic).mp. |
| 5 weight reduction/ |
| 6 appetite/ |
| 7 (weight or wasting or appetite).mp. |
| 8 1 or 2 or 3 or 4 or 5 or 6 or 7 |
| 9 megestrol/ |
| 10 megestrol acetate/ |
| 11 megestrol.mp. |
| 12 9 or 10 or 11 |
| 13 crossover procedure/ |
| 14 randomised controlled trial/ |
| 15 single blind procedure/ |
| 16 random*.mp. |
| 17 factorial*.mp. |
| 18 (crossover* or cross over* or cross‐over).mp. |
| 19 placebo*.mp. |
| 20 (doubl* adj blind*).mp. |
| 21 (singl* adj blind*).mp. |
| 22 assign*.mp. |
| 23 allocat*.mp. |
| 24 volunteer*.mp. |
| 25 13 or 14 or 15 or 16 or 17 or 18 or 19 or 20 or 21 or 22 or 23 or 24 |
| 26 8 and 12 and 25 |
| Key: mp = title, abstract, subject headings, heading word, drug trade name, original title, device manufacturer, drug manufacturer, device trade name, keyword]: 1980 to 2011 week 29; we have rerun the searches from 2011 to 2012 week 19 |
Data and analyses
Comparison 1. Megestrol acetate versus placebo (ITT).
| Outcome or subgroup title | No. of studies | No. of participants | Statistical method | Effect size |
|---|---|---|---|---|
| 1 Appetite improvement | 5 | 699 | Risk Ratio (M‐H, Random, 95% CI) | 2.19 [1.41, 3.40] |
| 1.1 Cancer | 4 | 429 | Risk Ratio (M‐H, Random, 95% CI) | 2.57 [1.48, 4.49] |
| 1.2 AIDS | 1 | 270 | Risk Ratio (M‐H, Random, 95% CI) | 1.56 [1.13, 2.16] |
| 1.3 Other underlying pathology | 0 | 0 | Risk Ratio (M‐H, Random, 95% CI) | 0.0 [0.0, 0.0] |
| 2 Appetite gain | 2 | 75 | Std. Mean Difference (IV, Random, 95% CI) | 0.91 [0.43, 1.39] |
| 2.1 Cancer | 0 | 0 | Std. Mean Difference (IV, Random, 95% CI) | 0.0 [0.0, 0.0] |
| 2.2 AIDS | 0 | 0 | Std. Mean Difference (IV, Random, 95% CI) | 0.0 [0.0, 0.0] |
| 2.3 Other underlying pathology | 2 | 75 | Std. Mean Difference (IV, Random, 95% CI) | 0.91 [0.43, 1.39] |
| 3 Weight improvement | 10 | 1106 | Risk Ratio (M‐H, Random, 95% CI) | 1.51 [1.08, 2.11] |
| 3.1 Cancer | 8 | 767 | Risk Ratio (M‐H, Random, 95% CI) | 1.55 [1.06, 2.26] |
| 3.2 AIDS | 1 | 270 | Risk Ratio (M‐H, Random, 95% CI) | 2.15 [1.14, 4.04] |
| 3.3 Other underlying pathology | 1 | 69 | Risk Ratio (M‐H, Random, 95% CI) | 0.71 [0.30, 1.70] |
| 4 Weight gain | 8 | 552 | Mean Difference (IV, Random, 95% CI) | 1.93 [0.95, 2.91] |
| 4.1 Cancer | 3 | 227 | Mean Difference (IV, Random, 95% CI) | 1.63 [0.87, 2.38] |
| 4.2 AIDS | 1 | 81 | Mean Difference (IV, Random, 95% CI) | 4.26 [2.70, 5.82] |
| 4.3 Other underlying pathology | 4 | 244 | Mean Difference (IV, Random, 95% CI) | 1.47 [0.06, 2.87] |
| 5 Quality of life improvement | 4 | 670 | Risk Ratio (M‐H, Random, 95% CI) | 1.78 [1.09, 2.92] |
| 5.1 Cancer | 2 | 300 | Risk Ratio (M‐H, Random, 95% CI) | 1.91 [1.02, 3.59] |
| 5.2 AIDS | 2 | 370 | Risk Ratio (M‐H, Random, 95% CI) | 1.49 [0.47, 4.69] |
| 5.3 Other underlying pathology | 0 | 0 | Risk Ratio (M‐H, Random, 95% CI) | 0.0 [0.0, 0.0] |
| 6 Quality of life gain | 2 | 70 | Std. Mean Difference (IV, Random, 95% CI) | 0.50 [‐0.13, 1.13] |
| 6.1 Cancer | 1 | 33 | Std. Mean Difference (IV, Random, 95% CI) | 0.18 [‐0.51, 0.86] |
| 6.2 AIDS | 0 | 0 | Std. Mean Difference (IV, Random, 95% CI) | 0.0 [0.0, 0.0] |
| 6.3 Other underlying pathology | 1 | 37 | Std. Mean Difference (IV, Random, 95% CI) | 0.82 [0.14, 1.50] |
Comparison 2. Megestrol acetate versus other drugs (ITT).
| Outcome or subgroup title | No. of studies | No. of participants | Statistical method | Effect size |
|---|---|---|---|---|
| 1 Appetite improvement | 2 | 475 | Risk Ratio (M‐H, Random, 95% CI) | 1.03 [0.64, 1.67] |
| 1.1 Cancer | 2 | 475 | Risk Ratio (M‐H, Random, 95% CI) | 1.03 [0.64, 1.67] |
| 1.2 AIDS | 0 | 0 | Risk Ratio (M‐H, Random, 95% CI) | 0.0 [0.0, 0.0] |
| 1.3 Other underlying pathology | 0 | 0 | Risk Ratio (M‐H, Random, 95% CI) | 0.0 [0.0, 0.0] |
| 2 Appetite gain | 1 | 9 | Mean Difference (IV, Random, 95% CI) | 1.60 [‐1.28, 4.48] |
| 2.1 Cancer | 0 | 0 | Mean Difference (IV, Random, 95% CI) | 0.0 [0.0, 0.0] |
| 2.2 AIDS | 1 | 9 | Mean Difference (IV, Random, 95% CI) | 1.60 [‐1.28, 4.48] |
| 2.3 Other underlying pathology | 0 | 0 | Mean Difference (IV, Random, 95% CI) | 0.0 [0.0, 0.0] |
| 3 Weight improvement | 7 | 1131 | Risk Ratio (M‐H, Random, 95% CI) | 1.66 [1.09, 2.52] |
| 3.1 Cancer | 4 | 1067 | Risk Ratio (M‐H, Random, 95% CI) | 2.49 [1.54, 4.00] |
| 3.2 AIDS | 3 | 64 | Risk Ratio (M‐H, Random, 95% CI) | 1.16 [0.84, 1.61] |
| 3.3 Other underlying pathology | 0 | 0 | Risk Ratio (M‐H, Random, 95% CI) | 0.0 [0.0, 0.0] |
| 4 Weight gain | 5 | 541 | Mean Difference (IV, Random, 95% CI) | 2.50 [0.37, 4.64] |
| 4.1 Cancer | 2 | 475 | Mean Difference (IV, Random, 95% CI) | 0.61 [‐0.15, 1.38] |
| 4.2 AIDS | 3 | 66 | Mean Difference (IV, Random, 95% CI) | 4.85 [‐0.79, 10.49] |
| 4.3 Other underlying pathology | 0 | 0 | Mean Difference (IV, Random, 95% CI) | 0.0 [0.0, 0.0] |
| 5 Quality of life improvement | 2 | 475 | Risk Ratio (M‐H, Random, 95% CI) | 1.05 [0.77, 1.44] |
| 5.1 Cancer | 2 | 475 | Risk Ratio (M‐H, Random, 95% CI) | 1.05 [0.77, 1.44] |
| 5.2 AIDS | 0 | 0 | Risk Ratio (M‐H, Random, 95% CI) | 0.0 [0.0, 0.0] |
| 5.3 Other underlying pathology | 0 | 0 | Risk Ratio (M‐H, Random, 95% CI) | 0.0 [0.0, 0.0] |
| 6 Quality of life gain | 1 | 311 | Std. Mean Difference (IV, Fixed, 95% CI) | 0.20 [‐0.02, 0.43] |
| 6.1 Cancer | 1 | 311 | Std. Mean Difference (IV, Fixed, 95% CI) | 0.20 [‐0.02, 0.43] |
| 6.2 AIDS | 0 | 0 | Std. Mean Difference (IV, Fixed, 95% CI) | 0.0 [0.0, 0.0] |
| 6.3 Other underlying pathology | 0 | 0 | Std. Mean Difference (IV, Fixed, 95% CI) | 0.0 [0.0, 0.0] |
2.5. Analysis.
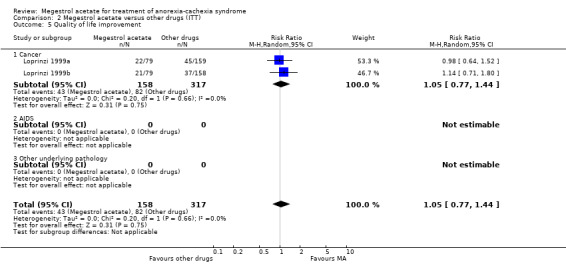
Comparison 2 Megestrol acetate versus other drugs (ITT), Outcome 5 Quality of life improvement.
2.6. Analysis.
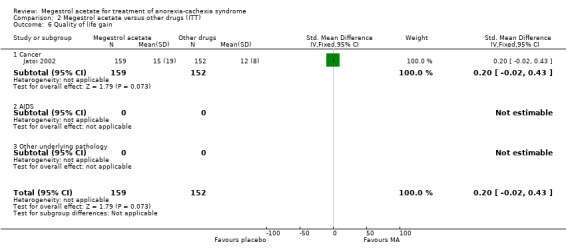
Comparison 2 Megestrol acetate versus other drugs (ITT), Outcome 6 Quality of life gain.
Comparison 3. Megestrol acetate versus megestrol acetate (ITT).
| Outcome or subgroup title | No. of studies | No. of participants | Statistical method | Effect size |
|---|---|---|---|---|
| 1 Appetite improvement | 3 | 304 | Risk Ratio (M‐H, Random, 95% CI) | 0.95 [0.76, 1.18] |
| 1.1 Cancer | 3 | 304 | Risk Ratio (M‐H, Random, 95% CI) | 0.95 [0.76, 1.18] |
| 2 Weight improvement | 6 | 812 | Risk Ratio (M‐H, Random, 95% CI) | 0.77 [0.64, 0.93] |
| 2.1 Cancer | 6 | 812 | Risk Ratio (M‐H, Random, 95% CI) | 0.77 [0.64, 0.93] |
| 3 Weight improvement 160 mg versus other higher doses | 4 | 407 | Risk Ratio (M‐H, Random, 95% CI) | 0.72 [0.52, 0.99] |
| 3.1 Cancer | 4 | 407 | Risk Ratio (M‐H, Random, 95% CI) | 0.72 [0.52, 0.99] |
| 4 Weight gain | 2 | 283 | Mean Difference (IV, Random, 95% CI) | ‐0.94 [‐3.33, 1.45] |
| 4.1 Cancer | 0 | 0 | Mean Difference (IV, Random, 95% CI) | 0.0 [0.0, 0.0] |
| 4.2 AIDS | 2 | 283 | Mean Difference (IV, Random, 95% CI) | ‐0.94 [‐3.33, 1.45] |
| 4.3 Other underlying pathology | 0 | 0 | Mean Difference (IV, Random, 95% CI) | 0.0 [0.0, 0.0] |
| 5 Quality of life improvement | 1 | 231 | Risk Ratio (M‐H, Random, 95% CI) | 0.81 [0.58, 1.11] |
| 5.1 AIDS | 1 | 231 | Risk Ratio (M‐H, Random, 95% CI) | 0.81 [0.58, 1.11] |
| 6 Quality of life gain | 1 | 63 | Std. Mean Difference (IV, Random, 95% CI) | 0.26 [‐0.23, 0.76] |
| 6.1 AIDS | 1 | 63 | Std. Mean Difference (IV, Random, 95% CI) | 0.26 [‐0.23, 0.76] |
3.1. Analysis.
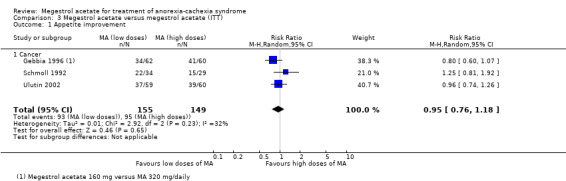
Comparison 3 Megestrol acetate versus megestrol acetate (ITT), Outcome 1 Appetite improvement.
Comparison 4. Safety.
| Outcome or subgroup title | No. of studies | No. of participants | Statistical method | Effect size |
|---|---|---|---|---|
| 1 Acute decompensation of COPD or pulmonary exacerbation | 4 | 271 | Risk Ratio (M‐H, Fixed, 95% CI) | 1.34 [0.72, 2.51] |
| 1.1 High doses (=> 800 mg/d) | 2 | 214 | Risk Ratio (M‐H, Fixed, 95% CI) | 1.55 [0.41, 5.83] |
| 1.2 Low doses (< 800 mg/d) | 2 | 57 | Risk Ratio (M‐H, Fixed, 95% CI) | 1.25 [0.65, 2.40] |
| 2 Serious adverse events (SAE) | 4 | 467 | Risk Ratio (M‐H, Fixed, 95% CI) | 2.10 [0.98, 4.47] |
| 2.1 High doses (=> 800 mg/d) | 1 | 145 | Risk Ratio (M‐H, Fixed, 95% CI) | 0.87 [0.31, 2.46] |
| 2.2 Low doses (< 800 mg/d) | 3 | 322 | Risk Ratio (M‐H, Fixed, 95% CI) | 4.65 [1.33, 16.29] |
| 3 Any adverse event | 13 | 1241 | Risk Ratio (M‐H, Fixed, 95% CI) | 1.20 [1.07, 1.36] |
| 3.1 High doses (=> 800 mg/d) | 5 | 347 | Risk Ratio (M‐H, Fixed, 95% CI) | 1.36 [1.01, 1.83] |
| 3.2 Low doses (< 800 mg/d) | 9 | 894 | Risk Ratio (M‐H, Fixed, 95% CI) | 1.16 [1.01, 1.32] |
| 4 Abdominal pain | 3 | 535 | Risk Ratio (M‐H, Fixed, 95% CI) | 1.65 [0.89, 3.06] |
| 4.1 High doses (=> 800 mg/d) | 2 | 475 | Risk Ratio (M‐H, Fixed, 95% CI) | 1.69 [0.89, 3.20] |
| 4.2 Low doses (< 800 mg/d) | 1 | 60 | Risk Ratio (M‐H, Fixed, 95% CI) | 1.07 [0.07, 16.31] |
| 5 Abnormal appetite | 1 | 66 | Risk Ratio (M‐H, Fixed, 95% CI) | 0.67 [0.12, 3.73] |
| 5.1 High doses (=> 800 mg/d) | 0 | 0 | Risk Ratio (M‐H, Fixed, 95% CI) | 0.0 [0.0, 0.0] |
| 5.2 Low doses (< 800 mg/d) | 1 | 66 | Risk Ratio (M‐H, Fixed, 95% CI) | 0.67 [0.12, 3.73] |
| 6 Amenorrhoea/irregular menses | 5 | 504 | Risk Ratio (M‐H, Fixed, 95% CI) | 0.97 [0.45, 2.09] |
| 6.1 High doses (=> 800 mg/d) | 2 | 166 | Risk Ratio (M‐H, Fixed, 95% CI) | 1.75 [0.53, 5.75] |
| 6.2 Low doses (< 800 mg/d) | 3 | 338 | Risk Ratio (M‐H, Fixed, 95% CI) | 0.62 [0.22, 1.77] |
| 7 Bowel obstruction | 1 | 42 | Risk Ratio (M‐H, Fixed, 95% CI) | 3.0 [0.13, 69.70] |
| 7.1 High doses (=> 800 mg/d) | 0 | 0 | Risk Ratio (M‐H, Fixed, 95% CI) | 0.0 [0.0, 0.0] |
| 7.2 Low doses (< 800 mg/d) | 1 | 42 | Risk Ratio (M‐H, Fixed, 95% CI) | 3.0 [0.13, 69.70] |
| 8 Constipation | 2 | 167 | Risk Ratio (M‐H, Fixed, 95% CI) | 1.85 [0.20, 16.73] |
| 8.1 High doses (=> 800 mg/d) | 0 | 0 | Risk Ratio (M‐H, Fixed, 95% CI) | 0.0 [0.0, 0.0] |
| 8.2 Low doses (< 800 mg/d) | 2 | 167 | Risk Ratio (M‐H, Fixed, 95% CI) | 1.85 [0.20, 16.73] |
| 9 Chest pain | 1 | 40 | Risk Ratio (M‐H, Fixed, 95% CI) | 3.0 [0.13, 69.52] |
| 9.1 High doses (=> 800 mg/d) | 0 | 0 | Risk Ratio (M‐H, Fixed, 95% CI) | 0.0 [0.0, 0.0] |
| 9.2 Low doses (<800 mg/d) | 1 | 40 | Risk Ratio (M‐H, Fixed, 95% CI) | 3.0 [0.13, 69.52] |
| 10 Confusion | 2 | 592 | Risk Ratio (M‐H, Fixed, 95% CI) | 0.89 [0.62, 1.28] |
| 10.1 High doses(=> 800 mg /d) | 1 | 311 | Risk Ratio (M‐H, Fixed, 95% CI) | 0.88 [0.58, 1.33] |
| 10.2 Low doses (< 800 mg/d) | 1 | 281 | Risk Ratio (M‐H, Fixed, 95% CI) | 0.94 [0.46, 1.92] |
| 11 Dyspnoea | 7 | 858 | Risk Ratio (M‐H, Fixed, 95% CI) | 2.23 [1.01, 4.93] |
| 11.1 High doses (=> 800 mg/d) | 4 | 379 | Risk Ratio (M‐H, Fixed, 95% CI) | 1.38 [0.37, 5.16] |
| 11.2 Low doses (< 800 mg/d) | 4 | 479 | Risk Ratio (M‐H, Fixed, 95% CI) | 2.80 [1.02, 7.67] |
| 12 Depression | 2 | 86 | Risk Ratio (M‐H, Fixed, 95% CI) | 2.45 [0.27, 22.18] |
| 12.1 High doses (=> 800 mg/d) | 1 | 69 | Risk Ratio (M‐H, Fixed, 95% CI) | 2.76 [0.12, 65.41] |
| 12.2 Low doses (< 800 mg/d) | 1 | 17 | Risk Ratio (M‐H, Fixed, 95% CI) | 2.18 [0.10, 46.92] |
| 13 Deaths | 11 | 1367 | Risk Ratio (M‐H, Fixed, 95% CI) | 1.42 [1.04, 1.94] |
| 13.1 High doses (=> 800 mg/d) | 5 | 726 | Risk Ratio (M‐H, Fixed, 95% CI) | 1.66 [1.08, 2.57] |
| 13.2 Low doses (< 800 mg/d) | 7 | 641 | Risk Ratio (M‐H, Fixed, 95% CI) | 1.20 [0.77, 1.86] |
| 14 Diarrhoea | 4 | 374 | Risk Ratio (M‐H, Fixed, 95% CI) | 1.02 [0.35, 3.02] |
| 14.1 High doses (=> 800 mg/d) | 1 | 100 | Risk Ratio (M‐H, Fixed, 95% CI) | 1.23 [0.29, 5.22] |
| 14.2 Low doses (< 800 mg/d) | 3 | 274 | Risk Ratio (M‐H, Fixed, 95% CI) | 0.82 [0.16, 4.26] |
| 15 Drowsiness | 1 | 311 | Risk Ratio (M‐H, Fixed, 95% CI) | 0.90 [0.66, 1.23] |
| 15.1 High doses (=> 800 mg/d) | 1 | 311 | Risk Ratio (M‐H, Fixed, 95% CI) | 0.90 [0.66, 1.23] |
| 15.2 Low doses (< 800 mg/d) | 0 | 0 | Risk Ratio (M‐H, Fixed, 95% CI) | 0.0 [0.0, 0.0] |
| 16 Elevated transaminase levels | 2 | 64 | Risk Ratio (M‐H, Fixed, 95% CI) | 0.33 [0.07, 1.59] |
| 16.1 High doses (=> 800 mg/d) | 1 | 40 | Risk Ratio (M‐H, Fixed, 95% CI) | 0.09 [0.01, 1.54] |
| 16.2 Low doses (< 800 mg/d) | 1 | 24 | Risk Ratio (M‐H, Fixed, 95% CI) | 3.0 [0.13, 67.06] |
| 17 Glucose intolerance | 2 | 129 | Risk Ratio (M‐H, Fixed, 95% CI) | 0.89 [0.16, 4.80] |
| 17.1 High doses (=> 800 mg/d) | 2 | 129 | Risk Ratio (M‐H, Fixed, 95% CI) | 0.89 [0.16, 4.80] |
| 17.2 Low doses (< 800 mg/d) | 0 | 0 | Risk Ratio (M‐H, Fixed, 95% CI) | 0.0 [0.0, 0.0] |
| 18 Hallucinations/psychosis | 2 | 113 | Risk Ratio (M‐H, Fixed, 95% CI) | 0.55 [0.08, 3.83] |
| 18.1 High doses (=> 800 mg/d) | 2 | 113 | Risk Ratio (M‐H, Fixed, 95% CI) | 0.55 [0.08, 3.83] |
| 18.2 Low doses (< 800 mg/d) | 0 | 0 | Risk Ratio (M‐H, Fixed, 95% CI) | 0.0 [0.0, 0.0] |
| 19 Headaches | 1 | 40 | Risk Ratio (M‐H, Fixed, 95% CI) | 3.0 [0.13, 69.52] |
| 19.1 High doses (=> 800 mg/d) | 1 | 40 | Risk Ratio (M‐H, Fixed, 95% CI) | 3.0 [0.13, 69.52] |
| 19.2 Low doses (< 800 mg/d) | 0 | 0 | Risk Ratio (M‐H, Fixed, 95% CI) | 0.0 [0.0, 0.0] |
| 20 Hyperphagia | 1 | 10 | Risk Ratio (M‐H, Fixed, 95% CI) | 7.0 [0.42, 116.40] |
| 20.1 High doses (=> 800 mg/d) | 0 | 0 | Risk Ratio (M‐H, Fixed, 95% CI) | 0.0 [0.0, 0.0] |
| 20.2 Low doses (< 800 mg/d) | 1 | 10 | Risk Ratio (M‐H, Fixed, 95% CI) | 7.0 [0.42, 116.40] |
| 21 Heart burn | 3 | 517 | Risk Ratio (M‐H, Fixed, 95% CI) | 0.71 [0.37, 1.35] |
| 21.1 High doses (=> 800 mg/d) | 2 | 475 | Risk Ratio (M‐H, Fixed, 95% CI) | 0.74 [0.38, 1.43] |
| 21.2 Low doses (< 800 mg/d) | 1 | 42 | Risk Ratio (M‐H, Fixed, 95% CI) | 0.33 [0.01, 7.74] |
| 22 Heart failure | 1 | 89 | Risk Ratio (M‐H, Fixed, 95% CI) | 0.27 [0.01, 6.53] |
| 22.1 High doses (=> 800 mg/d) | 1 | 89 | Risk Ratio (M‐H, Fixed, 95% CI) | 0.27 [0.01, 6.53] |
| 22.2 Low doses (<800 mg/d) | 0 | 0 | Risk Ratio (M‐H, Fixed, 95% CI) | 0.0 [0.0, 0.0] |
| 23 Hypertension | 3 | 289 | Risk Ratio (M‐H, Fixed, 95% CI) | 0.63 [0.14, 2.91] |
| 23.1 High doses(=> 800 mg /d) | 3 | 240 | Risk Ratio (M‐H, Fixed, 95% CI) | 0.63 [0.14, 2.91] |
| 23.2 Low doses (< 800 mg/d) | 1 | 49 | Risk Ratio (M‐H, Fixed, 95% CI) | 0.0 [0.0, 0.0] |
| 24 Impotence | 13 | 2071 | Risk Ratio (M‐H, Fixed, 95% CI) | 2.58 [1.78, 3.75] |
| 24.1 High doses (=> 800 mg/d) | 8 | 1346 | Risk Ratio (M‐H, Fixed, 95% CI) | 2.49 [1.63, 3.81] |
| 24.2 Low doses (< 800 mg/d) | 6 | 725 | Risk Ratio (M‐H, Fixed, 95% CI) | 2.89 [1.33, 6.26] |
| 25 Infections | 5 | 885 | Risk Ratio (M‐H, Fixed, 95% CI) | 0.94 [0.64, 1.39] |
| 25.1 High doses (=> 800 mg/d) | 4 | 669 | Risk Ratio (M‐H, Fixed, 95% CI) | 0.92 [0.60, 1.40] |
| 25.2 Low doses (< 800 mg/d) | 2 | 216 | Risk Ratio (M‐H, Fixed, 95% CI) | 1.08 [0.39, 2.96] |
| 26 Inappropriate behaviour | 1 | 311 | Risk Ratio (M‐H, Fixed, 95% CI) | 4.78 [0.56, 40.44] |
| 26.1 High doses (=> 800 mg/d) | 1 | 311 | Risk Ratio (M‐H, Fixed, 95% CI) | 4.78 [0.56, 40.44] |
| 26.2 Low doses (< 800 mg/d) | 0 | 0 | Risk Ratio (M‐H, Fixed, 95% CI) | 0.0 [0.0, 0.0] |
| 27 Insomnia | 3 | 492 | Risk Ratio (M‐H, Fixed, 95% CI) | 3.71 [0.87, 15.77] |
| 27.1 High doses (=> 800 mg/d) | 2 | 475 | Risk Ratio (M‐H, Fixed, 95% CI) | 4.51 [0.58, 35.31] |
| 27.2 Low doses (< 800 mg/d) | 1 | 17 | Risk Ratio (M‐H, Fixed, 95% CI) | 2.8 [0.39, 20.02] |
| 28 Loss of co‐ordination | 1 | 311 | Risk Ratio (M‐H, Fixed, 95% CI) | 1.04 [0.62, 1.75] |
| 28.1 High doses (=> 800 mg/d) | 1 | 311 | Risk Ratio (M‐H, Fixed, 95% CI) | 1.04 [0.62, 1.75] |
| 28.2 Low doses (< 800 mg/d) | 0 | 0 | Risk Ratio (M‐H, Fixed, 95% CI) | 0.0 [0.0, 0.0] |
| 29 Nausea/vomiting | 13 | 1645 | Risk Ratio (M‐H, Fixed, 95% CI) | 0.58 [0.45, 0.74] |
| 29.1 High doses (=> 800 mg/d) | 6 | 997 | Risk Ratio (M‐H, Fixed, 95% CI) | 0.51 [0.37, 0.72] |
| 29.2 Low doses (< 800 mg/d) | 8 | 648 | Risk Ratio (M‐H, Fixed, 95% CI) | 0.68 [0.46, 1.00] |
| 30 Neoplasma | 1 | 69 | Risk Ratio (M‐H, Fixed, 95% CI) | 0.92 [0.06, 14.07] |
| 30.1 High doses (=> 800 mg/d) | 1 | 69 | Risk Ratio (M‐H, Fixed, 95% CI) | 0.92 [0.06, 14.07] |
| 30.2 Low doses (< 800 mg/d) | 0 | 0 | Risk Ratio (M‐H, Fixed, 95% CI) | 0.0 [0.0, 0.0] |
| 31 Oedema | 12 | 2182 | Risk Ratio (M‐H, Fixed, 95% CI) | 1.36 [1.07, 1.72] |
| 31.1 High doses (=> 800 mg/d) | 8 | 1285 | Risk Ratio (M‐H, Fixed, 95% CI) | 1.37 [1.04, 1.81] |
| 31.2 Low doses (< 800 mg/d) | 6 | 897 | Risk Ratio (M‐H, Fixed, 95% CI) | 1.33 [0.84, 2.09] |
| 32 Pneumonia | 4 | 296 | Risk Ratio (M‐H, Fixed, 95% CI) | 1.81 [0.51, 6.42] |
| 32.1 High doses (=> 800 mg/d) | 2 | 214 | Risk Ratio (M‐H, Fixed, 95% CI) | 1.34 [0.28, 6.54] |
| 32.2 Low doses (< 800 mg/d) | 2 | 82 | Risk Ratio (M‐H, Fixed, 95% CI) | 3.0 [0.32, 27.71] |
| 33 Pruritus | 2 | 272 | Risk Ratio (M‐H, Fixed, 95% CI) | 0.97 [0.14, 6.81] |
| 33.1 High doses (=> 800 mg/d) | 0 | 0 | Risk Ratio (M‐H, Fixed, 95% CI) | 0.0 [0.0, 0.0] |
| 33.2 Low doses (< 800 mg/d) | 2 | 272 | Risk Ratio (M‐H, Fixed, 95% CI) | 0.97 [0.14, 6.81] |
| 34 Pyrosis | 1 | 150 | Risk Ratio (M‐H, Fixed, 95% CI) | 1.62 [0.40, 6.55] |
| 34.1 High doses (=> 800 mg/d) | 0 | 0 | Risk Ratio (M‐H, Fixed, 95% CI) | 0.0 [0.0, 0.0] |
| 34.2 Low doses (< 800 mg/d) | 1 | 150 | Risk Ratio (M‐H, Fixed, 95% CI) | 1.62 [0.40, 6.55] |
| 35 Pulmonary embolism | 1 | 240 | Risk Ratio (M‐H, Fixed, 95% CI) | 2.47 [0.12, 50.83] |
| 35.1 High doses (=> 800 mg/d) | 0 | 0 | Risk Ratio (M‐H, Fixed, 95% CI) | 0.0 [0.0, 0.0] |
| 35.2 Low doses (< 800 mg/d) | 1 | 240 | Risk Ratio (M‐H, Fixed, 95% CI) | 2.47 [0.12, 50.83] |
| 36 Respiratory failure | 1 | 42 | Risk Ratio (M‐H, Fixed, 95% CI) | 0.33 [0.01, 7.74] |
| 36.1 High doses (=> 800 mg/d) | 0 | 0 | Risk Ratio (M‐H, Fixed, 95% CI) | 0.0 [0.0, 0.0] |
| 36.2 Low doses (< 800 mg/d) | 1 | 42 | Risk Ratio (M‐H, Fixed, 95% CI) | 0.33 [0.01, 7.74] |
| 37 Other adverse events | 3 | 254 | Risk Ratio (M‐H, Fixed, 95% CI) | 1.51 [0.60, 3.76] |
| 37.1 High doses (=> 800 mg/d) | 3 | 254 | Risk Ratio (M‐H, Fixed, 95% CI) | 1.51 [0.60, 3.76] |
| 37.2 Low doses (< 800 mg/d) | 0 | 0 | Risk Ratio (M‐H, Fixed, 95% CI) | 0.0 [0.0, 0.0] |
| 38 Skin disorder (includes vesiculobullous rash) | 3 | 157 | Risk Ratio (M‐H, Fixed, 95% CI) | 0.84 [0.21, 3.36] |
| 38.1 High doses (=> 800 mg/d) | 2 | 140 | Risk Ratio (M‐H, Fixed, 95% CI) | 1.61 [0.22, 11.88] |
| 38.2 Low doses (< 800 mg/d) | 1 | 17 | Risk Ratio (M‐H, Fixed, 95% CI) | 0.35 [0.04, 3.15] |
| 39 Sweating | 3 | 109 | Risk Ratio (M‐H, Fixed, 95% CI) | 3.15 [0.54, 18.35] |
| 39.1 High doses (=> 800 mg/d) | 2 | 92 | Risk Ratio (M‐H, Fixed, 95% CI) | 2.87 [0.31, 26.58] |
| 39.2 Low doses (< 800 mg/d) | 1 | 17 | Risk Ratio (M‐H, Fixed, 95% CI) | 3.64 [0.20, 65.86] |
| 40 Swelling legs or abdominal | 3 | 756 | Risk Ratio (M‐H, Fixed, 95% CI) | 1.01 [0.73, 1.39] |
| 40.1 High doses (=> 800 mg/d) | 2 | 475 | Risk Ratio (M‐H, Fixed, 95% CI) | 0.63 [0.23, 1.68] |
| 40.2 Low doses (< 800 mg/d) | 1 | 281 | Risk Ratio (M‐H, Fixed, 95% CI) | 1.10 [0.79, 1.54] |
| 41 Stroke | 2 | 183 | Risk Ratio (M‐H, Fixed, 95% CI) | 1.16 [0.24, 5.64] |
| 41.1 High doses (=> 800 mg/d) | 2 | 134 | Risk Ratio (M‐H, Fixed, 95% CI) | 0.71 [0.10, 5.22] |
| 41.2 Low doses (< 800 mg/d) | 1 | 49 | Risk Ratio (M‐H, Fixed, 95% CI) | 2.73 [0.14, 53.78] |
| 42 Thromboembolic phenomena including thrombophlebitis | 12 | 1604 | Risk Ratio (M‐H, Random, 95% CI) | 1.84 [1.07, 3.18] |
| 42.1 High doses (=> 800 mg/d) | 6 | 792 | Risk Ratio (M‐H, Random, 95% CI) | 2.35 [0.93, 5.94] |
| 42.2 Low doses (< 800 mg/d) | 7 | 812 | Risk Ratio (M‐H, Random, 95% CI) | 1.62 [0.82, 3.18] |
| 43 Testicular shrinkage | 1 | 10 | Risk Ratio (M‐H, Fixed, 95% CI) | 4.2 [0.21, 83.33] |
| 43.1 High doses (=> 800 mg/d) | 0 | 0 | Risk Ratio (M‐H, Fixed, 95% CI) | 0.0 [0.0, 0.0] |
| 43.2 Low doses (< 800 mg/d) | 1 | 10 | Risk Ratio (M‐H, Fixed, 95% CI) | 4.2 [0.21, 83.33] |
| 44 Withdrawals | 16 | 1339 | Risk Ratio (M‐H, Fixed, 95% CI) | 0.94 [0.83, 1.06] |
| 44.1 High doses (=> 800 mg/d) | 6 | 818 | Risk Ratio (M‐H, Fixed, 95% CI) | 0.92 [0.80, 1.06] |
| 44.2 Low doses (< 800 mg/d) | 10 | 521 | Risk Ratio (M‐H, Fixed, 95% CI) | 0.98 [0.75, 1.28] |
4.1. Analysis.

Comparison 4 Safety, Outcome 1 Acute decompensation of COPD or pulmonary exacerbation.
4.4. Analysis.
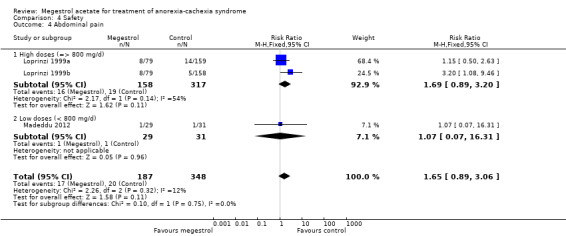
Comparison 4 Safety, Outcome 4 Abdominal pain.
4.5. Analysis.
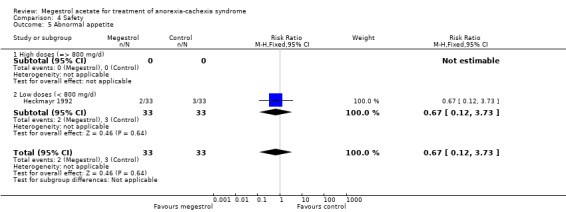
Comparison 4 Safety, Outcome 5 Abnormal appetite.
4.6. Analysis.
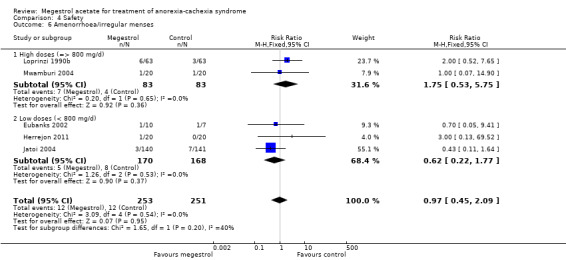
Comparison 4 Safety, Outcome 6 Amenorrhoea/irregular menses.
4.7. Analysis.
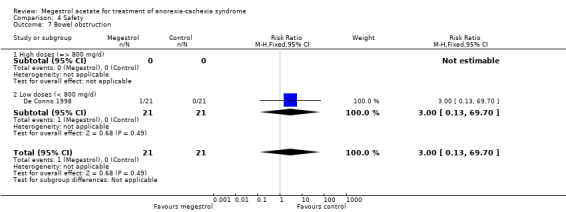
Comparison 4 Safety, Outcome 7 Bowel obstruction.
4.8. Analysis.

Comparison 4 Safety, Outcome 8 Constipation.
4.9. Analysis.

Comparison 4 Safety, Outcome 9 Chest pain.
4.10. Analysis.
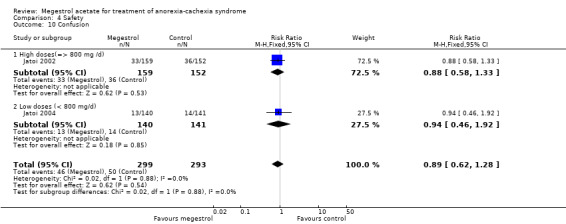
Comparison 4 Safety, Outcome 10 Confusion.
4.12. Analysis.
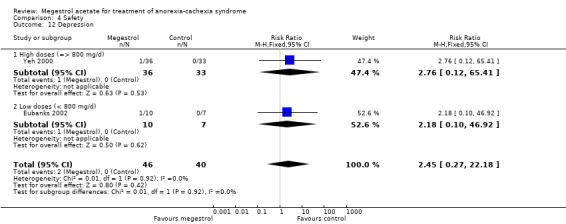
Comparison 4 Safety, Outcome 12 Depression.
4.14. Analysis.

Comparison 4 Safety, Outcome 14 Diarrhoea.
4.15. Analysis.
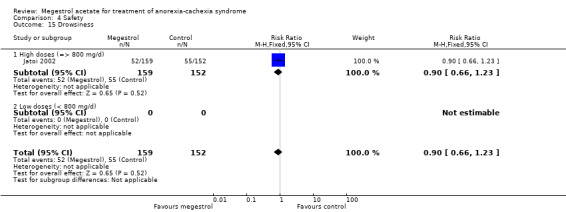
Comparison 4 Safety, Outcome 15 Drowsiness.
4.16. Analysis.
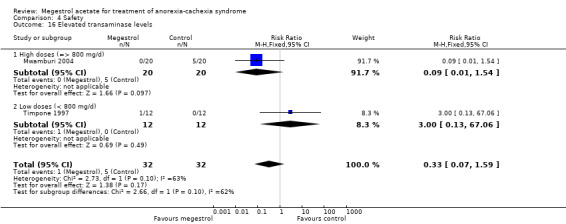
Comparison 4 Safety, Outcome 16 Elevated transaminase levels.
4.17. Analysis.
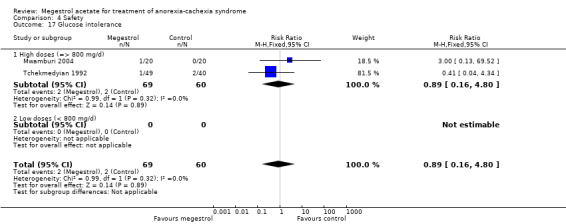
Comparison 4 Safety, Outcome 17 Glucose intolerance.
4.18. Analysis.
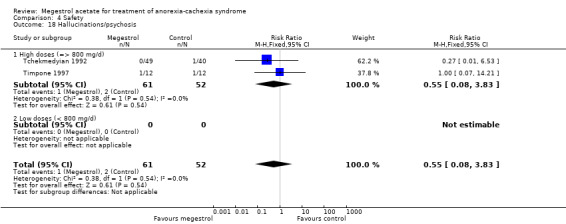
Comparison 4 Safety, Outcome 18 Hallucinations/psychosis.
4.19. Analysis.
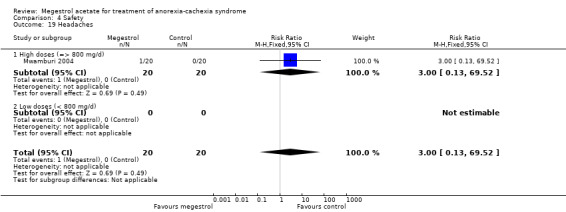
Comparison 4 Safety, Outcome 19 Headaches.
4.20. Analysis.
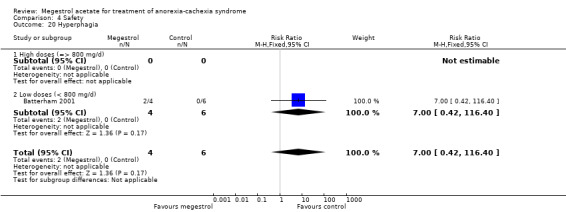
Comparison 4 Safety, Outcome 20 Hyperphagia.
4.21. Analysis.
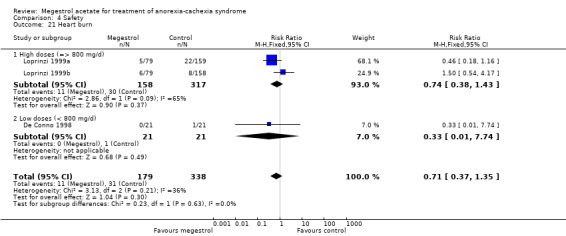
Comparison 4 Safety, Outcome 21 Heart burn.
4.22. Analysis.
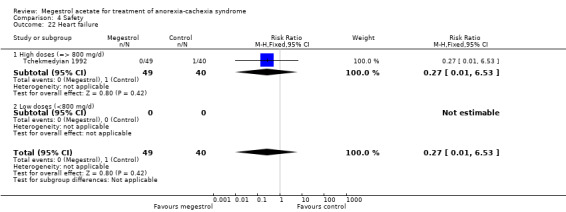
Comparison 4 Safety, Outcome 22 Heart failure.
4.23. Analysis.
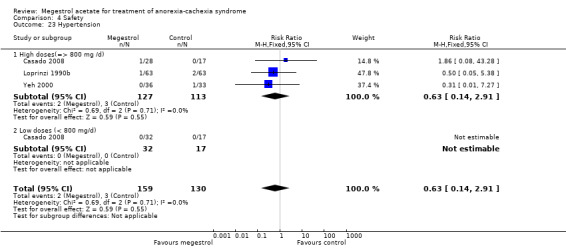
Comparison 4 Safety, Outcome 23 Hypertension.
4.25. Analysis.
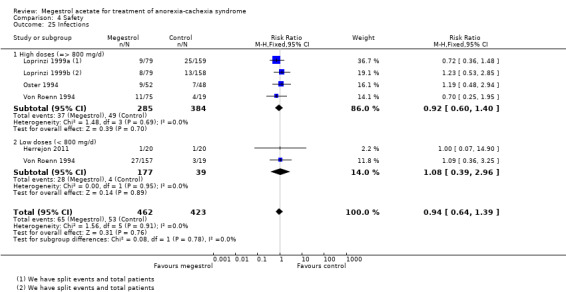
Comparison 4 Safety, Outcome 25 Infections.
4.26. Analysis.

Comparison 4 Safety, Outcome 26 Inappropriate behaviour.
4.27. Analysis.

Comparison 4 Safety, Outcome 27 Insomnia.
4.28. Analysis.
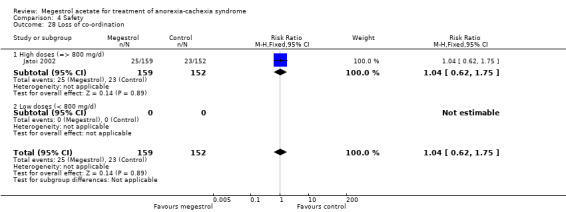
Comparison 4 Safety, Outcome 28 Loss of co‐ordination.
4.30. Analysis.
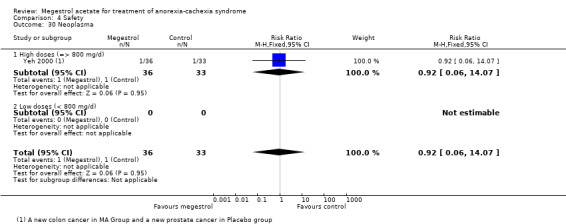
Comparison 4 Safety, Outcome 30 Neoplasma.
4.32. Analysis.

Comparison 4 Safety, Outcome 32 Pneumonia.
4.33. Analysis.
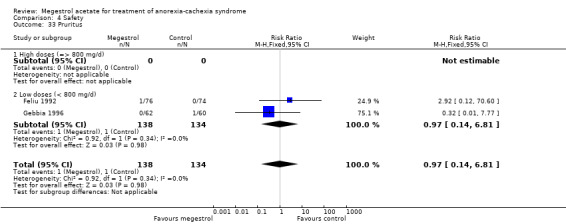
Comparison 4 Safety, Outcome 33 Pruritus.
4.34. Analysis.
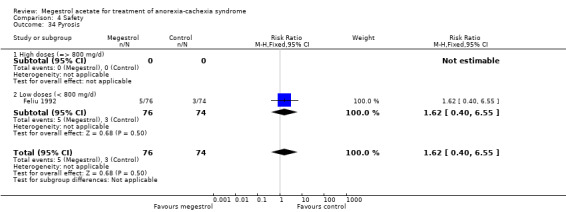
Comparison 4 Safety, Outcome 34 Pyrosis.
4.35. Analysis.
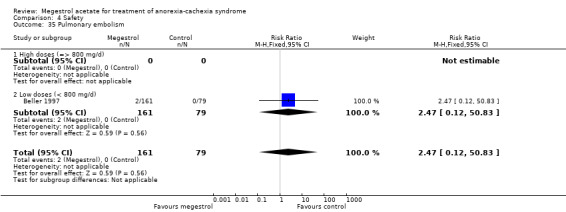
Comparison 4 Safety, Outcome 35 Pulmonary embolism.
4.36. Analysis.
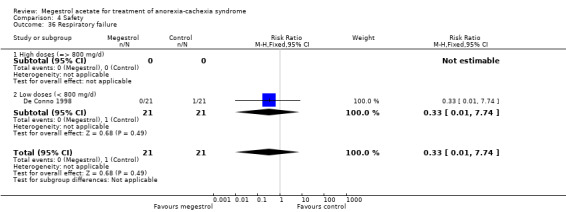
Comparison 4 Safety, Outcome 36 Respiratory failure.
4.37. Analysis.
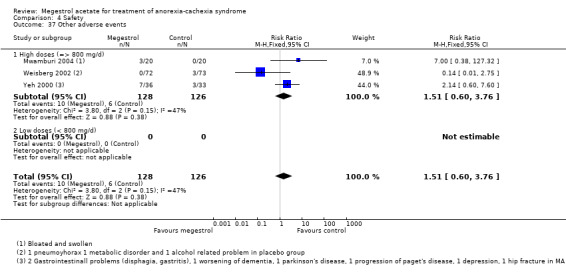
Comparison 4 Safety, Outcome 37 Other adverse events.
4.38. Analysis.
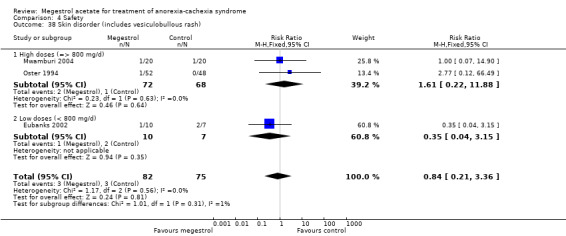
Comparison 4 Safety, Outcome 38 Skin disorder (includes vesiculobullous rash).
4.39. Analysis.
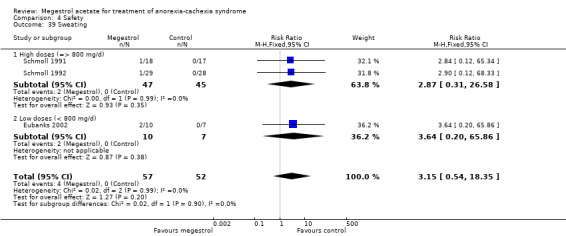
Comparison 4 Safety, Outcome 39 Sweating.
4.40. Analysis.
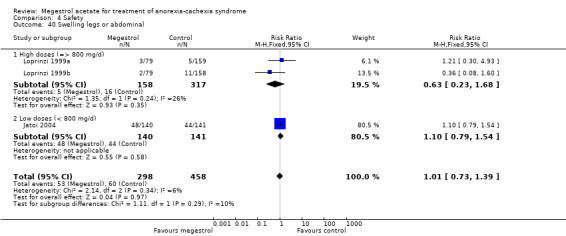
Comparison 4 Safety, Outcome 40 Swelling legs or abdominal.
4.41. Analysis.
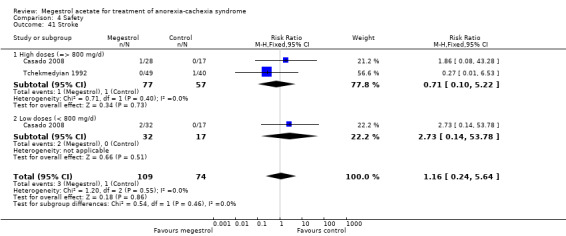
Comparison 4 Safety, Outcome 41 Stroke.
4.43. Analysis.

Comparison 4 Safety, Outcome 43 Testicular shrinkage.
Comparison 5. Sensitivity analyses.
| Outcome or subgroup title | No. of studies | No. of participants | Statistical method | Effect size |
|---|---|---|---|---|
| 1 Appetite improvement treatment duration 6 weeks | 7 | 1174 | Risk Ratio (M‐H, Random, 95% CI) | 1.70 [1.14, 2.54] |
| 1.1 < 6 weeks | 1 | 133 | Risk Ratio (M‐H, Random, 95% CI) | 1.48 [0.87, 2.52] |
| 1.2 6 or more weeks | 6 | 1041 | Risk Ratio (M‐H, Random, 95% CI) | 1.78 [1.11, 2.86] |
| 2 Appetite improvement treatment duration 12 weeks | 7 | 1174 | Risk Ratio (M‐H, Random, 95% CI) | 1.70 [1.14, 2.54] |
| 2.1 0 to 11 weeks | 6 | 904 | Risk Ratio (M‐H, Random, 95% CI) | 1.80 [1.06, 3.04] |
| 2.2 12 or more weeks | 1 | 270 | Risk Ratio (M‐H, Random, 95% CI) | 1.56 [1.13, 2.16] |
| 3 Appetite gain 12 weeks | 3 | 84 | Mean Difference (IV, Random, 95% CI) | 1.45 [0.35, 2.54] |
| 3.1 < 12 weeks | 1 | 27 | Mean Difference (IV, Random, 95% CI) | 2.53 [0.89, 4.17] |
| 3.2 > 12 weeks | 2 | 57 | Mean Difference (IV, Random, 95% CI) | 0.94 [0.32, 1.56] |
| 4 Weight improvement treatment duration 6 weeks | 17 | 2237 | Risk Ratio (M‐H, Random, 95% CI) | 1.55 [1.21, 1.98] |
| 4.1 < 6 weeks | 1 | 133 | Risk Ratio (M‐H, Random, 95% CI) | 0.99 [0.69, 1.40] |
| 4.2 6 or more weeks | 16 | 2104 | Risk Ratio (M‐H, Random, 95% CI) | 1.63 [1.27, 2.10] |
| 5 Quality of life gain | 3 | 381 | Std. Mean Difference (IV, Random, 95% CI) | 0.32 [‐0.02, 0.65] |
| 5.1 Cancer | 2 | 344 | Std. Mean Difference (IV, Random, 95% CI) | 0.20 [‐0.01, 0.41] |
| 5.2 Other underlying pathology | 1 | 37 | Std. Mean Difference (IV, Random, 95% CI) | 0.82 [0.14, 1.50] |
| 6 Weight improvement 12 weeks | 17 | 2237 | Risk Ratio (M‐H, Random, 95% CI) | 1.40 [1.01, 1.94] |
| 6.1 < 12 weeks | 12 | 1744 | Risk Ratio (M‐H, Random, 95% CI) | 1.40 [0.90, 2.18] |
| 6.2 > 12 weeks | 5 | 493 | Risk Ratio (M‐H, Random, 95% CI) | 1.46 [0.92, 2.31] |
| 7 Weight gain 6 weeks | 13 | 1093 | Mean Difference (IV, Random, 95% CI) | 1.96 [1.11, 2.81] |
| 7.1 < 6 weeks | 2 | 166 | Mean Difference (IV, Random, 95% CI) | 1.46 [0.62, 2.30] |
| 7.2 6 or more weeks | 11 | 927 | Mean Difference (IV, Random, 95% CI) | 2.15 [1.09, 3.21] |
| 8 Weight gain 12 weeks | 13 | 1093 | Mean Difference (IV, Random, 95% CI) | 1.96 [1.11, 2.81] |
| 8.1 < 12 weeks | 11 | 1025 | Mean Difference (IV, Random, 95% CI) | 1.96 [1.06, 2.87] |
| 8.2 > 12 weeks | 2 | 68 | Mean Difference (IV, Random, 95% CI) | 1.94 [‐1.64, 5.53] |
| 9 Blinded versus open‐label appetite improvement | 7 | 1174 | Risk Ratio (M‐H, Random, 95% CI) | 1.70 [1.14, 2.54] |
| 9.1 Blinded studies | 3 | 553 | Risk Ratio (M‐H, Random, 95% CI) | 1.96 [1.17, 3.27] |
| 9.2 Open‐label studies | 4 | 621 | Risk Ratio (M‐H, Random, 95% CI) | 1.53 [0.82, 2.87] |
| 10 Blinded versus open‐label appetite gain | 3 | 84 | Mean Difference (IV, Random, 95% CI) | 1.45 [0.35, 2.54] |
| 10.1 Blinded studies | 2 | 75 | Mean Difference (IV, Random, 95% CI) | 1.54 [‐0.01, 3.08] |
| 10.2 Open‐label studies | 1 | 9 | Mean Difference (IV, Random, 95% CI) | 1.60 [‐1.28, 4.48] |
| 11 Blinded versus open‐label weight Improvement | 17 | 2237 | Risk Ratio (M‐H, Random, 95% CI) | 1.40 [1.01, 1.94] |
| 11.1 Blinded studies | 10 | 1552 | Risk Ratio (M‐H, Random, 95% CI) | 1.63 [1.15, 2.32] |
| 11.2 Open‐label studies | 7 | 685 | Risk Ratio (M‐H, Random, 95% CI) | 1.14 [0.53, 2.47] |
| 12 Sensitivity number patients weight improvement | 17 | 2237 | Risk Ratio (M‐H, Random, 95% CI) | 1.40 [1.01, 1.94] |
| 12.1 n < 100 patients | 9 | 467 | Risk Ratio (M‐H, Random, 95% CI) | 1.27 [0.98, 1.65] |
| 12.2 n > 100 patients | 8 | 1770 | Risk Ratio (M‐H, Random, 95% CI) | 1.53 [0.80, 2.91] |
| 13 Appetite improvement, study quality | 7 | 1174 | Risk Ratio (M‐H, Random, 95% CI) | 1.70 [1.14, 2.54] |
| 13.1 Study quality (Jadad score 3, 4 or 5) | 2 | 283 | Risk Ratio (M‐H, Random, 95% CI) | 2.31 [0.93, 5.72] |
| 13.2 Study quality (Jadad score 2 or low) | 5 | 891 | Risk Ratio (M‐H, Random, 95% CI) | 1.47 [0.96, 2.27] |
| 14 Weight improvement, study quality | 17 | 2237 | Risk Ratio (M‐H, Random, 95% CI) | 1.55 [1.21, 1.98] |
| 14.1 Study quality (Jadad score 3,4 or 5) | 10 | 1322 | Risk Ratio (M‐H, Random, 95% CI) | 1.50 [1.07, 2.10] |
| 14.2 Study quality (Jadad score 2 or low) | 7 | 915 | Risk Ratio (M‐H, Random, 95% CI) | 1.60 [1.17, 2.20] |
| 15 Weight gain, study quality | 13 | 1093 | Mean Difference (IV, Random, 95% CI) | 1.96 [1.11, 2.81] |
| 15.1 Study quality (Jadad score 3,4 or 5) | 9 | 528 | Mean Difference (IV, Random, 95% CI) | 1.90 [0.89, 2.91] |
| 15.2 Study quality (Jadad score 0 or low) | 4 | 565 | Mean Difference (IV, Random, 95% CI) | 2.30 [0.25, 4.35] |
| 16 Sensitivity duration oedema | 13 | 2236 | Risk Ratio (M‐H, Fixed, 95% CI) | 1.39 [1.12, 1.72] |
| 16.1 1 to 4 weeks | 4 | 638 | Risk Ratio (M‐H, Fixed, 95% CI) | 1.81 [1.07, 3.08] |
| 16.2 > 5 to 8 weeks | 7 | 1225 | Risk Ratio (M‐H, Fixed, 95% CI) | 1.43 [1.04, 1.97] |
| 16.3 9 to 12 weeks | 2 | 373 | Risk Ratio (M‐H, Fixed, 95% CI) | 1.10 [0.82, 1.46] |
| 16.4 > 12 weeks | 0 | 0 | Risk Ratio (M‐H, Fixed, 95% CI) | 0.0 [0.0, 0.0] |
| 17 Sensitivity duration thromboembolic phenomena | 12 | 1604 | Risk Ratio (M‐H, Fixed, 95% CI) | 1.88 [1.11, 3.17] |
| 17.1 < 12 weeks | 7 | 934 | Risk Ratio (M‐H, Fixed, 95% CI) | 2.59 [1.16, 5.76] |
| 17.2 > 12 weeks | 5 | 670 | Risk Ratio (M‐H, Fixed, 95% CI) | 1.45 [0.71, 2.94] |
| 18 Sensitivity blinded versus open‐label weight gain | 14 | 1214 | Mean Difference (IV, Random, 95% CI) | 2.42 [1.41, 3.43] |
| 18.1 Blinded studies | 9 | 673 | Mean Difference (IV, Random, 95% CI) | 1.69 [1.11, 2.28] |
| 18.2 Open‐label studies | 5 | 541 | Mean Difference (IV, Random, 95% CI) | 3.15 [‐0.89, 7.19] |
| 19 Sensitivity number of patients in trial appetite improvement | 7 | 1174 | Risk Ratio (M‐H, Random, 95% CI) | 1.70 [1.14, 2.54] |
| 19.1 n < 100 patients | 2 | 146 | Risk Ratio (M‐H, Random, 95% CI) | 3.04 [1.52, 6.07] |
| 19.2 n > 100 patients | 5 | 1028 | Risk Ratio (M‐H, Random, 95% CI) | 1.50 [0.99, 2.27] |
| 20 Sensitivity number of patients weight gain | 14 | 1214 | Mean Difference (IV, Random, 95% CI) | 2.42 [1.41, 3.43] |
| 20.1 n < 100 patients | 8 | 252 | Mean Difference (IV, Random, 95% CI) | 3.45 [0.82, 6.08] |
| 20.2 n > 100 patients | 6 | 962 | Mean Difference (IV, Random, 95% CI) | 1.13 [0.59, 1.68] |
| 21 Sensitivity appetite improvement cancer | 6 | 904 | Risk Ratio (M‐H, Random, 95% CI) | 1.80 [1.06, 3.04] |
| 21.1 Cancer | 6 | 904 | Risk Ratio (M‐H, Random, 95% CI) | 1.80 [1.06, 3.04] |
| 22 Appetite improvement doses | 7 | 1174 | Risk Ratio (M‐H, Random, 95% CI) | 1.70 [1.14, 2.54] |
| 22.1 ≤ 400 mg of MA/d | 3 | 553 | Risk Ratio (M‐H, Random, 95% CI) | 1.96 [1.17, 3.27] |
| 22.2 480 to 800 mg of MA/d | 2 | 146 | Risk Ratio (M‐H, Random, 95% CI) | 3.04 [1.52, 6.07] |
| 22.3 ≥ 800 mg of MA/d | 2 | 475 | Risk Ratio (M‐H, Random, 95% CI) | 1.03 [0.64, 1.67] |
| 23 Weight improvement doses | 17 | 2237 | Risk Ratio (M‐H, Random, 95% CI) | 1.55 [1.21, 1.97] |
| 23.1 ≤ 400 mg MA/d | 7 | 818 | Risk Ratio (M‐H, Random, 95% CI) | 1.76 [1.19, 2.60] |
| 23.2 480 to 800 mg MA/d | 10 | 1330 | Risk Ratio (M‐H, Random, 95% CI) | 1.46 [1.00, 2.12] |
| 23.3 ≥ 800 mg MA/d | 1 | 89 | Risk Ratio (M‐H, Random, 95% CI) | 1.38 [0.87, 2.17] |
| 24 Sensitivity (cancer/other patients) thromboembolic phenomena | 12 | 1604 | Risk Ratio (M‐H, Fixed, 95% CI) | 1.88 [1.11, 3.17] |
| 24.1 Cancer patients | 11 | 1491 | Risk Ratio (M‐H, Fixed, 95% CI) | 1.89 [1.11, 3.22] |
| 24.2 Other patients | 1 | 113 | Risk Ratio (M‐H, Fixed, 95% CI) | 1.54 [0.06, 36.92] |
| 25 Deaths sensitivity 6 weeks | 11 | 1367 | Risk Ratio (M‐H, Random, 95% CI) | 1.38 [1.01, 1.89] |
| 25.1 < 6 weeks | 3 | 205 | Risk Ratio (M‐H, Random, 95% CI) | 1.26 [0.56, 2.86] |
| 25.2 > 6 weeks | 8 | 1162 | Risk Ratio (M‐H, Random, 95% CI) | 1.40 [1.00, 1.97] |
| 26 Deaths sensitivity/pathology | 11 | 1367 | Risk Ratio (M‐H, Random, 95% CI) | 1.38 [1.01, 1.89] |
| 26.1 Cancer | 7 | 801 | Risk Ratio (M‐H, Random, 95% CI) | 1.34 [0.97, 1.85] |
| 26.2 AIDS | 3 | 497 | Risk Ratio (M‐H, Random, 95% CI) | 2.55 [0.63, 10.28] |
| 26.3 Other underlying pathology | 1 | 69 | Risk Ratio (M‐H, Random, 95% CI) | 0.92 [0.06, 14.07] |
5.3. Analysis.
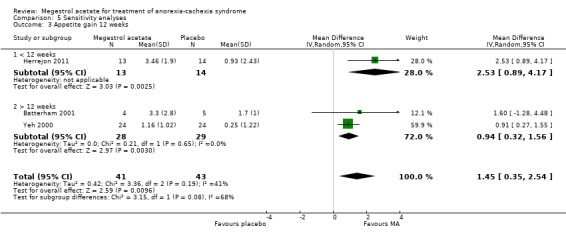
Comparison 5 Sensitivity analyses, Outcome 3 Appetite gain 12 weeks.
5.4. Analysis.
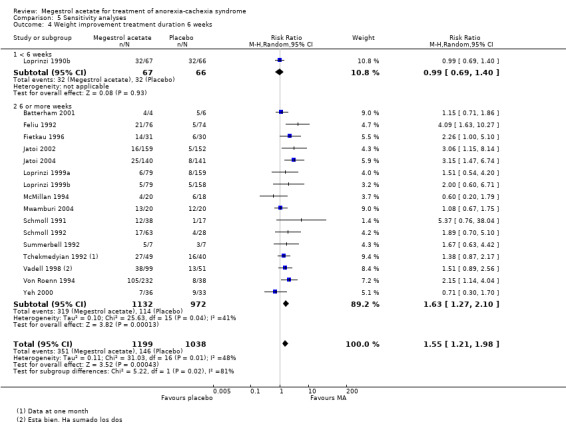
Comparison 5 Sensitivity analyses, Outcome 4 Weight improvement treatment duration 6 weeks.
5.5. Analysis.
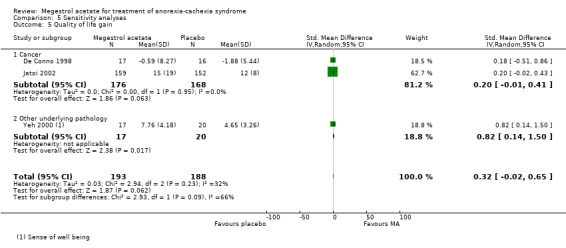
Comparison 5 Sensitivity analyses, Outcome 5 Quality of life gain.
5.7. Analysis.

Comparison 5 Sensitivity analyses, Outcome 7 Weight gain 6 weeks.
5.10. Analysis.
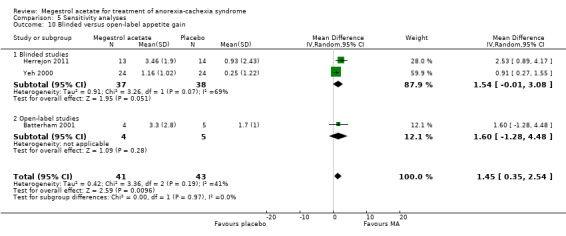
Comparison 5 Sensitivity analyses, Outcome 10 Blinded versus open‐label appetite gain.
5.18. Analysis.
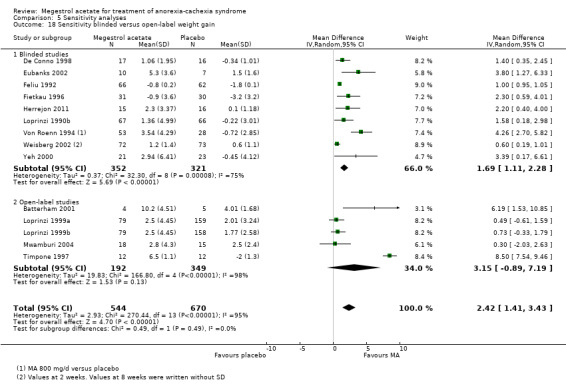
Comparison 5 Sensitivity analyses, Outcome 18 Sensitivity blinded versus open‐label weight gain.
5.21. Analysis.
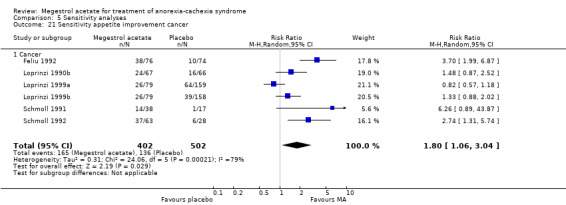
Comparison 5 Sensitivity analyses, Outcome 21 Sensitivity appetite improvement cancer.
5.22. Analysis.

Comparison 5 Sensitivity analyses, Outcome 22 Appetite improvement doses.
5.23. Analysis.
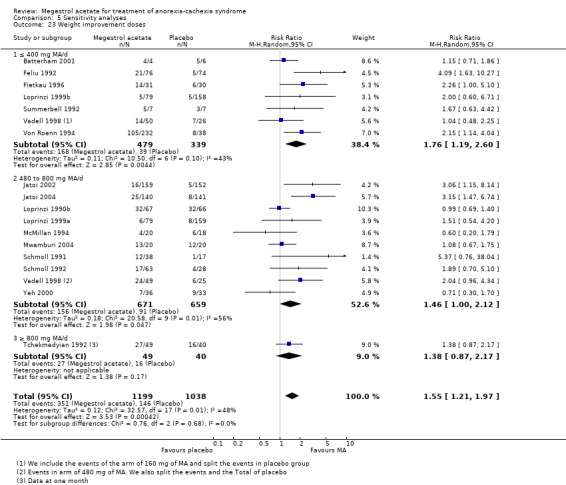
Comparison 5 Sensitivity analyses, Outcome 23 Weight improvement doses.
5.24. Analysis.
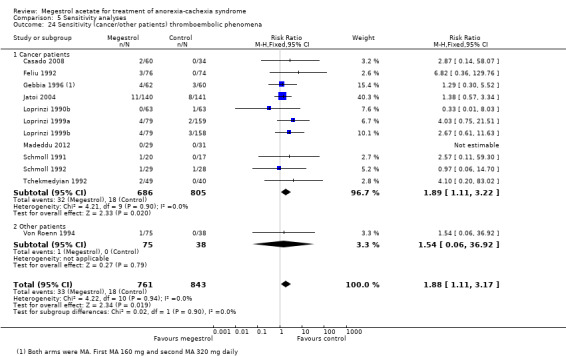
Comparison 5 Sensitivity analyses, Outcome 24 Sensitivity (cancer/other patients) thromboembolic phenomena.
Characteristics of studies
Characteristics of included studies [ordered by study ID]
Batterham 2001.
| Methods | Randomised controlled in a tertiary referral hospital, Sydney | |
| Participants | 15 HIV pts a) 4 M Mean age 46 yrs b) 8 M Mean age 44 yrs c) 5 M Mean age 42 yrs 5 completed and then randomised 3 to nandrolone and 2 to megestrol | |
| Interventions | a) MA 400 mg/d orally b) Nandrolone decanoate 100 mg/fortnight as an intramuscular injection c) Dietary counselling Duration 12 weeks | |
| Outcomes | Weight and height Appetite VAS 10‐point score 0 = poor appetite 10 = good appetite Dietary intake % | |
| Notes | 12 weeks of treatment
QS = 2 Cachexia was defined as unintentional weight loss of at least 5% of their usual body weight despite an adequate nutritional intake (> 85% estimated requirements calculated using the Harris Benedict equation) |
|
| Risk of bias | ||
| Bias | Authors' judgement | Support for judgement |
| Random sequence generation (selection bias) | Unclear risk | Insufficient information about the sequence generation process to permit judgement of low or high risk |
| Allocation concealment (selection bias) | Unclear risk | Insufficient information about the sequence generation process to permit judgement of low or high risk |
| Blinding (performance bias and detection bias) All outcomes | Low risk | No blinding but the review authors judge that the outcome is not likely to be influenced by lack of blinding |
| Blinding of participants and personnel (performance bias) All outcomes | Low risk | No blinding but the review authors judge that the outcome measurement is not likely to be influenced by lack of blinding |
| Blinding of outcome assessment (detection bias) All outcomes | Unclear risk | No blinding but the review authors judge that the outcome measurement is not likely to be influenced by lack of blinding |
| Incomplete outcome data (attrition bias) All outcomes | Low risk | Withdrawals were similar in all groups |
| Selective reporting (reporting bias) | High risk | Yes. Authors reported only data at 12 weeks and not at 24 weeks |
| Other bias | Unclear risk | Insufficient information to permit judgement of low risk or high risk |
Beller 1997.
| Methods | Double‐blind, randomised, controlled, multicentre (15), stratified by institution and whether receiving any antitumour treatment | |
| Participants | 240 cancer pts
a) 81 pts = 53 M + 28 F
(9 pts = 50 yrs, 49 pts = 51 to 70 yrs, 23 pts = > 71 yrs) b) 80 pts = 52 M + 28 F (7 pts = less than 50 yrs, 52 pts = 51 to 70 yrs, 21 pts = > 70 yrs) c) 79 pts = 54 M + 25 F (12 pts = 50 yrs, 51 pts = 51 to 70 yrs, 16 pts = > 70 yrs) Patients were excluded if they were under 18 years of age, had physical or functional obstruction to food intake or impaired digestive/absorptive function, were pregnant, were receiving concurrent corticosteroid treatment, were unable to complete quality of life forms, had endocrine‐sensitive malignant disease (i.e. of breast, prostate, uterus), had a life expectancy of less than 2 months, or were diabetic |
|
| Interventions | a) MA 480 mg/d orally b) MA 160 mg/d c) Placebo | |
| Outcomes | QoL 5 linear analogue self assessment scales (LASA) asked patients about 5 factors: physical well being, mood, pain, nausea and vomiting, and appetite, LASA uni scale of overall QoL and the Spitzer QoL Index, completed by the clinician Appetite (LASA score) Nutritional status Weight Triceps skinfold Mid‐arm circumference | |
| Notes | 2 weeks of treatment
QS = 3 Cachexia was defined as a body weight at least 5% below ideal, or unintentional loss of at least 5% of usual body weight, and eligible for the study. Withdrawals from randomised treatment (other than death whilst still on treatment) included drug intolerance or toxicity in 28 cases, deterioration in patient's condition not attributed to study treatment in 36 cases, and refusal by patient to continue in the study in 18 cases. “The proportion of incomplete data and withdrawals from treatment was very similar for the three treatment groups”. |
|
| Risk of bias | ||
| Bias | Authors' judgement | Support for judgement |
| Random sequence generation (selection bias) | Unclear risk | Insufficient information about the sequence generation process to permit judgement of low risk or high risk |
| Allocation concealment (selection bias) | Low risk | By telephone through a central office |
| Blinding (performance bias and detection bias) All outcomes | Low risk | No data about blinding but unlikely the outcome could be influenced by lack of blinding |
| Blinding of participants and personnel (performance bias) All outcomes | Low risk | No data about blinding but unlikely the outcome could be influenced by lack of blinding |
| Blinding of outcome assessment (detection bias) All outcomes | Low risk | No data about blinding but unlikely the outcome could be influenced by lack of blinding |
| Incomplete outcome data (attrition bias) All outcomes | Low risk | Missing outcome data balanced in numbers across intervention groups, with similar reasons for missing data across groups |
| Selective reporting (reporting bias) | Unclear risk | Insufficient information to permit judgement of low risk or high risk. No information in the meta register of clinical trials or http://apps.who.int/trialsearch |
| Other bias | Unclear risk | Insufficient information to permit judgement of low risk or high risk |
Casado 2008.
| Methods | Randomised controlled trial, not blinded | |
| Participants | 94 patients with non hormone‐sensitive cancer | |
| Interventions | MA tablets 160 mg MA tablets 960 mg Placebo At least 12 weeks |
|
| Outcomes | Weight QoL, appetite | |
| Notes | Cachexia was defined as weight loss of < 5% of ideal weight QS: 2 |
|
| Risk of bias | ||
| Bias | Authors' judgement | Support for judgement |
| Random sequence generation (selection bias) | Low risk | Random tables |
| Allocation concealment (selection bias) | Unclear risk | Insufficient information about the sequence generation process to permit judgement of low risk or high risk |
| Blinding (performance bias and detection bias) All outcomes | Low risk | See below |
| Blinding of participants and personnel (performance bias) All outcomes | Low risk | No blinding but the review authors judge that the outcome is not likely to be influenced by lack of blinding |
| Blinding of outcome assessment (detection bias) All outcomes | Low risk | Main outcome was weight |
| Incomplete outcome data (attrition bias) All outcomes | Low risk | Withdrawals were balanced, most for progression of cancer (no data between groups); patients deciding stop treatment = 5 (no data between groups) and related to adverse effects of treatments |
| Selective reporting (reporting bias) | Unclear risk | All outcomes were reported but data were shown in graphical manner or before/after, but not as mean change with SD in each group or as number of patients that gained appetite, weight or QoL, so only adverse events were included in the review |
| Other bias | Unclear risk | Insufficient information to permit judgement of low risk or high risk |
De Conno 1998.
| Methods | Double‐blind, randomised, controlled | |
| Participants | 42 patients with advanced non hormone‐responsive tumours a) 21 pts = 15 M + 6 F Mean age 63 yrs b) 21 pts = 16 M + 5 F Mean age 58 yrs | |
| Interventions | Phase A is a double‐blind, placebo‐controlled trial comparing MA 320 mg/day versus placebo for 2 weeks. In phase B all patients were treated with MA and the dosage was titrated according to clinical response for 76 days. | |
| Outcomes | Appetite score (numeric scale ranging from 0 to 10), Karnofsky, weight, subjective food intake, pain intensity, patient's preference and quality of life (TIQ sub scales) | |
| Notes | 14 days of treatment
QS = 3 Withdrawals in the Phase A were 4 in MA and 5 in placebo group. Cachexia was not defined but patients had a weight loss of > 10% |
|
| Risk of bias | ||
| Bias | Authors' judgement | Support for judgement |
| Random sequence generation (selection bias) | Unclear risk | Insufficient information about the sequence generation process to permit judgement of low risk or high risk |
| Allocation concealment (selection bias) | Unclear risk | Insufficient information to permit judgement of low risk or high risk |
| Blinding (performance bias and detection bias) All outcomes | Unclear risk | See below |
| Blinding of participants and personnel (performance bias) All outcomes | Unclear risk | Insufficient information to permit judgement of low risk or high risk; |
| Blinding of outcome assessment (detection bias) All outcomes | High risk | Appetite is the main outcome |
| Incomplete outcome data (attrition bias) All outcomes | Unclear risk | Missing data have been imputed using appropriate methods |
| Selective reporting (reporting bias) | Unclear risk | All outcomes in the paper have been reported but we did not find this trial in the meta register of clinical trial or http://apps.who.int/trialsearch |
| Other bias | Unclear risk | Insufficient information to permit judgement of low risk or high risk |
Eubanks 2002.
| Methods | Randomised, double‐blind, placebo‐controlled study | |
| Participants | 17 cystic fibrosis patients with growth failure, most < 18 years old a) 10 pts = 5 M + 4 F Ranging from age 6 to 18 yrs, 1 F 35 yrs b) 7 pts = 3 F + 4 M Ranging from age 6 to 15 yrs | |
| Interventions | a) MA 10 mg/kg per day
b) Placebo On day 0 of the study, patients were randomly assigned to receive either MA (n = 10) or placebo (n = 7) at a starting dose of 10 mg/kg per day. Medication doses were increased by 2.5 mg/kg per day for weight gain < 2% above baseline at day 30 or < 5% above baseline at days 60 or 90 (maximum dose, 15 mg/kg per day). Doses were decreased for weight gain > 5% above baseline at day 30 or > 10% above baseline at days 60 or 90. Medication doses were decreased by 2.5 mg/kg per day for side effects. At the conclusion of this study, the mean dose of MA was 7.5 mg/kg per day and the mean dose of placebo was 13.9 mg/kg per day. |
|
| Outcomes | Weight for age (WAZ) gain included both fat and fat‐free mass Improved pulmonary function (forced vital capacity and forced expiratory volume in 1 second) and side effects |
|
| Notes | Growth failure defined as no weight gain in the preceding 6 months, per cent ideal body weight of < 85%, weight < 5th percentile for age, or weight for height < 5th percentile Follow‐up was 180 days QS = 4 |
|
| Risk of bias | ||
| Bias | Authors' judgement | Support for judgement |
| Random sequence generation (selection bias) | Low risk | “Through the use of a computer‐generated randomisation schedule” |
| Allocation concealment (selection bias) | Unclear risk | Insufficient information to permit judgement of low risk or high risk |
| Blinding (performance bias and detection bias) All outcomes | Low risk | See below |
| Blinding of participants and personnel (performance bias) All outcomes | Low risk | “Each subject received MA or a placebo of similar physical characteristics (provided by Bristol Meyers‐Squibb, New York City, NY). Participants, treating physicians, and ancillary staff were blinded to the treatment group”. |
| Blinding of outcome assessment (detection bias) All outcomes | Low risk | The main outcome is not likely to be influenced by blinding |
| Incomplete outcome data (attrition bias) All outcomes | Low risk | All patients in the treatment group completed the study. 3 patients in the placebo group withdrew when they failed to observe a treatment effect |
| Selective reporting (reporting bias) | Low risk | All outcomes in the paper have been reported |
| Other bias | Unclear risk | Insufficient information to permit judgement of low risk or high risk |
Feliu 1992.
| Methods | Double‐blind randomised controlled trial | |
| Participants | 150 cancer patients with cancer non hormone‐dependent a) 76 pts = 58 M + 8 F Mean age 57 yrs b) 74 pts = 55 M + 7 F Mean age 58 yrs | |
| Interventions | a) MA 240 mg/day b) Placebo | |
| Outcomes | Body weight, appetite (described as changes in SSA score in 2 ranges: 0 to 5 and 6 to 10) Functional status (PS score described as 2 ranges: less than 60% and more than 60%) | |
| Notes | 2 months of treatment QS = 4 | |
| Risk of bias | ||
| Bias | Authors' judgement | Support for judgement |
| Random sequence generation (selection bias) | Low risk | They used computer random generation |
| Allocation concealment (selection bias) | Unclear risk | Insufficient information to permit judgement of low risk or high risk |
| Blinding (performance bias and detection bias) All outcomes | Low risk | See below |
| Blinding of participants and personnel (performance bias) All outcomes | Low risk | Study medication was provided in blinded packages |
| Blinding of outcome assessment (detection bias) All outcomes | Low risk | The main outcome was body weight |
| Incomplete outcome data (attrition bias) All outcomes | Low risk | No withdrawals; authors reported data for all patients that were alive |
| Selective reporting (reporting bias) | Low risk | All outcomes in the paper have been reported but we did not find this trial in the meta register of clinical trials or http://apps.who.int/trialsearch |
| Other bias | Unclear risk | Insufficient information to permit judgement of low risk or high risk |
Fietkau 1996.
| Methods | Double‐blind randomised controlled trial | |
| Participants | 64 cancer patients with head and neck cancer 61 pts: a) 31 pts = 25 M + 6 F Mean age 52 yrs b) 30 pts = 24 M + 6 F Mean age 48 yrs | |
| Interventions | a) MA 160 mg/day
b) Placebo During 6 weeks |
|
| Outcomes | Weight, anthropometric and biochemical parameters, and QoL (Padilla Index) | |
| Notes | 6 weeks of treatment during and up 6 weeks following radiotherapy Pts were stratified according oral feeding versus gastrostomy Definition of cachexia was weight loss of 5% over 6 weeks or 10% over the 6 months prior to radiotherapy Withdrawals were 1 in MA group and 2 more in placebo group QS = 3 |
|
| Risk of bias | ||
| Bias | Authors' judgement | Support for judgement |
| Random sequence generation (selection bias) | Unclear risk | Insufficient information to permit judgement of low risk or high risk |
| Allocation concealment (selection bias) | Unclear risk | Insufficient information to permit judgement of low risk or high risk |
| Blinding (performance bias and detection bias) All outcomes | Low risk | See below |
| Blinding of participants and personnel (performance bias) All outcomes | Low risk | The main outcome is not likely to be influenced by lack of blinding |
| Blinding of outcome assessment (detection bias) All outcomes | Low risk | The main outcome is not likely to be influenced by lack of blinding |
| Incomplete outcome data (attrition bias) All outcomes | Low risk | 1 patient was withdrawn in each arm because of suspected side effects (diarrhoea, impotence respectively) and 1 patient in the placebo arm refused further participation following randomisation |
| Selective reporting (reporting bias) | Low risk | All outcomes in the paper have been reported and we did not find this trial in the meta register of clinical trials or http://apps.who.int/trialsearch |
| Other bias | Unclear risk | Insufficient information to permit judgement of low risk or high risk |
Gambardella 1998.
| Methods | Double‐blind randomised controlled | |
| Participants | 30 elderly cancer patients, 15 in each arm | |
| Interventions | MA 320 mg daily versus placebo for 12 weeks | |
| Outcomes | Weight, serum levels of interleukins and QoL | |
| Notes | We found just 2 proceedings reporting this trial Cachexia was defined as weight loss < 6 kg in last 3 months Follow‐up was 12 weeks No data about weight in placebo group QS: 1 |
|
| Risk of bias | ||
| Bias | Authors' judgement | Support for judgement |
| Random sequence generation (selection bias) | Unclear risk | Insufficient information to permit judgement of low risk or high risk |
| Allocation concealment (selection bias) | Unclear risk | Insufficient information to permit judgement of low risk or high risk |
| Blinding (performance bias and detection bias) All outcomes | Unclear risk | See below |
| Blinding of participants and personnel (performance bias) All outcomes | Unclear risk | Insufficient information to permit judgement of low risk or high risk |
| Blinding of outcome assessment (detection bias) All outcomes | Unclear risk | The main outcome was body weight |
| Incomplete outcome data (attrition bias) All outcomes | Unclear risk | Insufficient information to permit judgement of low risk or high risk |
| Selective reporting (reporting bias) | Unclear risk | Insufficient information to permit judgement of low risk or high risk |
| Other bias | Unclear risk | Insufficient information to permit judgement of low risk or high risk |
Gebbia 1996.
| Methods | Randomised controlled trial | |
| Participants | 122 cancer pts a) 62 pts = 46 M + 16 F Mean age 63 yrs b) 60 pts = 42 M + 18 F Mean age 65 yrs | |
| Interventions | a) MA 160 mg/d b) MA 320 mg/d | |
| Outcomes | Appetite, body weight, pain, survival, Karnofsky Index | |
| Notes | 30 days of treatment
QS = 2 Definition of cachexia was weight loss > 5% |
|
| Risk of bias | ||
| Bias | Authors' judgement | Support for judgement |
| Random sequence generation (selection bias) | Unclear risk | Insufficient information to permit judgement of low risk or high risk |
| Allocation concealment (selection bias) | Unclear risk | Insufficient information to permit judgement of low risk or high risk |
| Blinding (performance bias and detection bias) All outcomes | High risk | See below |
| Blinding of participants and personnel (performance bias) All outcomes | High risk | It was a not blinded trial. One arm received 1 tablet and the other 2 tablets of MA |
| Blinding of outcome assessment (detection bias) All outcomes | High risk | The main outcome was appetite |
| Incomplete outcome data (attrition bias) All outcomes | Low risk | Withdrawals were quite similar and related to cancer: 1 patient died in the 160 mg/day arm and 2 patients died in the 320 mg/day arm at 30 days |
| Selective reporting (reporting bias) | Low risk | All outcomes in the paper have been reported but we did not find this trial in the meta register of clinical trials or http://apps.who.int/trialsearch |
| Other bias | Unclear risk | Insufficient information to permit judgement of low risk or high risk |
Giacosa 1997.
| Methods | Randomised controlled trial | |
| Participants | 28 patients with non hormone‐sensitive cancer | |
| Interventions | MA 320 mg/day plus standardised dietary counselling versus standardised dietary counselling (35 Kcal/day) 30 days of intervention | |
| Outcomes | Body weight, appetite, daily food intake, body composition, psychological distress | |
| Notes | Withdrawal: 10 patients were unevaluated due to early death (5 in each group) Cachexia was defined as weight loss > 10% of usual weight QS: 2 |
|
| Risk of bias | ||
| Bias | Authors' judgement | Support for judgement |
| Random sequence generation (selection bias) | Unclear risk | Insufficient information to permit judgement of low risk or high risk |
| Allocation concealment (selection bias) | Unclear risk | Insufficient information to permit judgement of low risk or high risk |
| Blinding (performance bias and detection bias) All outcomes | Low risk | See below |
| Blinding of participants and personnel (performance bias) All outcomes | Low risk | Not a blinded study but the outcome is not likely to be influenced by lack of blinding |
| Blinding of outcome assessment (detection bias) All outcomes | Low risk | Not a blinded study but the outcome is not likely to be influenced by lack of blinding |
| Incomplete outcome data (attrition bias) All outcomes | Low risk | Withdrawals were balanced but no data about 2 patients in the dietary counselling arm |
| Selective reporting (reporting bias) | Low risk | All outcomes in the paper have been reported but we did not find this trial in the meta register of clinical trial neither http://apps.who.int/trialsearch |
| Other bias | Unclear risk | Insufficient information to permit judgement of low risk or high risk |
Heckmayr 1992.
| Methods | Randomised controlled trial | |
| Participants | 66 patients with advanced bronchogenic carcinomas a) 33 pts = 24 M + 9 F Mean age 65 yrs b) 33 pts = 27 M + 6 F Mean age 68 yrs | |
| Interventions | a) MA 160 mg/daily b) MA 480 mg/daily | |
| Outcomes | Weight Well being Appetite (subjective 10‐point scale) |
|
| Notes | Treatment for 4 to 16 weeks Cachexia was defined as body weight loss > 10% QS = 1 |
|
| Risk of bias | ||
| Bias | Authors' judgement | Support for judgement |
| Random sequence generation (selection bias) | Low risk | Insufficient information to permit judgement of low risk or high risk |
| Allocation concealment (selection bias) | Unclear risk | Insufficient information to permit judgement of low risk or high risk |
| Blinding (performance bias and detection bias) All outcomes | Low risk | See below |
| Blinding of participants and personnel (performance bias) All outcomes | Low risk | This study was not blinded but the main outcome is not likely to be influenced by lack of blinding |
| Blinding of outcome assessment (detection bias) All outcomes | Low risk | This study was not blinded but the main outcome is not likely to be influenced by lack of blinding |
| Incomplete outcome data (attrition bias) All outcomes | Unclear risk | No mention of any withdrawals |
| Selective reporting (reporting bias) | Low risk | All outcomes in the paper have been reported but we did not find this trial in the meta register of clinical trials or http://apps.who.int/trialsearch |
| Other bias | Unclear risk | Insufficient information to permit judgement of low risk or high risk |
Herrejon 2011.
| Methods | Randomised controlled trial, double‐blinded | |
| Participants | 40 patients with stable COPD (without any exacerbation during the study) | |
| Interventions | 320 mg MA daily during 8 weeks versus placebo | |
| Outcomes | Body weight, triceps skin fold thickness and analytic values | |
| Notes | Cachexia was defined as body weight less > 5% QS: 5 NCT00507949 |
|
| Risk of bias | ||
| Bias | Authors' judgement | Support for judgement |
| Random sequence generation (selection bias) | Low risk | Random number table |
| Allocation concealment (selection bias) | Low risk | Was external and warranted for the promotor Madaus |
| Blinding (performance bias and detection bias) All outcomes | Low risk | See below |
| Blinding of participants and personnel (performance bias) All outcomes | Low risk | The pills were similar and it was double‐blinded |
| Blinding of outcome assessment (detection bias) All outcomes | Low risk | Body weight |
| Incomplete outcome data (attrition bias) All outcomes | Low risk | 5 patients in each group were withdrawals |
| Selective reporting (reporting bias) | Low risk | NCT00507949; all outcomes that were planned were shown |
| Other bias | Unclear risk | Insufficient information to permit judgement of low risk or high risk |
Jatoi 2002.
| Methods | Double‐blind randomised controlled, multicentre (20) | |
| Participants | 469 cancer patients with cancer‐associated anorexia other than brain, breast, ovarian or endometrial cancer
a) 159 pts = 103 M + 56 F
Mean age 65 yrs b)152 pts = 100 M + 52 F Mean age 67 yrs c) 158 pts = 104 M + 54 F Mean age 67 yrs |
|
| Interventions | a) MA 800 mg/d liquid suspension +2 capsules placebo b) Dronabinol capsules 2.5 mg orally x + liquid placebo c) MA suspension 800 mg/d + dronabinol capsules 2.5 mg x 2 | |
| Outcomes | Appetite (validated questionnaires) Weight QoL Functional Assessment of Anorexia/Cachexia Therapy (FAACT) instrument uni scale and 13‐item | |
| Notes | Cachexia was defined as body weight loss > 5 pounds (2.3 kg) during the preceding 2 months
QS = 4 Follow‐up: as long as patients and healthcare providers thought it beneficial or until toxic side effects were shown. Follow‐up median: 80 days (MA), 57 (DRO), 74 (MA+ DRO) (duration more than 4 weeks of treatment) |
|
| Risk of bias | ||
| Bias | Authors' judgement | Support for judgement |
| Random sequence generation (selection bias) | Unclear risk | Insufficient information to permit judgement of low risk or high risk |
| Allocation concealment (selection bias) | Unclear risk | Insufficient information to permit judgement of low risk or high risk |
| Blinding (performance bias and detection bias) All outcomes | Low risk | See below |
| Blinding of participants and personnel (performance bias) All outcomes | Low risk | Authors used capsules and liquid placebo to assure the blinding in all groups |
| Blinding of outcome assessment (detection bias) All outcomes | Unclear risk | The main outcome was appetite, without more details |
| Incomplete outcome data (attrition bias) All outcomes | Unclear risk | Withdrawals were quite similar in all groups, but the number in each group was uncertain and only 45% of patients remained at the end of the first month |
| Selective reporting (reporting bias) | Low risk | All results were available |
| Other bias | Unclear risk | Insufficient information to permit judgement of low risk or high risk |
Jatoi 2004.
| Methods | Double‐blind randomised controlled, multicentre (26) | |
| Participants | 421 cancer pts a) 140 pts = 97 M + 43 F Mean age 65 yrs b) 141 pts = 104 M + 37 F Mean age 66 yrs c) 140 pts = 92 M + 48 F Mean age 66 yrs | |
| Interventions | a) MA 600 mg/d liquid suspension + isocaloric, isonitrogenous placebo cans b) EPA supplement, 2 cans/d + placebo liquid suspension c) EPA supplement 2 cans/d plus MA liquid suspension 600 mg/d orally in combination | |
| Outcomes | Weight Appetite (NCCTG questionnaire and FAACT) QoL (single‐item uniscale) | |
| Notes | Duration more than 3 months (patients continued treatment as long as both the patient and treating oncologist considered it beneficial or until concerning or intolerable side effects occurred) Cachexia was defined as a self reported, 2‐month weight loss of at least 5 lb (2.3 kg) QS = 4 |
|
| Risk of bias | ||
| Bias | Authors' judgement | Support for judgement |
| Random sequence generation (selection bias) | Unclear risk | Insufficient information to permit judgement of low risk or high risk |
| Allocation concealment (selection bias) | Unclear risk | Insufficient information to permit judgement of low risk or high risk |
| Blinding (performance bias and detection bias) All outcomes | Low risk | See below |
| Blinding of participants and personnel (performance bias) All outcomes | Low risk | This double‐dummy study design used an active EPA supplement and an identical placebo |
| Blinding of outcome assessment (detection bias) All outcomes | Low risk | No data about blinding but weight is unlikely to have been influenced by blinding |
| Incomplete outcome data (attrition bias) All outcomes | Low risk | The withdrawals were balanced and well described |
| Selective reporting (reporting bias) | Low risk | All the outcomes were available and was registered |
| Other bias | Unclear risk | Insufficient information to permit judgement of low risk or high risk |
Lesser 2006.
| Methods | Randomised clinical trial | |
| Participants | Cancer patients with solid tumours and cachexia that were receiving chemotherapy 74 pts accrued (72 eligible) Median age 64 yrs 42% females and 62% stage 4 disease 25 pts (arm 1: 8, arm 2: 17) completed 12 weeks of therapy and 20 remained in study |
|
| Interventions | The effects of oxandrolone and megestrol (no more details about doses) on weight, body composition and QoL in pts with solid tumours and weight loss receiving chemotherapy | |
| Outcomes | Weight, body composition (main outcome) and QoL | |
| Notes | Cachexia was defined as progressive weight loss on chemotherapy 12 weeks of follow‐up QS: 1 |
|
| Risk of bias | ||
| Bias | Authors' judgement | Support for judgement |
| Random sequence generation (selection bias) | Unclear risk | Insufficient information to permit judgement of low risk or high risk |
| Allocation concealment (selection bias) | Unclear risk | Insufficient information to permit judgement of low risk or high risk |
| Blinding (performance bias and detection bias) All outcomes | Unclear risk | Insufficient information to permit judgement of low risk or high risk |
| Blinding of participants and personnel (performance bias) All outcomes | Unclear risk | Insufficient information to permit judgement of low risk or high risk |
| Blinding of outcome assessment (detection bias) All outcomes | Unclear risk | Insufficient information to permit judgement of low risk or high risk |
| Incomplete outcome data (attrition bias) All outcomes | Unclear risk | Insufficient information to permit judgement of low risk or high risk |
| Selective reporting (reporting bias) | Unclear risk | Insufficient information to permit judgement of low risk or high risk |
| Other bias | High risk | We have just a proceeding dated 2006. We have not found any paper with all the relevant data from this trial. There is a suspicion of publication bias. |
Loprinzi 1990b.
| Methods | Double‐blind randomised controlled trial | |
| Participants | 133 cancer pts (adults with advanced, incurable cancer ‐ other than breast or endometrial cancer ‐ who were experiencing anorexia, cachexia or both) a) 66 pts = 44 M + 23 F Mean age 69 yrs b) 67 pts = 44 M + 22 F Mean age 67 yrs | |
| Interventions | a) MA 800 mg/d (5 tablets per day of 160 mg of MA) b) Placebo | |
| Outcomes | Weight Appetite | |
| Notes | 1 month of treatment
QS = 4 Cachexia defined as loss of body weight in the preceding 2 months of at least 5 lb Follow‐up: median 1.6 months |
|
| Risk of bias | ||
| Bias | Authors' judgement | Support for judgement |
| Random sequence generation (selection bias) | Unclear risk | Insufficient information to permit judgement of low risk or high risk |
| Allocation concealment (selection bias) | Unclear risk | Insufficient information to permit judgement of low risk or high risk |
| Blinding (performance bias and detection bias) All outcomes | Low risk | See below |
| Blinding of participants and personnel (performance bias) All outcomes | Low risk | Authors declared that placebo tablets were identical to MA and weight is not likely to be influenced by lack of blinding |
| Blinding of outcome assessment (detection bias) All outcomes | Low risk | Weight is not likely to be influenced by lack of blinding |
| Incomplete outcome data (attrition bias) All outcomes | Low risk | 3 patients were moved from the study after randomisation but before the initiation of study (1 for additional treatment with prednisone and another due to a decline in physical condition), so all analyses were based on 133 eligible for treatment. 9 patients in each group had no weight recorded beyond their initial study weight and hence could not be included in analyses of weight. Withdrawals were balanced (nausea: 1 in MA and 1 in placebo group; refusal: 2 in MA and 4 in placebo group; physical deterioration: 1 in MA; inability to take oral medication: 2 in placebo). |
| Selective reporting (reporting bias) | Low risk | All the outcomes were available |
| Other bias | Unclear risk | Insufficient information to permit judgement of low risk or high risk |
Loprinzi 1994.
| Methods | Randomised controlled trial | |
| Participants | 342 cancer pts a) 88 pts = 56 M + 32 F Mean age 67 yrs b) 86 pts = 54 M + 32 F Mean age 67 yrs c) 85 pts = 55 M + 30 F Mean age 67 yrs d) 83 pts = 54 M + 29 F Mean age 66 yrs | |
| Interventions | a) MA 160 mg/d b) MA 480 mg/d c) MA 800 mg/d d) MA 1280 mg/d | |
| Outcomes | Weight (primary outcome) Appetite, perceived food intake Serum albumin Toxicity | |
| Notes | Median 66 days of treatment (9 weeks)
QS = 1 Cachexia: the study required each patient to have lost at least 2.27 kg within the preceding 2 months or have an estimated daily caloric intake less than 20 kcal/kg Withdrawals low doses (160 + 480 mg/d of MA): 28 patients versus high doses (800 mg + 1280 mg/d of MA): 39 patients |
|
| Risk of bias | ||
| Bias | Authors' judgement | Support for judgement |
| Random sequence generation (selection bias) | Unclear risk | Insufficient information to permit judgement of low risk or high risk |
| Allocation concealment (selection bias) | Unclear risk | Insufficient information to permit judgement of low risk or high risk |
| Blinding (performance bias and detection bias) All outcomes | Low risk | See below |
| Blinding of participants and personnel (performance bias) All outcomes | Low risk | This study was not blinded but the main outcome is not likely to be influenced by lack of blinding |
| Blinding of outcome assessment (detection bias) All outcomes | Low risk | This study was not blinded but the main outcome is not likely to be influenced by lack of blinding |
| Incomplete outcome data (attrition bias) All outcomes | Low risk | Withdrawals were balanced |
| Selective reporting (reporting bias) | Low risk | All outcomes in the paper have been reported |
| Other bias | Unclear risk | Insufficient information to permit judgement of low risk or high risk |
Loprinzi 1999a.
| Methods | Randomised, controlled, multicentre study | |
| Participants | 475 cancer pts a) 79 pts = 55 M + 30 F Mean age 66 yrs b) 159 pts = 99 M + 60 F Mean age 66 yrs | |
| Interventions | a) MA 800 mg/d
b) Dexamethasone 3 mg/d 1 month of treatment The median durations of study for patients receiving MA, fluoxymesterone and dexamethasone were 64, 54 and 57 days |
|
| Outcomes | Appetite Weight QoL (uni scale) | |
| Notes | QS = 2 Cachexia was defined as a history of losing at least 5 pounds within the previous 2 months (excluding perioperative weight loss) Quality of life, weight and body composition are assessed at baseline and monthly intervals |
|
| Risk of bias | ||
| Bias | Authors' judgement | Support for judgement |
| Random sequence generation (selection bias) | Unclear risk | Insufficient information to permit judgement of low risk or high risk |
| Allocation concealment (selection bias) | Unclear risk | Insufficient information to permit judgement of low risk or high risk |
| Blinding (performance bias and detection bias) All outcomes | High risk | See below |
| Blinding of participants and personnel (performance bias) All outcomes | High risk | Not a blinded study and the outcome was appetite |
| Blinding of outcome assessment (detection bias) All outcomes | High risk | Not a blinded study and the outcome was appetite |
| Incomplete outcome data (attrition bias) All outcomes | Low risk | After randomisation, 10 patients cancelled (before taking any study medication) and 11% were found to be ineligible, resulting in 475 assessable patients. For the effect of the study medications on patients’ appetites, 311 (66%) of the patients completed a baseline questionnaire and at least 1 follow‐up questionnaire. For the weight gain analyses, all patients with clinically apparent oedema or ascites were censored. Drop‐out rates were quite similar: 71 patients in the MA group, 70 in the dexamethasone group and 70 patients in the fluoxymesterone group. |
| Selective reporting (reporting bias) | Low risk | All outcomes in the paper have been reported |
| Other bias | Unclear risk | Insufficient information to permit judgement of low risk or high risk |
Loprinzi 1999b.
| Methods | Randomised, controlled, multicentre study | |
| Participants | 475 cancer adult patients with advanced incurable cancer (other than breast, prostate, ovarian or endometrial cancer) a) 79 pts = 54 M + 29 F Mean age 66 yrs b) 158 pts = 100 M + 58 F Mean age 67 yrs | |
| Interventions | a) MA 800 mg/d
b) Fluoxymesterone 20 mg/d 1 month of treatment |
|
| Outcomes | Appetite Weight QoL (uni scale) | |
| Notes | The median durations of study for patients receiving MA, fluoxymesterone and dexamethasone were 64, 54 and 57 days 1 month of treatment QS = 2 Cachexia was defined as a history of losing at least 5 pounds within the previous 2 months (excluding perioperative weight loss) Quality of life, weight and body composition are assessed at baseline and monthly intervals |
|
| Risk of bias | ||
| Bias | Authors' judgement | Support for judgement |
| Random sequence generation (selection bias) | Unclear risk | Insufficient information to permit judgement of low risk or high risk |
| Allocation concealment (selection bias) | Unclear risk | Insufficient information to permit judgement of low risk or high risk |
| Blinding (performance bias and detection bias) All outcomes | High risk | See below |
| Blinding of participants and personnel (performance bias) All outcomes | High risk | Not a blinded study and the outcome was appetite |
| Blinding of outcome assessment (detection bias) All outcomes | High risk | Not a blinded study and the outcome was appetite |
| Incomplete outcome data (attrition bias) All outcomes | Low risk | After randomisation, 10 patients cancelled (before taking any study medication) and 11% were found to be ineligible, resulting in 475 assessable patients. For the effect of the study medications on patients’ appetites, 311 (66%) of the patients completed a baseline questionnaire and at least 1 follow‐up questionnaire. For the weight gain analyses, all patients with clinically apparent oedema or ascites were censored. Drop‐out rates were quite similar: 71 patients in the MA group, 70 in the dexamethasone group and 70 patients in the fluoxymesterone group. |
| Selective reporting (reporting bias) | Unclear risk | All outcomes in the paper have been reported |
| Other bias | Unclear risk | Insufficient information to permit judgement of low risk or high risk |
Macbeth 1994.
| Methods | Randomised controlled trial, single‐blinded | |
| Participants | 75 patients with advanced lung cancer | |
| Interventions | 38 patients received MA (460 mg/daily) and 37 patients received prednisolone (15 mg/day) for a minimum of 8 weeks Medication was suspended if the patient achieved their ideal weight | |
| Outcomes | Weight, anorexia, quality of life | |
| Notes | Withdrawals were 28 in the MA and 20 in the placebo group; the major cause was deaths: 14 in the MA group and 7 in the placebo Cachexia was defined as loss of > 5% of ideal body weight Trial was stopped at 12 weeks QS: 2 |
|
| Risk of bias | ||
| Bias | Authors' judgement | Support for judgement |
| Random sequence generation (selection bias) | Unclear risk | Insufficient information to permit judgement of low risk or high risk |
| Allocation concealment (selection bias) | Unclear risk | Insufficient information to permit judgement of low risk or high risk |
| Blinding (performance bias and detection bias) All outcomes | Unclear risk | See below |
| Blinding of participants and personnel (performance bias) All outcomes | Unclear risk | Patients were not blinded but: “ an attempt was made to keep the clinicians unaware of which tablets the patients were taking…” |
| Blinding of outcome assessment (detection bias) All outcomes | Low risk | This study was not blinded but the main outcome is not likely to be influenced by lack of blinding |
| Incomplete outcome data (attrition bias) All outcomes | Unclear risk | Withdrawals were not balanced |
| Selective reporting (reporting bias) | Low risk | All the pre‐specified outcomes were reported in private files |
| Other bias | High risk | The trial was stopped early for safety at 12 weeks |
Madeddu 2012.
| Methods | Randomised Non‐inferiority Open‐label Single‐centre |
|
| Participants | 60 patients (56 evaluable) with cancer and a life expectancy ≥ 4 months 33 M/23 F Age (years) 62.6 ± 8.1 versus 66.3 ± 10.7 (MA group) |
|
| Interventions | a) Polyphenols + L‐carnitine 4 G/day + celecoxib 300 mg/day b) Polyphenols + L‐carnitine 4 G/day + celecoxib 300 mg/day + MA 320 mg/day Follow‐up 16 weeks (4 months) |
|
| Outcomes | Primary: lean body weight, physical activity Secondary: grip strength, 6‐minute walk test, fatigue, resting energy expenditure (REE), body weight, appetite by visual analogue scale, serum levels of IL‐6 and TNF‐a, plasma levels of C‐reactive protein, quality of life (EORTC QLQ‐C30) and Glasgow Prognostic Score Clinical: objective clinical response, progression‐free survival (PFS) and overall survival (OS) |
|
| Notes | Cachexia loss > 5% ideal or pre illness weight 56 patients evaluable: 4 deaths, 2 in each group QS = 2 |
|
| Risk of bias | ||
| Bias | Authors' judgement | Support for judgement |
| Random sequence generation (selection bias) | Low risk | Random number table |
| Allocation concealment (selection bias) | Unclear risk | Insufficient information to permit judgement of low risk or high risk |
| Blinding (performance bias and detection bias) All outcomes | Low risk | No blinding or incomplete blinding, but the outcome is not likely to be influenced by lack of blinding |
| Blinding of participants and personnel (performance bias) All outcomes | Low risk | No blinding or incomplete blinding, but the outcome is not likely to be influenced by lack of blinding |
| Blinding of outcome assessment (detection bias) All outcomes | Unclear risk | No blinding or incomplete blinding, but the outcome is not likely to be influenced by lack of blinding |
| Incomplete outcome data (attrition bias) All outcomes | Low risk | Missing outcome data balanced in numbers across intervention groups, with similar reasons for missing data across groups |
| Selective reporting (reporting bias) | Low risk | The study protocol is not available but it is clear that the published reports include all expected outcomes, including those that were pre‐specified |
| Other bias | Unclear risk | Insufficient information to permit judgement of low risk or high risk |
McMillan 1994.
| Methods | Randomised controlled trial, double‐blinded | |
| Participants | 38 cancer pts a) 20 pts Mean age 73 yrs b) 18 pts Mean age 70 yrs | |
| Interventions | a) MA 480 mg/d b) Placebo | |
| Outcomes | Weight | |
| Notes | 12 weeks of treatment QS = 3 | |
| Risk of bias | ||
| Bias | Authors' judgement | Support for judgement |
| Random sequence generation (selection bias) | Unclear risk | Insufficient information to permit judgement of low risk or high risk |
| Allocation concealment (selection bias) | Unclear risk | “ ...the randomisation code was not known to any of the investigators and was only broken at the end of the study” |
| Blinding (performance bias and detection bias) All outcomes | Low risk | See below |
| Blinding of participants and personnel (performance bias) All outcomes | Low risk | No data about blinding but unlikely could be influenced by lack of blinding |
| Blinding of outcome assessment (detection bias) All outcomes | Low risk | No data about blinding but unlikely could be influenced by lack of blinding |
| Incomplete outcome data (attrition bias) All outcomes | Low risk | The withdrawals were unbalanced but the authors explain all withdrawals |
| Selective reporting (reporting bias) | Low risk | All outcomes in the paper have been reported but we did not find this trial in the meta register of clinical trials or http://apps.who.int/trialsearch |
| Other bias | Unclear risk | Insufficient information to permit judgement of low risk or high risk |
Mwamburi 2004.
| Methods | Randomised controlled trial | |
| Participants | 40 patients with HIV that were receiving HAART (highly active antiretroviral therapy) | |
| Interventions | 20 patients MA (800 mg/day) versus 20 patients oxandrolone (20 mg/day) for 2 months | |
| Outcomes | Weight, side effects | |
| Notes | 2 patients dropped out at 2 months in the MA group and 4 in the oxandrolone group. Finally 18 patients and 15 patients were used for analysis in the MA and oxandrolone groups, respectively. Cachexia was defined as weight loss > 5% during HAART QS: 3 |
|
| Risk of bias | ||
| Bias | Authors' judgement | Support for judgement |
| Random sequence generation (selection bias) | Low risk | “Computed generated random numbers” |
| Allocation concealment (selection bias) | Unclear risk | Insufficient information to permit judgement of low risk or high risk |
| Blinding (performance bias and detection bias) All outcomes | Low risk | See below |
| Blinding of participants and personnel (performance bias) All outcomes | Low risk | This study was not blinded but the main outcome is not likely to be influenced by lack of blinding |
| Blinding of outcome assessment (detection bias) All outcomes | Low risk | This study was not blinded but the man outcome is not likely to be influenced by lack of blinding |
| Incomplete outcome data (attrition bias) All outcomes | Unclear risk | Authors describe drop‐outs but not the number in each arm |
| Selective reporting (reporting bias) | Low risk | All outcomes in the paper have been reported |
| Other bias | Unclear risk | Insufficient information to permit judgement of low risk or high risk |
Oster 1994.
| Methods | Double‐blind, randomised, controlled, multicentre (13) | |
| Participants | 100 AIDS pts
a) 52 pts = 50 M + 2 F
Mean age 40 yrs
b) 48 pts = 47 M + 1 F
Mean age 40 yrs Mean age 40.00 ± 14 in placebo group and 40 ± 7.2 in MA group |
|
| Interventions | a) MA 800 mg/d suspension b) Placebo, suspension | |
| Outcomes | Weight Appetite Triceps skinfold Mid‐arm circumference Performance status KI |
|
| Notes | 12 weeks of treatment
QS = 4 Cachexia was defined as loss of 10% or more of ideal body weight |
|
| Risk of bias | ||
| Bias | Authors' judgement | Support for judgement |
| Random sequence generation (selection bias) | Unclear risk | Insufficient information to permit judgement of low risk or high risk |
| Allocation concealment (selection bias) | Unclear risk | Insufficient information to permit judgement of low risk or high risk |
| Blinding (performance bias and detection bias) All outcomes | Low risk | See below |
| Blinding of participants and personnel (performance bias) All outcomes | Low risk | "All patients received bottles containing 20‐mL portions of a liquid, lemon‐lime flavoured suspension of either placebo or 800 mg of megestrol acetate (Megace; Bristol‐Myers Squibb, Princeton, New Jersey). Patients were instructed to take the drug orally once daily, 1 hour before or 2 hours after breakfast. Patients and clinicians were blinded to treatment groups throughout the study". |
| Blinding of outcome assessment (detection bias) All outcomes | Unclear risk | Main outcome was weight and well being |
| Incomplete outcome data (attrition bias) All outcomes | High risk | Withdrawals were balanced (27 in MA and 22 in placebo group) |
| Selective reporting (reporting bias) | Low risk | All outcomes were available |
| Other bias | Unclear risk | Insufficient information to permit judgement of low risk or high risk |
Sancho‐Cuesta 1993.
| Methods | Randomised controlled trial | |
| Participants | Patients with advanced cancer, anorexia and weight loss | |
| Interventions | 50 patients MA 160 mg daily versus 50 patients 320 mg daily for 24 weeks | |
| Outcomes | Weight gain, side effects | |
| Notes | Loss to follow‐up not described Cachexia was not defined QS: 1 |
|
| Risk of bias | ||
| Bias | Authors' judgement | Support for judgement |
| Random sequence generation (selection bias) | Unclear risk | Insufficient information to permit judgement of low risk or high risk |
| Allocation concealment (selection bias) | Unclear risk | Insufficient information to permit judgement of low risk or high risk |
| Blinding (performance bias and detection bias) All outcomes | Low risk | This study was not blinded |
| Blinding of participants and personnel (performance bias) All outcomes | Low risk | The main outcome was weight. This is not a blinded study but the main outcome is not likely to be influenced by lack of blinding. |
| Blinding of outcome assessment (detection bias) All outcomes | Low risk | This is not a blinded study but the main outcome is not likely to be influenced by lack of blinding |
| Incomplete outcome data (attrition bias) All outcomes | Unclear risk | Loss to follow‐up not described |
| Selective reporting (reporting bias) | Low risk | All the outcomes described in the study were reported |
| Other bias | Unclear risk | Report only from old conference proceeding |
Schmoll 1991.
| Methods | Randomised controlled trial, not blinded | |
| Participants | 55 patients with advanced cancer Placebo 61 years mean ages MA low‐dose 50 years mean ages MA high‐dose 58 years mean ages |
|
| Interventions | 18 patients received high‐dose MA (960 mg/daily) versus 20 patients low‐dose MA (480 mg/daily) versus 17 patients placebo for 8 weeks | |
| Outcomes | Weight, appetite improvement, adverse events | |
| Notes | Losses to follow‐up were 9 in the placebo group, 5 in the low‐dose group and 7 in the high‐dose group Deaths: 8, 4 and 4 placebo, high‐dose and low‐dose Not evaluable: 1, 1 and 3 respectively Cachexia was defined as loss of > 5% of ideal body weight QS = 2 |
|
| Risk of bias | ||
| Bias | Authors' judgement | Support for judgement |
| Random sequence generation (selection bias) | Unclear risk | Insufficient information to permit judgement of low risk or high risk |
| Allocation concealment (selection bias) | Unclear risk | Insufficient information to permit judgement of low risk or high risk |
| Blinding (performance bias and detection bias) All outcomes | Low risk | This study was not blinded |
| Blinding of participants and personnel (performance bias) All outcomes | Low risk | The main outcome was weight. This is not a blinded study but the main outcome is not likely to be influenced by lack of blinding |
| Blinding of outcome assessment (detection bias) All outcomes | Low risk | This is not a blinded study but the main outcome is not likely to be influenced by lack of blinding |
| Incomplete outcome data (attrition bias) All outcomes | High risk | Reasons for missing outcome data are likely to be related to true outcome, with either imbalance in numbers or reasons for missing data across intervention groups |
| Selective reporting (reporting bias) | Unclear risk | All the pre‐specified outcome were published |
| Other bias | Unclear risk | Insufficient information to permit judgement of low risk or high risk |
Schmoll 1992.
| Methods | Randomised controlled trial, not blinded | |
| Participants | 91 cancer pts a) 29 pts = 18 M + 11 F Mean age 60 yrs (35 to 79) b) 28 pts = 16 M + 12 F Mean age 58 yrs (29 to 78) c) 34 pts = 25 M + 9 F Mean age 60 yrs (41 to 80) | |
| Interventions | a) MA 960 mg/d (high‐dose) b) Placebo c) MA 480 mg/d (low‐dose) | |
| Outcomes | Weight, appetite improvement, adverse events | |
| Notes | a) Median duration 8 weeks of treatment
b) Median duration 6 weeks
c) Median duration 7 weeks
QS = 2 Withdrawals were deaths, stopped treatment due to size of capsules, and increased appetite after 14 days with lack of motivation to continue the study, but there was no description of which groups they were from Cachexia was defined as loss of > 5% of ideal body weight |
|
| Risk of bias | ||
| Bias | Authors' judgement | Support for judgement |
| Random sequence generation (selection bias) | Unclear risk | Insufficient information to permit judgement of low risk or high risk |
| Allocation concealment (selection bias) | Unclear risk | Insufficient information to permit judgement of low risk or high risk |
| Blinding (performance bias and detection bias) All outcomes | Low risk | This study was not blinded |
| Blinding of participants and personnel (performance bias) All outcomes | Low risk | The main outcome was weight. This is not a blinded study but the main outcome is not likely to be influenced by lack of blinding |
| Blinding of outcome assessment (detection bias) All outcomes | Low risk | This is not a blinded study but the main outcome is not likely to be influenced by lack of blinding |
| Incomplete outcome data (attrition bias) All outcomes | High risk | Withdrawals were high: 44% in the placebo group and 30% in each of the MA groups, but the causes in each group were not described |
| Selective reporting (reporting bias) | Low risk | All the pre‐specified outcomes were published |
| Other bias | Unclear risk | Insufficient information to permit judgement of low risk or high risk |
Summerbell 1992.
| Methods | Randomised controlled trial | |
| Participants | 14 patients with HIV infection | |
| Interventions | MA 40 mg daily which was increased by 40 mg daily on alternate weeks to a maximum of 160 mg daily if there was no response in weight, or cyproheptadine 12 mg daily for a period of 3 months | |
| Outcomes | Weight, sexual thoughts, arousal and orgasms | |
| Notes | The study was discontinued after 14 patients were enrolled Cachexia was defined as weight loss < 5 kg QS: 2 |
|
| Risk of bias | ||
| Bias | Authors' judgement | Support for judgement |
| Random sequence generation (selection bias) | Unclear risk | Insufficient information to permit judgement of low risk or high risk |
| Allocation concealment (selection bias) | Unclear risk | Insufficient information to permit judgement of low risk or high risk |
| Blinding (performance bias and detection bias) All outcomes | Low risk | See below |
| Blinding of participants and personnel (performance bias) All outcomes | Low risk | The main outcome was weight. This is not a blinded study but the main outcome is not likely to be influenced by lack of blinding |
| Blinding of outcome assessment (detection bias) All outcomes | Low risk | The main outcome was weight. This is not a blinded study but the main outcome is not likely to be influenced by lack of blinding |
| Incomplete outcome data (attrition bias) All outcomes | Low risk | All patients were studied |
| Selective reporting (reporting bias) | Low risk | All outcomes were reported |
| Other bias | High risk | The study was discontinued after 14 patients were enrolled, because recruitment was too slow and the majority of patients had diarrhoea or overt infections |
Tchekmedyian 1992.
| Methods | Double‐blind, randomised controlled trial | |
| Participants | 89 cancer pts a) 49 pts = 28 M + 9 F Mean age 63 yrs b) 40 pts = 18 M + 12 F Mean age 64 yrs | |
| Interventions | a) MA 1600 mg/d, 10 tablets a day, in divided doses b) Placebo 10 tablets | |
| Outcomes | Appetite, categorical scale of 5 levels QoL LAS, 29 items Weight Triceps skinfold Mid‐arm circumference | |
| Notes | 6 weeks of treatment
QS = 4 Cachexia was defined as weight loss of < 5% Patients were considered valuable for analysis if they had at least baseline and 1 follow‐up evaluation a month, so 30/40 patients in placebo group and 37/49 patients in MA group. The withdrawals were balanced and included 1 lost to follow‐up in the placebo group and 0 in the MA group, cancer progression in 4 and 6 in the placebo and MA group, deep vein thrombosis 0 in the placebo and 2 in the MA group. |
|
| Risk of bias | ||
| Bias | Authors' judgement | Support for judgement |
| Random sequence generation (selection bias) | Low risk | 6 tables of randomisation were generated |
| Allocation concealment (selection bias) | Low risk | Central randomisation office |
| Blinding (performance bias and detection bias) All outcomes | Low risk | See below |
| Blinding of participants and personnel (performance bias) All outcomes | Low risk | The main outcome was weight. This is a blinded study and the main outcome is not likely to be influenced by lack of blinding |
| Blinding of outcome assessment (detection bias) All outcomes | Low risk | The main outcome was weight. This is a blinded study and the main outcome is not likely to be influenced by lack of blinding |
| Incomplete outcome data (attrition bias) All outcomes | Low risk | The withdrawals were balanced across groups |
| Selective reporting (reporting bias) | Low risk | All the results were available |
| Other bias | Unclear risk | Insufficient information to permit judgement of low risk or high risk |
Timpone 1997.
| Methods | Randomised, controlled, multicentre (9) | |
| Participants | 50 HIV pts a) 12 pts = 10 M + 2 F Mean age 46 yrs b) 12 pts = 10 M + 2 F Mean age 39 yrs c) 13 pts = 12 M + 1 F Mean age 38 yrs d) 13 pts = 12 M + 1 F Mean age 40 yrs | |
| Interventions | a) MA 750 mg/d, tablets x 1 b) Dronabinol 5 mg/d, tablets x 2 c) MA 750 mg/d, tablets x 1 plus dronabinol 5 mg/d, tablets x 2 d) MA 250 mg/d plus dronabinol 5 mg/d, 2 tablets | |
| Outcomes | Height, weight and vital signs, Karnofsky performance status, complete blood count (CBC), CD4+ T lymphocyte count, chemistry panel, visual analogue scale for hunger (VASH) 3 times per day before meals, visual analogue scale for mood (VASM) at noon, visual analogue scale for nausea (VASN) at noon, and functional assessment for HIV (FAHI) questionnaire | |
| Notes | 12 weeks of treatment
QS = 3 Losses to follow‐up were 6, 2, 5, 7 in Arm 1, Arm 2, Arm 3, and Arm 4 respectively Cachexia was defined as loss of weight of at least 10% or BMI of < 20.5 kg/m2 for age 18 to 34 years or < 22.5 for age > 35 years (the suggested BMI ranges are 19 to 24, 20 to 25, 21 to 26 and 22 to 27 kg/m2 for age categories 18 to 24, 25 to 34, 35 to 44 and 45 to 54 years, respectively) |
|
| Risk of bias | ||
| Bias | Authors' judgement | Support for judgement |
| Random sequence generation (selection bias) | Unclear risk | Insufficient information to permit judgement of low risk or high risk |
| Allocation concealment (selection bias) | Low risk | Patients were sequentially enrolled and the study was performed in an outpatient setting |
| Blinding (performance bias and detection bias) All outcomes | Low risk | See below |
| Blinding of participants and personnel (performance bias) All outcomes | Low risk | This is an open‐label study but weight was the main outcome and is not likely to be influenced by lack of blinding |
| Blinding of outcome assessment (detection bias) All outcomes | Low risk | This is an open‐label study but weight was the main outcome and is not likely to be influenced by lack of blinding |
| Incomplete outcome data (attrition bias) All outcomes | Low risk | Missing outcome data balanced |
| Selective reporting (reporting bias) | Low risk | All the results were available |
| Other bias | Unclear risk | Insufficient information to permit judgement of low risk or high risk |
Ulutin 2002.
| Methods | Randomised controlled trial | |
| Participants | 119 cancer pts a) 59 pts = 48 M + 11 F Mean age 56 (range 38 to 72) b) 60 pts = 47 M + 13 F Mean age 58 (range 40 to 74) | |
| Interventions | a) MA 160 mg/d orally
b) MA 320 mg/d orally in 2 divided doses 12 hrs apart 3 months duration treatment |
|
| Outcomes | Weight
Appetite (Symptom Distress Scale)
QoL (10‐point scale) based on patient statements Biochemical levels and side effects |
|
| Notes | QS = 2 Cachexia was defined as weight loss > 10% in the last 6 months Only 1 withdrawal was described |
|
| Risk of bias | ||
| Bias | Authors' judgement | Support for judgement |
| Random sequence generation (selection bias) | Unclear risk | Insufficient information to permit judgement of low risk or high risk |
| Allocation concealment (selection bias) | Unclear risk | Insufficient information to permit judgement of low risk or high risk |
| Blinding (performance bias and detection bias) All outcomes | Low risk | See below |
| Blinding of participants and personnel (performance bias) All outcomes | Low risk | The main outcome was weight. This is not a blinded study but the main outcome is not likely to be influenced by lack of blinding. |
| Blinding of outcome assessment (detection bias) All outcomes | Low risk | The main outcome was weight. This is not a blinded study but the main outcome is not likely to be influenced by lack of blinding. |
| Incomplete outcome data (attrition bias) All outcomes | Low risk | 1 patient discontinued treatment due to gastrointestinal intolerance on MA 320 mg |
| Selective reporting (reporting bias) | Low risk | All the results were available |
| Other bias | Unclear risk | Insufficient information to permit judgement of low risk or high risk |
Vadell 1998.
| Methods | Double‐blind, randomised, controlled, multicentre (9) | |
| Participants | 150 cancer pts a) 49 pts = 38 M + 11 F Mean age 66 yrs b) 51 pts = 42 M + 9 F Mean age 63 yrs c) 50 pts = 31 M + 19 F Mean age 65 yrs | |
| Interventions | a) MA 480 mg/d, 3 tablets b) Placebo, 3 tablets c) MA 160 mg/d, 1 tablet + placebo 2 tablets | |
| Outcomes | Weight
Mid‐arm circumference
Triceps skinfold
QoL Performance status Karnofsky Index |
|
| Notes | 12 weeks of treatment
QS = 4 Follow‐up 12 weeks; 64 patients remain at 12 weeks. Losses were homogeneously distributed among the 3 groups (16 in the placebo group, 13 in MA 160 mg and 14 in 480 mg/daily) Cachexia was defined as weight loss < 5% |
|
| Risk of bias | ||
| Bias | Authors' judgement | Support for judgement |
| Random sequence generation (selection bias) | Unclear risk | Insufficient information to permit judgement of low risk or high risk |
| Allocation concealment (selection bias) | Unclear risk | Insufficient information to permit judgement of low risk or high risk |
| Blinding (performance bias and detection bias) All outcomes | Low risk | See below |
| Blinding of participants and personnel (performance bias) All outcomes | Low risk | All participants received 3 tablets to assure the blinding and the main outcome was weight |
| Blinding of outcome assessment (detection bias) All outcomes | Low risk | The main outcome was weight |
| Incomplete outcome data (attrition bias) All outcomes | High risk | Only 64 patients remained at 12 weeks but the losses were described as balanced in all groups |
| Selective reporting (reporting bias) | Low risk | All the outcomes were described |
| Other bias | Unclear risk | Insufficient information to permit judgement of low risk or high risk |
Von Roenn 1994.
| Methods | Double‐blind, randomised, controlled, multicentre | |
| Participants | 271 patients with AIDS who had substantial weight loss and anorexia 270 M and 1 F a) 75 pts = 75 M Mean age 38 yrs b) 75 pts = 75 M Mean age 39 yrs c) 82 pts = 81 M + 1 F Mean age 39 yrs d) 38 pts = 38 M Mean age 38 yrs |
|
| Interventions | a) MA 800 mg/d, suspension b) MA 400 mg/d, suspension c) MA 100 mg/ d, suspension d) Placebo, suspension | |
| Outcomes | Weight Appetite Mid‐arm circumference Triceps skinfold QoL by linear analogue self assessment questionnaire | |
| Notes | 12 weeks of treatment
QS = 2 Clinically significant weight loss was defined as a decrease of 20% from usual body weight, or as 10% below ideal body weight for patients whose premorbid weight was greater than ideal body weight, or as a loss of 10% or more of usual body weight for those whose premorbid weight was below ideal body weight. Patients with stable weight or excessive weight gain could be removed from the study after completing the 12‐week trial period. Patients otherwise continued on their assigned treatment as long as they did not have additional weight loss of more than 10% of their baseline body weight. 75 were not evaluable for the efficacy analysis (27 patients did not meet the premorbid weight loss requirement, 46 patients had no follow‐up visits and 7 patients had only 1 follow‐up visit. Authors do not describe how many patients were in each arm. |
|
| Risk of bias | ||
| Bias | Authors' judgement | Support for judgement |
| Random sequence generation (selection bias) | Unclear risk | Insufficient information to permit judgement of low risk or high risk |
| Allocation concealment (selection bias) | Unclear risk | Insufficient information to permit judgement of low risk or high risk |
| Blinding (performance bias and detection bias) All outcomes | Low risk | See below |
| Blinding of participants and personnel (performance bias) All outcomes | Low risk | The main outcome was weight. This is a blinded study and the main outcome is not likely to be influenced by lack of blinding |
| Blinding of outcome assessment (detection bias) All outcomes | Low risk | The main outcome was weight. This is a blinded study and the main outcome is not likely to be influenced by lack of blinding |
| Incomplete outcome data (attrition bias) All outcomes | Low risk | No data on balance of withdrawals in each arm |
| Selective reporting (reporting bias) | Low risk | All the results were available |
| Other bias | Unclear risk | Insufficient information to permit judgement of low risk or high risk |
Wanke 2007.
| Methods | Randomised controlled trial, open‐label | |
| Participants | 63 HIV‐infected adults with weight loss in South Africa, India and the United States | |
| Interventions | MA concentrated suspension (575 mg/5 ml; MA‐CS) was compared with traditional MA oral suspension (800 mg/20 ml; MA‐OS) 12‐week trial |
|
| Outcomes | Body weight, quality of life including appetite, safety | |
| Notes | Cachexia was defined as “body weight of less than 90% of the ideal body weight from the Metropolitan Height and Weight Table (1999 version)” QS: 3 |
|
| Risk of bias | ||
| Bias | Authors' judgement | Support for judgement |
| Random sequence generation (selection bias) | Unclear risk | Insufficient information to permit judgement of low risk or high risk |
| Allocation concealment (selection bias) | Low risk | Central allocation. This was a multicentre study. |
| Blinding (performance bias and detection bias) All outcomes | Low risk | See below |
| Blinding of participants and personnel (performance bias) All outcomes | Low risk | Weight was the main outcome. This is not a blinded study but the main outcome is not likely to be influenced by lack of blinding |
| Blinding of outcome assessment (detection bias) All outcomes | Low risk | Weight was the main outcome. This is not a blinded study but the main outcome is not likely to be influenced by lack of blinding |
| Incomplete outcome data (attrition bias) All outcomes | Low risk | 2 participants in 575 mg MA group withdrew because of an adverse event and 3 participants in the MA 800 mg because an adverse event |
| Selective reporting (reporting bias) | Low risk | All the results were available |
| Other bias | Unclear risk | Insufficient information to permit judgement of low risk or high risk |
Weisberg 2002.
| Methods | Double‐blind, randomised, controlled, multicentre (18) | |
| Participants | 145 COPD pts a) 72 pts = 46 M + 26 F Mean age 68 yrs b) 73 pts = 45 M + 28 F Mean age 66 yrs | |
| Interventions | a) MA 800 mg/d, suspension b) Placebo, suspension | |
| Outcomes | Weight Triceps skinfold Mid‐arm circumference Appetite | |
| Notes | 8 weeks of treatment
QS = 3 Cachexia was defined as "Underweight COPD patients (< 95% of ideal body weight) > 40 years of age in a stable phase of their disease were recruited at 18 study centres" |
|
| Risk of bias | ||
| Bias | Authors' judgement | Support for judgement |
| Random sequence generation (selection bias) | Unclear risk | Insufficient information to permit judgement of low risk or high risk |
| Allocation concealment (selection bias) | Unclear risk | Insufficient information to permit judgement of low risk or high risk |
| Blinding (performance bias and detection bias) All outcomes | Low risk | See below |
| Blinding of participants and personnel (performance bias) All outcomes | Low risk | The main outcome was a functional test (spirometry) |
| Blinding of outcome assessment (detection bias) All outcomes | Low risk | The main outcome was a functional test (spirometry) |
| Incomplete outcome data (attrition bias) All outcomes | Low risk | 17 withdrawals but balanced in 2 arms |
| Selective reporting (reporting bias) | Low risk | All the results were available |
| Other bias | Unclear risk | Insufficient information to permit judgement of low risk or high risk |
Yeh 2000.
| Methods | Double‐blind randomised controlled trial | |
| Participants | 69 patients with geriatric cachexia a) 36 pts = 35 M + 1 F Mean age 76 yrs b) 33 pts = 31 M + 2 F Mean age 76 yrs | |
| Interventions | a) MA 800 mg/d, suspension
b) Placebo, suspension 12 weeks |
|
| Outcomes | Weight
Appetite Sense of well being (SOWB), enjoyment of life, laboratory nutrition parameter and adverse events were measured |
|
| Notes | Follow_up 13 weeks
QS = 3 Cachexia was defined as experienced weight loss > 5% of their usual body weight during the previous 3 months, or had a body weight of 20% below their ideal body weight (based on the tables of the Metropolitan Life Insurance Company and the Gerontology Research Center) |
|
| Risk of bias | ||
| Bias | Authors' judgement | Support for judgement |
| Random sequence generation (selection bias) | Unclear risk | Insufficient information to permit judgement of low risk or high risk |
| Allocation concealment (selection bias) | Unclear risk | Insufficient information to permit judgement of low risk or high risk |
| Blinding (performance bias and detection bias) All outcomes | Low risk | See below |
| Blinding of participants and personnel (performance bias) All outcomes | Low risk | The main outcome was weight. This is a blinded study and the main outcome is not likely to be influenced by lack of blinding |
| Blinding of outcome assessment (detection bias) All outcomes | Low risk | The main outcome was weight. This is a blinded study and the main outcome is not likely to be influenced by lack of blinding |
| Incomplete outcome data (attrition bias) All outcomes | Low risk | The withdrawals were balanced |
| Selective reporting (reporting bias) | Low risk | All the results were available |
| Other bias | Unclear risk | Insufficient information to permit judgement of low risk or high risk |
BMI: body mass index COPD: chronic obstructive pulmonary disease d: day DRO: dronabinol EPA: eicosapentaenoic acid F: female FAACT: functional assessment of anorexia/cachexia therapy HAART: highly active antiretroviral therapy KI: Karnofsky Index LASA: linear analogue self assessment M: male MA: megestrol acetate
NCCTG: The North Central Cancer Treatment Group pts: patientsPS: Performance Status QoL: quality of life QS: quality score (Oxford Quality Scale) SD: standard deviation SSA: subjective sense of appetiteTIQ: Therapy Impact Questionnaire
VAS: visual analogue scale yrs: years
Characteristics of excluded studies [ordered by study ID]
| Study | Reason for exclusion |
|---|---|
| Aguilera 2001 | This study is a review |
| Aisner 1988 | This study is a review |
| Anonymous 1995 | This study is a review |
| Ansfield 1982 | Prospective study |
| Argiles 2007 | This study is a review |
| Argiles 2008 | This study is a review |
| Argiles 2010 | This study is a review |
| Behl 2007 | This study is a review |
| Bossola 2006 | This study is a review |
| Bossola 2009 | This study is a review |
| Bruera 1990 | This is a cross‐over study |
| Bruera 1992a | This study is a review |
| Bruera 1998 | This is a cross‐over study |
| Bruera 1998a | This study is a review |
| Cardona 2006 | This study is a review |
| Carroll 2007 | This study is a systematic review |
| Cat 1994 | This study is a review |
| Celik 2009 | This study is a review |
| Chen 1997 | This is a RCT of patients with head and neck cancers but only 18% of them were underweight; moreover 11% were overweight |
| Chlebowski 1996 | This study is a review |
| Costero 2004 | This is just a cohort study without any comparison group |
| Cruz 1990 | Patients not described as 'patients with cachexia' |
| Cuerda 1998 | This study is a review |
| Desport 2000 | This study is a clinical guideline |
| Elovic 2000 | This study is a review |
| Erkurt 2000 | This study included a small proportion of patients without weight loss in the previous 6 months. In addition, these patients were not balanced in both groups. 33 patients received oral nutrition support: 27% in the MA and 72% in the placebo group |
| Farmer 2005 | Patients not described as 'patients with cachexia' |
| Farrar 1999 | This study is a review |
| Fearon 2002 | This study is a review |
| Fossati 1998 | This study is a systematic review of treatment for metastatic breast cancer |
| Fox 2009 | This study is a review |
| Freyer 1996 | This study is a review |
| Freyer 1996a | This study is a review |
| Gaducci 2001 | This study is a review |
| Garg 2010 | This study is a systematic review |
| Gullett | This study is a review |
| Hanson 2011 | This study is a systematic review |
| Haren 2006 | This study is a review |
| Hellerstein 1990 | This study is a review |
| Hoffman 1998 | This is not a trial: cohort study |
| Inui 2002 | This study is a review |
| Jatoi 2001 | This study is a review |
| Kalantar‐Zadeh 2008 | This study is a review |
| Karcic 2002 | This study is a review |
| Khojasteh 1996 | This is a small clinical trial that compared combined nortriptyline (25 to 50 mg Q HS PO) + MA (400 mg BID PO) versus MA (400 mg BID PO) |
| Krznaric 2007 | This is a clinical guideline |
| Kumar 2010 | This study is a review |
| Lai 1994 | Patients did not have cachexia or any weight loss |
| Lelli 2003 | This study is a review |
| Lesniak 2008 | This study is a systematic review |
| Loprinzi 1992 | This study is a review |
| Loprinzi 1992a | This study is a review |
| Loprinzi 1993 | This study Is not a trial, is a cohort study without any control group |
| Loprinzi 1995 | This study is a review |
| Mak 2007 | This study is a review |
| Malone 2005 | This study is a review |
| Maltoni 2001a | This study is a systematic review |
| Mantovani 1998a | This study is a review |
| Mantovani 2001 | This study is a review |
| Mantovani 2008 | This is a RCT with 5 arms; in one of them patients received medroxyprogesterone acetate or megestrol acetate |
| Mantovani 2010 | This is a clinical abstract in proceedings |
| Marchand 2000 | This is a RCT cross‐over study |
| Mateen 2006 | This study is a review |
| McHugh 2011 | This study is a review |
| McMillan 1999 | This is a trial that compared MA plus placebo versus MA plus ibuprofen in patients with gastrointestinal cancer with weight loss |
| McQuellon 2002 | Patients not described as 'patients with cachexia' |
| Monfared 2009 | Patients not described as 'patients with cachexia' and the outcome was levels of albumin |
| Morley 2002 | This study is a review |
| Morán 1998 | This is a trial with malnourished post necrotic (VHC) patients, but cachexia was not described. This is an abstract without any data on the placebo group for appetite. |
| Mulligan 2007 | This study compared patients allocated to receive megestrol acetate plus testosterone versus placebo |
| Muss 1990 | Patients were not described as having cachexia‐anorexia related to cancer. This is a trial in breast cancer. |
| Navari 2010 | This is a RCT that compared MA plus olanzapine versus MA |
| Nelson 2002 | This is not a trial: cohort study without comparison group |
| Osoba 1994 | All patients received MA, without a control group |
| Pardo 2003a | Patients were not described as 'patients with cachexia' |
| Pardo 2006 | Patients were not described as 'patients with cachexia' |
| Pascual 2004 | This study is a systematic review |
| Pruthi 2007 | This study is a clinical guideline |
| Reuben 2005 | Patients were older persons (mean age 83) discharged from an acute hospital with fair or poor appetite |
| Ross 2001 | This study is a review |
| Rowland 1996 | This is a trial that compared chemotherapy in cancer patients in both groups with MA versus placebo in patients who started chemotherapy for small cell lung cancer. Patients were not described as 'patients with cachexia/anorexia'. Moreover most of them (85%) had weight loss < 10%. This study was included in the previous review. |
| Ruiz‐Garcia 2002 | This study is a systematic review about megestrol and weight gain in cancer patients |
| Sanz‐Ortiz 2004 | This study is a review |
| Schacter 1989 | This study is a review |
| Schmoll 1992a | This study is a review |
| Simmons 2004 | Patients not described as 'patients with cachexia' |
| Skarlos 1993 | This is a cohort study |
| Spaulding 1989 | This study is a review |
| Sullivan 2007 | Patients were older than 65 with functional decline without any criteria for cachexia |
| Tchekmedyian 1986 | This is not a trial and patients were women with advanced breast cancer |
| Tchekmedyian 1990 | This is not a trial |
| Tchekmedyian 1991 | This study is a review |
| Tchekmedyian 1993 | This study is a review |
| Tchekmedyian 1993a | This study is a review |
| Tchekmedyian 2006 | This study is a review |
| Thomas 2006 | This study is a clinical guideline |
| Tisdale 1993 | This study is a review |
| Tisdale 2006 | This study is a review |
| Tomiska 2003 | This is a RCT that compared 2 doses of MA in cancer anorexia/cachexia syndrome, but results were described as improvement of appetite, gain of weight etc. in all evaluated patients |
| Vigano 1994 | This study is a review |
| von Haehling 2009 | This study is a review of cardiac cachexia |
| Von Roenn 1994a | This study is a review |
| Vyzula 1997 | This study is a review |
| Westman 1999 | This is a trial in malnourished cancer patients but 1/3 of patients in the MA and placebo group had not developed cachexia |
| Yavuzsen 2005 | This study is a systematic review |
| Yeh 2004 | This study involved the same participants as Yeh 2000, in which they measured different outcomes |
| Yeh 2006 | This study is a review |
| Yeh 2007 | This study is a review |
| Yeh 2010 | Patients not described as 'patients with cachexia' |
| Zeca 1995 | This is a trial that included patients with cancer and anorexia. Cachexia was not needed. This is a small trial, published in proceedings, with two phases. In first phase patients received 320 mg/d of MA. In the second phase all patients received different dosages of MA according to the response to treatment. |
BID: twice a day d: day MA: megestrol acetate PO: orally RCT: randomised controlled trial
Contributions of authors
VR put forward the idea of updating the review. JH performed the search. VR located trials. EL and VR applied the inclusion/exclusion criteria. RC and JLG extracted the data and appraised the quality of the trials. Data entry into RevMan was carried out by SB. VR and SB produced the first draft. All of the team wrote and approved the final draft.
Sources of support
Internal sources
Instituto de Investigaciones Epidemiológicas, Academia Nacional de Medicina de Buenos Aires, Argentina.
External sources
No sources of support supplied
Declarations of interest
No one involved in this review has any conflict of interest.
Stable (no update expected for reasons given in 'What's new'), comment added to review
References
References to studies included in this review
Batterham 2001 {published data only}
- Batterham M, Garsia R. Randomised prospective medium term comparison of megestrol acetate, nandrolone decanoate and dietary therapy alone for HIV associated weight loss [abstract]. Australasian Society for HIV Medicine 1997;9:91. [Google Scholar]
- Batterham MJ, Garsia R. A comparison of megestrol acetate, nandrolone decanoate and dietary counselling for HIV associated weight loss. International Journal of Andrology 2001;24(4):232‐40. [DOI] [PubMed] [Google Scholar]
Beller 1997 {published data only}
- Beller E, Tattersall M. Improved quality of life with megestrol acetate in patients with endocrine‐insensitive advanced cancer: a randomised placebo‐controlled trial. Annals of Oncology 1997;8:277‐83. [DOI] [PubMed] [Google Scholar]
Casado 2008 {unpublished data only}
- Casado Herráez A. Phase II randomized study of two dose levels of megestrol acetate versus placebo for the treatment of anorexia and cachexia in patients with locoregional advanced or metastatic cancer [Estudio de fase II randomizado de dos niveles posológicos de acetato de Megestrol versus placebo para el tratamiento de la anorexia y la caquexia en pacientes con cáncer locoregional avanzado o metastásico. (Tesis de Doctorado ‐ Universidad Complutense Madrid)]. Available from http://eprints.ucm.es/8119/1/T30450.pdf 2008 (accessed 24 December 2011).
De Conno 1998 {published data only}
- Conno F, Martini C. Megestrol acetate for anorexia in patients with far‐advanced cancer: a double‐blind controlled clinical trial. European Journal of Cancer 1998;34:1705‐9. [DOI] [PubMed] [Google Scholar]
Eubanks 2002 {published data only}
- Eubanks V, Koppersmith N. Effects of megestrol acetate on weight gain, body composition, and pulmonary function in patients with cystic fibrosis. Journal of Pediatrics 2002;140:439‐44. [DOI] [PubMed] [Google Scholar]
Feliu 1992 {published data only}
- Feliu J, Gonzalez‐Baron M. Usefulness of megestrol acetate in cancer cachexia and anorexia. A placebo controlled study. American Journal of Clinical Oncology 1992;15:436‐40. [DOI] [PubMed] [Google Scholar]
- Gonzalez Baron M, Feliu J, Zamora P, Artal A, Garrido P, Chacon I. Usefulness of megestrol acetate on cancer cachexia: a double blind randomized study. Annals of Oncology 1990;1:29‐31. [Google Scholar]
Fietkau 1996 {published data only}
- Fietkau R, Riepl M. Supportive treatment with megestrol acetate during radio (chemo) therapy. A randomised trial. Strahlentherapie und Onkologie 1996;172:162‐8. [PubMed] [Google Scholar]
- Fietkau R, Riepl M, Kettner H, Hinke A, Sauer R. Supportive use of megestrol acetate in patients with head and neck cancer during radio(chemo)therapy. European Journal of Cancer 1997;33:75‐9. [CN‐00137738] [DOI] [PubMed] [Google Scholar]
Gambardella 1998 {published data only}
- Gambardella A, Pesce L, Bolognino P, Lombardi G, Barbieri M, Rinaldi C. Megestrol acetate prevents cachexia in elderly cancer patient. Annals of Oncology 1998;9(Suppl 3):72. [CN‐00305911] [Google Scholar]
- Gambardella A, Pesce L, Lammardo AM, Lombardi G, Barbagallo M, Tirelli P, et al. New factors involvement in elderly cancer patients with anorexia/cachexia syndrome role of megestrol acetate. Annals of Oncology 2000;9 Suppl 2:22. [Google Scholar]
Gebbia 1996 {published data only}
- Gebbia V, Testa A. Prospective randomised trial of two dose levels of megestrol acetate in the management of anorexia‐cachexia syndrome in patients with metastatic cancer. British Journal of Cancer 1996;73:1576‐80. [DOI] [PMC free article] [PubMed] [Google Scholar]
Giacosa 1997 {published data only}
- Giacosa A, Frascio F, Sukkar SG, Costantini M, Baracco G, Capelli M. Changes of nutritional and psychological status after megestrol acetate treatment of cancer cachexia. Rivista Italiana Di Nutrizione Parenterale Ed Enterale. 1997;15:20‐3. [Google Scholar]
Heckmayr 1992 {published data only}
- Heckmayr M, Gatzemeier U. Treatment of cancer weight loss in patients with advanced lung cancer. Oncology 1992;49(Suppl 2):32‐4. [DOI] [PubMed] [Google Scholar]
Herrejon 2011 {published data only}
- Herrejon A, Catalan P, Palop J, Inchaurraga I, Blanquer R, Lopez A. Effect of 8‐week 320 mg megestrol acetate daily administration in severe COPD and weight loss [Abstract]. American Journal of Respiratory and Critical Care Medicine 2010;181:A4484. [Google Scholar]
- Herrejon A, Palop J, Inchaurraga I, Lopez A, Bañuls C, Hernandez A, et al. Low doses of megestrol acetate increase weight and improve nutrition status in patients with severe chronic obstructive pulmonary disease and weight loss. Medicina Clinica 2011;137:193‐8. [DOI] [PubMed] [Google Scholar]
Jatoi 2002 {published data only}
- Jatoi A, Windschitl HE. Dronabinol versus megestrol acetate versus combination for cancer‐associated anorexia: A North Central Cancer Treatment Group Study. Journal of Clinical Oncology 2002;20:567‐73. [DOI] [PubMed] [Google Scholar]
Jatoi 2004 {published data only}
- Jatoi A, Rowland K, Loprinzi CL, Sloan JA, Dakhil SR, MacDonald N, et al. An eicosapentaenoic acid supplement versus megestrol acetate versus both for patients with cancer‐associated wasting: a North Central Cancer Treatment Group and National Cancer Institute of Canada collaborative effort. Journal of Clinical Oncology 2004;22:2469‐76. [DOI] [PubMed] [Google Scholar]
Lesser 2006 {published data only}
- Lesser GJ, Case D, Sharp S, Choksi J, Miller A, Atkins J, et al. A phase III randomized study comparing the effects of oxandrolone (Ox) and megestrol acetate (Meg) on weight (wt), lean body mass (LBM) and quality of life (QOL) in solid tumor patients (pts) receiving chemotherapy (chemo). Journal of Clinical Oncology, 2006 ASCO Annual Meeting Proceedings Part I 2006;24(18S (June 20 Suppl)):18546. [Google Scholar]
Loprinzi 1990b {published data only}
- Loprinzi CL, Ellison NM. Controlled trial of megestrol acetate for the treatment of cancer anorexia and cachexia. Journal of the National Cancer Institute 1990;82:1127‐32. [DOI] [PubMed] [Google Scholar]
Loprinzi 1994 {published data only}
- Loprinzi CL, Bernath AM. Phase III evaluation of 4 doses of megestrol acetate for patients with cancer anorexia and/or cachexia. Oncology 1994;51:2‐7. [DOI] [PubMed] [Google Scholar]
- Loprinzi CL, Michalak JC, Schaid DJ, Mailliard JA, Athmann LM, Goldberg RM, et al. Phase III evaluation of four doses of megestrol acetate as therapy for patients with cancer anorexia and/or cachexia. Journal of Clinical Oncology 1993;11:762‐7. [CN‐00092689] [DOI] [PubMed] [Google Scholar]
Loprinzi 1999a {published data only}
- Loprinzi CL, Kugler J, Sloan J, Mailliard J, Krook J, Wilwerding M, et al. Phase III randomized comparison of megestrol acetate, dexamethasone, and fluoxymesterone for the treatment of cancer anorexia/cachexia [Meeting abstract no 167]. ASCO Annual Meeting. 1997.
- Loprinzi CL, Kugler JW. Randomized comparison of megestrol acetate versus dexamethasone versus fluoxymesterone for the treatment of cancer anorexia/cachexia. Journal of Clinical Oncology 1999;17:3299‐306. [DOI] [PubMed] [Google Scholar]
Loprinzi 1999b {published data only}
- Loprinzi CL, Kugler J, Sloan J, Mailliard J, Krook J, Wilwerding M, et al. Phase III randomized comparison of megestrol acetate, dexamethasone, and fluoxymesterone for the treatment of cancer anorexia/cachexia [Meeting abstract no 167]. ASCO Annual Meeting. 1997.
- Loprinzi CL, Kugler JW. Randomized comparison of megestrol acetate versus dexamethasone versus fluoxymesterone for the treatment of cancer anorexia/cachexia. Journal of Clinical Oncology 1999;17:3299‐306. [DOI] [PubMed] [Google Scholar]
Macbeth 1994 {published and unpublished data}
- Macbeth FR, Grgeor A, Cott. A randomised study of megestrol acetate (MA) and prednisolone (P) for anorexia and weight loss in patients with lung cancer. Lung Cancer 1994;1 Suppl 1:88. [Google Scholar]
Madeddu 2012 {published data only}
- Madeddu C, Dessì M, Panzone F, Serpe R, Antoni G, Cau MC, et al. Randomized phase III clinical trial of a combined treatment with carnitine + celecoxib ± megestrol acetate for patients with cancer‐related anorexia/cachexia syndrome. Clinical Nutrition 2012;31:176‐82. [DOI] [PubMed] [Google Scholar]
McMillan 1994 {published data only}
- McMillan DC, Simpson JM. Effect of megestrol acetate on weight loss, body composition and blood screen of gastrointestinal cancer patients. Clinical Nutrition 1994;13:85‐9. [DOI] [PubMed] [Google Scholar]
Mwamburi 2004 {published data only}
- Mwamburi DM, Gerrior J, Wilson IB, Chang H, Scully E, Saboori S, et al. Comparing megestrol acetate therapy with oxandrolone therapy for HIV‐related weight loss: similar results in 2 months. Clinical Infectious Diseases 2004;38:895‐902. [DOI] [PubMed] [Google Scholar]
Oster 1994 {published data only}
- Oster MH, Enders SR. Megestrol acetate in patients with AIDS and cachexia. Annals of Internal Medicine 1994;121:400‐8. [DOI] [PubMed] [Google Scholar]
Sancho‐Cuesta 1993 {published data only}
- Sancho‐Cuesta JF. Megestrol acetate and weight loss in advanced cancer [Abstract no: 1141]. European Journal of Cancer 1993;29A:S204. [Google Scholar]
Schmoll 1991 {published data only}
- Schmoll E, Wilke H, Thole R, Preusser P, Wildfang I, Schmoll HJ. Megestrol acetate in cancer cachexia. Seminars in Oncology 1991;18(1 Suppl 2):32‐4. [CN‐00072963] [PubMed] [Google Scholar]
Schmoll 1992 {published data only}
- Schmoll E. Risks and benefits of various therapies for cancer anorexia. Oncology 1992;49:43‐5. [DOI] [PubMed] [Google Scholar]
Summerbell 1992 {published data only}
- Summerbell CD, Youle M, McDonald V, Catalan J, Gazzard BG. Megestrol acetate vs cyproheptadine in the treatment of weight loss associated with HIV infection. International Journal of STD and AIDS 1992;3:278‐80. [DOI] [PubMed] [Google Scholar]
Tchekmedyian 1992 {published data only}
- Tchekmedyian NS, Hickman M. Megestrol acetate in cancer anorexia and weight loss. Cancer 1992;69:1268‐74. [DOI] [PubMed] [Google Scholar]
Timpone 1997 {published data only}
- Timpone JG, Wright DJ. The safety and pharmacokinetics of single‐agent and combination therapy with megestrol acetate and dronabinol for the treatment of HIV wasting syndrome. AIDS Research and Human Retroviruses 1997;13:305‐15. [DOI] [PubMed] [Google Scholar]
Ulutin 2002 {published data only}
- Ulutin HC, Arpaci F, Pak Y. Megestrol acetate for cachexia and anorexia in advanced non‐small cell lung cancer: a randomized study comparing two different doses. Tumori 2002;88:277‐80. [DOI] [PubMed] [Google Scholar]
Vadell 1998 {published data only}
- Segui MA, Vadell C, Gimenez‐Arnau JM, Morales S, Cirera L, Bestit I, et al. Double‐blind randomized trial for the treatment of cancer related cachexia: comparison of placebo vs two different doses of megestrol acetate [Abstract 99]. Proceedings of the American Society of Clinical Oncology 1996;15:529. [Google Scholar]
- Vadell C, Segui MA. Anticachectic efficacy of megestrol acetate at different doses and versus placebo in patients with neoplastic cachexia. American Journal of Clinical Oncology 1998;21:347‐51. [DOI] [PubMed] [Google Scholar]
Von Roenn 1994 {published data only}
- Roenn JH, Armstrong D. Megestrol acetate in patients with AIDS‐related cachexia. Annals of Internal Medicine 1994;121:393‐9. [DOI] [PubMed] [Google Scholar]
Wanke 2007 {published data only}
- Cilla DD, Gutierrez JL, Kristensen A, Kramer LD. The safety of megestrol acetate concentrated suspension (MA‐CS) and megestrol acetate oral suspension (MA‐OS) in a pilot study in patients with HIV‐associated unintended weight loss (UWL) [Abstract]. Blood 2006;108:43. [Google Scholar]
- Wanke C, Gutierrez J, Kristensen A, MacEarchern, L. Safety and efficacy of two preparations of megestrol acetate in HIV‐infected individuals with weight loss in Africa, India, and the United States. Journal of Applied Research 2007;7:206‐16. [Google Scholar]
Weisberg 2002 {published data only}
- Weisberg J, Wanger J. Megestrol acetate stimulates weight gain and ventilation in underweight COPD patients. Chest 2002;121(4):1070‐8. [DOI] [PubMed] [Google Scholar]
Yeh 2000 {published data only}
- Yeh SS, Lovitt S, Schuster MW. Usage of megestrol acetate in the treatment of anorexia‐cachexia syndrome in the elderly. Journal of Nutrition, Health and Aging 2009;13:448‐54. [DOI] [PubMed] [Google Scholar]
- Yeh SS, Wu SY. Improvement in quality of life measures and stimulation of weight gain after treatment with megestrol acetate oral suspension in geriatric cachexia: results of a double‐blind, placebo‐controlled study. Journal of the American Geriatrics Society 2000;48(5):485‐92. [DOI] [PubMed] [Google Scholar]
- Yeh SS, Wu SY, Levine DM, Parker TS, Olson JS, Stevens MR, et al. The correlation of cytokine levels with body weight after megestrol acetate treatment in geriatric patients. Journals of Gerontology. Series A, Biological Sciences and Medical Sciences 2001;56:M48‐54. [DOI] [PubMed] [Google Scholar]
References to studies excluded from this review
Aguilera 2001 {published data only}
- Aguilera A, Selgas R, Diez JJ, Bajo MA, Codoceo R, Alvarez V. Anorexia in end‐stage renal disease: pathophysiology and treatment. Expert Opinion on Pharmacotherapy 2001;2(11):1825‐38. [DOI] [PubMed] [Google Scholar]
Aisner 1988 {published data only}
- Aisner J, Tchekmedyian NS, Tait N, Parnes H, Novak M. Studies of high‐dose megestrol acetate: potential applications in cachexia. Seminars in Oncology 1988;15(2 Suppl 1):68‐75. [PubMed] [Google Scholar]
Anonymous 1995 {published data only}
- Anonymous. Megestrol found effective in two trials. AIDS Patient Care 1995;9(1):41. [Google Scholar]
Ansfield 1982 {published data only}
- Ansfield FJ, Kallas GJ, Singson JP. Clinical results with megestrol acetate in patients with advanced carcinoma of the breast. Surgery, Gynecology & Obstetrics 1982;155(6):888‐90. [PubMed] [Google Scholar]
Argiles 2007 {published data only}
- Argiles JM, Lopez‐Soriano FJ, Busquets S. Emerging drugs for cancer cachexia. Expert Opinion on Emerging Drugs 2007;12(4):555‐70. [DOI] [PubMed] [Google Scholar]
Argiles 2008 {published data only}
- Argiles JM, Lopez‐Soriano FJ, Busquets S. Novel approaches to the treatment of cachexia. Drug Discovery Today 2008;13(1‐2):73‐8. [DOI] [PubMed] [Google Scholar]
Argiles 2010 {published data only}
- Argiles JM, Olivan M, Busquets S, Lopez‐Soriano FJ. Optimal management of cancer anorexia‐cachexia syndrome. Cancer Management and Research 2010;2(1):27‐38. [DOI] [PMC free article] [PubMed] [Google Scholar]
Behl 2007 {published data only}
- Behl D, Jatoi A. Pharmacological options for advanced cancer patients with loss of appetite and weight. Expert Opinion on Pharmacotherapy 2007;8(8):1085‐90. [DOI] [PubMed] [Google Scholar]
Bossola 2006 {published data only}
- Bossola M, Tazza L, Giungi S, Luciani G. Anorexia in hemodialysis patients: an update. Kidney International 2006;70(3):417‐22. [DOI] [PubMed] [Google Scholar]
Bossola 2009 {published data only}
- Bossola M, Tazza L, Luciani G. Mechanisms and treatment of anorexia in end‐stage renal disease patients on hemodialysis. Journal of Renal Nutrition 2009;19(1):2‐9. [DOI] [PubMed] [Google Scholar]
Bruera 1990 {published data only}
- Bruera E, McMillan K. A controlled trial of megestrol acetate on appetite, caloric intake, nutritional status, and other symptoms in patients with advanced cancer. Cancer 1990;66:1279‐82. [DOI] [PubMed] [Google Scholar]
Bruera 1992a {published data only}
- Bruera E. Clinical management of anorexia and cachexia in patients with advanced cancer. Oncology 1992;49 Suppl 2:35‐42. [DOI] [PubMed] [Google Scholar]
Bruera 1998 {published data only}
- Bruera E, Scott E. Effectiveness of megestrol acetate in patients with advanced cancer: a randomized, double‐blind, crossover study. Cancer Prevention and Control 1998;2(2):74‐8. [PubMed] [Google Scholar]
Bruera 1998a {published data only}
- Bruera E. Pharmacological treatment of cachexia: any progress? [Review]. Supportive Care in Cancer 1998;6(2):109‐13. [DOI] [PubMed] [Google Scholar]
Cardona 2006 {published data only}
- Cardona D. Pharmacological therapy of cancer anorexia‐cachexia. Nutricion Hospitalaria 2006;21:Suppl 26. [PubMed] [Google Scholar]
Carroll 2007 {published data only}
- Carroll JK, Kohli S, Mustian KM, Roscoe JA, Morrow GR. Pharmacologic treatment of cancer‐related fatigue. Oncologist 2007;12(Suppl 1):43‐51. [DOI] [PubMed] [Google Scholar]
Cat 1994 {published data only}
- Cat LK, Coleman RL. Treatment for HIV wasting syndrome. Annals of Pharmacotherapy 1994;28(5):595‐7. [PubMed] [Google Scholar]
Celik 2009 {published data only}
- Celik T, Iyisoy A, Gundogdu F, Isik E. Chronic pulmonary cachexia syndrome: the role of anorexia. International Journal of Cardiology 2009;132(3):432‐3. [DOI] [PubMed] [Google Scholar]
Chen 1997 {published data only}
- Chen HC, Leung SW, Wang CJ, Sun LM, Fang FM, Hsu JH. Effect of megestrol acetate and prepulsid on nutritional improvement in patients with head and neck cancers undergoing radiotherapy. Radiotherapy and Oncology 1997;43:75‐9. [DOI] [PubMed] [Google Scholar]
Chlebowski 1996 {published data only}
- Chlebowski RT, Palomares MR, Lillington L, Grosvenor M. Recent implications of weight loss in lung cancer management. Nutrition 1996;12(1 Suppl):S43‐7. [DOI] [PubMed] [Google Scholar]
Costero 2004 {published data only}
- Costero O, Bajo MA, Peso G, Gil F, Aguilera A, Ros S, et al. Treatment of anorexia and malnutrition in peritoneal dialysis patients with megestrol acetate. Advances in Peritoneal Dialysis 2004;20:209‐21. [PubMed] [Google Scholar]
Cruz 1990 {published data only}
- Cruz JM, Muss HB, Brockschmidt JK, Evans GW. Weight changes in women with metastatic breast cancer treated with megestrol acetate: a comparison of standard versus high‐dose therapy. Seminars in Oncology 1990;17:63‐7. [PubMed] [Google Scholar]
Cuerda 1998 {published data only}
- Cuerda Compes M, Breton Lesmes I, Camblor Alvarez M, Garcia Peris P. Pharmacological modulation of the appetite. Nutricion Hospitalaria 1998;13(2):69‐75. [PubMed] [Google Scholar]
Desport 2000 {published data only}
- Desport JC, Blanc‐Vincent MP, Gory‐Delabaere G, Bachmann P, Beal J, Benamouzig R, et al. Standards, Options and Recommendations (SOR) for the use of appetite stimulants in oncology. Work group. Federation of the French Cancer Centres (FNCLCC). Bulletin du Cancer 2000;87(4):315‐28. [PubMed] [Google Scholar]
Elovic 2000 {published data only}
- Elovic E. Pharmacological therapeutics in nutritional management. Journal of Head Trauma Rehabilitation 2000;15(3):962‐4. [DOI] [PubMed] [Google Scholar]
Erkurt 2000 {published data only}
- Erkurt E, Erkisi M, Tunali C. Supportive treatment in weight‐losing cancer patients due to the additive adverse effects of radiation treatment and/or chemotherapy. Journal of Experimental & Clinical Cancer Research 2000;19:431‐9. [PubMed] [Google Scholar]
Farmer 2005 {published data only}
- Farmer M, Case D, Lesser G, Monitto D, Smathers S, May B, et al. A phase III, double blind, placebo‐controlled, prospective randomized trial on the effect of megestrol acetate on weight and health related quality of life in lung cancer and head and neck cancer patients receiving curative radiation therapy. Proceedings of the American Society for Therapeutic Radiology and Oncology, 47th.Annual Meeting; 2005 Oct 16‐19; Denver, Colorado, USA. International Journal of Radiation Oncology Biology Physics 2005;63:S77‐8. [Google Scholar]
Farrar 1999 {published data only}
- Farrar DJ. Megestrol acetate: promises and pitfalls [Review]. Aids Patient Care and STDS 1999;13(3):149‐52. [DOI] [PubMed] [Google Scholar]
Fearon 2002 {published data only}
- Fearon KCH, Moses AGW. Cancer cachexia. International Journal of Cardiology 2002;85(1):73‐81. [DOI] [PubMed] [Google Scholar]
Fossati 1998 {published data only}
- Fossati R, Confalonieri C, Torri V, Ghislandi E, Penna A, Pistotti V, et al. Cytotoxic and hormonal treatment for metastatic breast cancer: a systematic review of published randomized trials involving 31,510 women. Journal of Clinical Oncology 1998;16(10):3439‐60. [DOI] [PubMed] [Google Scholar]
Fox 2009 {published data only}
- Fox CB, Treadway AK, Blaszczyk AT, Sleeper RB. Megestrol acetate and mirtazepine for the treatment of unplanned weight loss in the elderly. Pharmacotherapy 2009;29(4):383‐97. [DOI] [PubMed] [Google Scholar]
Freyer 1996 {published data only}
- Freyer G, Catimel G, Merrouche Y. Synthetic progestational hormones in the treatment of neoplastic cachexia. Revue de Medecine Interne 1996;17(1):79‐84. [DOI] [PubMed] [Google Scholar]
Freyer 1996a {published data only}
- Freyer G, Catimel G, Merrouche Y. Progesterone derivatives in cancer cachexia. Revue de Medecine Interne 1996;17(1):79‐84. [DOI] [PubMed] [Google Scholar]
Gaducci 2001 {published data only}
- Gadducci A, Cosio S, Fanucchi A, Genazzani AR. Malnutrition and cachexia in ovarian cancer patients: pathophysiology and management. Anticancer Research 2011;21(4B):2941‐7. [PubMed] [Google Scholar]
Garg 2010 {published data only}
- Garg S, Yoo J, Winquist E. Nutritional support for head and neck cancer patients receiving radiotherapy: a systematic review [Review]. Supportive Care in Cancer 2010;18(6):667‐77. [DOI] [PubMed] [Google Scholar]
Gullett {published data only}
- Gullett NP, Mazurak VC, Hebbar G, Ziegler TR. Nutritional Interventions for cancer‐induced cachexia. Current Problems in Cancer 2011;35:58‐90. [DOI] [PMC free article] [PubMed] [Google Scholar]
Hanson 2011 {published data only}
- Hanson LC, Ersek M, Gilliam R, Carey TS. Oral feeding options for people with dementia: a systematic review. Journal of the American Geriatrics Society 2011;59(3):463‐72. [DOI] [PMC free article] [PubMed] [Google Scholar]
Haren 2006 {published data only}
- Haren MT, Kim MJ, Kevorkian RT. Megestrol acetate for geriatric anorexia/cachexia. Journal of the American Geriatrics Society 2006;54(1):172‐3. [DOI] [PubMed] [Google Scholar]
Hellerstein 1990 {published data only}
- Hellerstein MK, Kahn J, Mudie H, Viteri F. Current approach to the treatment of human immunodeficiency virus‐associated weight loss: pathophysiologic considerations and emerging management strategies. Seminars in Oncology 1990;17(6 Suppl 9):33. [PubMed] [Google Scholar]
Hoffman 1998 {published data only}
- Hoffman KR, Green NJ. Megestrol acetate (Megace) to prevent cachexia and marasmus in elderly cancer patients (Meeting abstract no 233). ASCO Annual Meeting. 1998.
Inui 2002 {published data only}
- Inui A. Cancer anorexia‐cachexia syndrome: current issues in research and management. CA: A Cancer Journal for Clinicians 2002;52:72‐91. [DOI] [PubMed] [Google Scholar]
Jatoi 2001 {published data only}
- Jatoi A, Loprinzi CL. An update: cancer‐associated anorexia as a treatment target. Current Opinion in Clinical Nutrition and Metabolic Care 2001;4(3):179‐82. [DOI] [PubMed] [Google Scholar]
Kalantar‐Zadeh 2008 {published data only}
- Kalantar‐Zadeh K, Anker SD, Horwich TB, Fonarow GC. Nutritional and anti‐inflammatory interventions in chronic heart failure. American Journal of Cardiology 2008;101:89E‐103E. [DOI] [PMC free article] [PubMed] [Google Scholar]
Karcic 2002 {published data only}
- Karcic E, Philpot C, Morley JE. Treating malnutrition with megestrol acetate: literature review and review of our experience. Journal of Nutrition, Health, and Aging 2002;6:191‐200. [PubMed] [Google Scholar]
Khojasteh 1996 {published data only}
- Khojasteh A, Khojasteh S, Reynolds R. Combined nortriptyline + megestrol acetate regimen for cancer anorexia‐cachexia syndrome [abstract]. Proceedings of the American Society of Clinical Oncology 1996;15:451. [Google Scholar]
Krznaric 2007 {published data only}
- Krznaric Z, Juretic A, Samija M, Dintinjana RD, Vrdoljak E, Samarzija M, et al. Croatian guidelines for use of eicosapentaenoic acid and megestrol acetate in cancer cachexia syndrome [Croatian]. Lijecnicki Vjesnik 2007;129:381‐6. [PubMed] [Google Scholar]
Kumar 2010 {published data only}
- Kumar NB, Kazi A, Smith T, Crocker T, Yu D, Reich RR, et al. Cancer cachexia: traditional therapies and novel molecular mechanism‐based approaches to treatment. Current Treatment Options in Oncology 2010;11:107‐17. [DOI] [PMC free article] [PubMed] [Google Scholar]
Lai 1994 {published data only}
- Lai YL, Fang FM, Yeh CY. Management of anorexic patients in radiotherapy: a prospective randomized comparison of megestrol and prednisolone. Journal of Pain and Symptom Management 1994;9:265‐8. [DOI] [PubMed] [Google Scholar]
Lelli 2003 {published data only}
- Lelli G, Montanari M, Gilli G, Scapoli D, Antonietti C, Scapoli D. Treatment of the cancer anorexia‐cachexia syndrome: a critical reappraisal. Journal of Chemotherapy 2003;15:220‐5. [DOI] [PubMed] [Google Scholar]
Lesniak 2008 {published data only}
- Lesniak W, Bala M, Jaeschke R, Krzakowski M. Effects of megestrol acetate in patients with cancer anorexia‐cachexia syndrome‐‐a systematic review and meta‐analysis. Polskie Archiwum Medycyny Wewnętrznej 2008;118:636‐44. [PubMed] [Google Scholar]
Loprinzi 1992 {published data only}
- Loprinzi CL, Goldberg RM, Burnham NL. Cancer‐associated anorexia and cachexia. Implications for drug therapy. Drugs 1992;43:499‐506. [DOI] [PubMed] [Google Scholar]
Loprinzi 1992a {published data only}
- Loprinzi CL, Johnson PA, Jensen M. Megestrol acetate for anorexia and cachexia. Oncology 1992;49 Suppl 2:46‐9. [DOI] [PubMed] [Google Scholar]
Loprinzi 1993 {published data only}
- Loprinzi CL, Schaid DJ, Dose AM, Burnham NL, Jensen MD. Body‐composition changes in patients who gain weight while receiving megestrol acetate. Journal of Clinical Oncology 1993;11:152‐4. [DOI] [PubMed] [Google Scholar]
Loprinzi 1995 {published data only}
- Loprinzi CL. Management of cancer anorexia/cachexia. Supportive Care in Cancer 1995;3:120‐2. [DOI] [PubMed] [Google Scholar]
Mak 2007 {published data only}
- Mak RH, Cheung W. Therapeutic strategy for cachexia in chronic kidney disease. Current Opinion in Nephrology and Hypertension 2007;16:542‐6. [DOI] [PubMed] [Google Scholar]
Malone 2005 {published data only}
- Malone M. Medications associated with weight gain. Annals of Pharmacotherapy 2005;39:2046‐55. [DOI] [PubMed] [Google Scholar]
Maltoni 2001a {published data only}
- Maltoni M, Nanni O, Scarpi E, Rossi D, Serra P, Amadori D. High‐dose progestins for the treatment of cancer anorexia‐cachexia syndrome: a systematic review of randomised clinical trials. Annals of Oncology 2001;12:289‐300. [DOI] [PubMed] [Google Scholar]
Mantovani 1998a {published data only}
- Mantovani G, Maccio A, Lai P, Massa E, Ghiani M, Santona MC. Cytokine involvement in cancer anorexia/cachexia: role of megestrol acetate and medroxyprogesterone acetate on cytokine downregulation and improvement of clinical symptoms. Critical Reviews in Oncogenesis 1998;9:99‐106. [DOI] [PubMed] [Google Scholar]
Mantovani 2001 {published data only}
- Mantovani G, Maccio A, Massa E, Madeddu C. Managing cancer‐related anorexia/cachexia. Drugs 2001;61:499‐514. [DOI] [PubMed] [Google Scholar]
Mantovani 2008 {published data only}
- Mantovani G, Macciò A, Madeddu C, Gramignano G, Serpe R, Massa E, et al. Randomized phase III clinical trial of five different arms of treatment for patients with cancer cachexia: interim results. Nutrition 2008;24:305‐13. [DOI] [PubMed] [Google Scholar]
Mantovani 2010 {published data only}
- Mantovani G, Maccio A, Madeddu C, Serpe R, Massa E, Dessi M, et al. Randomized phase III clinical trial of five different arms of treatment in 332 patients with cancer cachexia. Oncologist 2010;15:200‐11. [DOI] [PMC free article] [PubMed] [Google Scholar]
Marchand 2000 {published data only}
- Marchand V, Baker SS. Randomized, double‐blind, placebo‐controlled pilot trial of megestrol acetate in malnourished children with cystic fibrosis. Journal of Pediatric Gastroenterology and Nutrition 2000;31:264‐9. [DOI] [PubMed] [Google Scholar]
Mateen 2006 {published data only}
- Mateen F, Jatoi A. Megestrol acetate for the palliation of anorexia in advanced, incurable cancer patients. Clinical Nutrition 2006;25:711‐5. [DOI] [PubMed] [Google Scholar]
McHugh 2011 {published data only}
- McHugh ME, Miller‐Saultz D. Assessment and management of gastrointestinal symptoms in advanced illness. Primary Care 2011;38:225‐46. [DOI] [PubMed] [Google Scholar]
McMillan 1999 {published data only}
- McMillan DC, Wigmore SJ. A prospective randomised study of megestrol acetate and ibuprofen in gastrointestinal cancer patients with weight loss. British Journal of Cancer 1999;79:495‐500. [DOI] [PMC free article] [PubMed] [Google Scholar]
McQuellon 2002 {published data only}
- McQuellon RP, Moose DB, Russell GB, Case LD, Greven K, Stevens M, et al. Supportive use of megestrol acetate (Megace) with head/neck and lung cancer patients receiving radiation therapy. International Journal of Radiation Oncology, Biology, Physics 2002;52:1180‐5. [DOI] [PubMed] [Google Scholar]
Monfared 2009 {published data only}
- Monfared A, Heidarzadeh A, Ghaffari M, Akbarpour M. Effect of megestrol acetate on serum albumin level in malnourished dialysis patients. Journal of Renal Nutrition 2009;19:167‐71. [DOI] [PubMed] [Google Scholar]
Morán 1998 {published data only}
- Morán S, Ortega R, Garcia G, Uribe M. Megestrol acetate improve appetite and induce anti‐catabolic effect in post‐hepatitis C cirrhotic patients. A double‐blind placebo‐controlled clinical trial [Abstract 80]. Hepatology 1998;28:609A. [Google Scholar]
Morley 2002 {published data only}
- Morley JE. Orexigenic and anabolic agents. Clinics in Geriatric Medicine 2002;18:853‐66. [DOI] [PubMed] [Google Scholar]
Mulligan 2007 {published data only}
- Mulligan K, Zackin R, Von‐Roenn JH, Chesney MA, Egorin MJ, Sattler FR, et al. Testosterone supplementation of megestrol therapy does not enhance lean tissue accrual in men with human immunodeficiency virus‐associated weight loss: a randomized, double‐blind, placebo‐controlled, multicenter trial. Journal of Clinical Endocrinology and Metabolism 2007;92:563‐70. [DOI] [PubMed] [Google Scholar]
Muss 1990 {published data only}
- Muss HB, Case LD, Capizzi RL, Cooper MR, Cruz J, Jackson D, et al. High‐ versus standard‐dose megestrol acetate in women with advanced breast cancer: a phase III trial of the Piedmont Oncology Association. Journal of Clinical Oncology 1990;8:1797‐805. [DOI] [PubMed] [Google Scholar]
Navari 2010 {published data only}
- Navari RM, Brenner MC. Treatment of cancer‐related anorexia with olanzapine and megestrol acetate: a randomized trial. Supportive Care in Cancer 2010;18:951‐6. [DOI] [PubMed] [Google Scholar]
Nelson 2002 {published data only}
- Nelson KA, Walsh D, Hussein M. A phase II study of low‐dose megestrol acetate using twice‐daily dosing for anorexia in nonhormonally dependent cancer. American Journal of Hospice and Palliative Care 2002;19:206‐10. [DOI] [PubMed] [Google Scholar]
Osoba 1994 {published data only}
- Osoba D, Murray N, Gelmon K, Karsai H, Knowling MA, Shah A, et al. Phase II trial of megestrol in the supportive care of patients receiving dose‐intensive chemotherapy. Oncology 1994;8:43‐9. [PubMed] [Google Scholar]
Pardo 2003a {published data only}
- Pardo J, Mena AM, Montsech L. Megestrol acetate for anorexia in lung cancer patients undergoing radiation therapy. A randomized trial comparing the efficacy of two different doses in 130 patients [Abstract 3076]. Proceedings of the American Society of Clinical Oncology 2003;22:765. [Google Scholar]
Pardo 2006 {published data only}
- Pardo J, Mena A, Monleon A, Macias V, Sole J, Hernandez M, et al. Reversal of anorexia with megestrol acetate (MA): impact on quality of life (QoL) in non‐metastatic lung cancer patients (pts) undergoing radiation therapy. Journal of Clinical Oncology 2006;24:18613. [Google Scholar]
Pascual 2004 {published data only}
- Pascual Lopez A, Figuls M, Urrutia Cuchi G, Berenstein EG, Almenar Pasies B, Balcells Alegre M, et al. Systematic review of megestrol acetate in the treatment of anorexia‐cachexia syndrome. Journal of Pain and Symptom Management 2004;27:360‐9. [DOI] [PubMed] [Google Scholar]
Pruthi 2007 {published data only}
- Pruthi S, Boughey JC, Brandt KR, Degnim AC, Dy GK, Goetz MP, et al. A multidisciplinary approach to the management of breast cancer, part 2: Therapeutic considerations. Mayo Clinic Proceedings 2007;82:1131‐40. [DOI] [PubMed] [Google Scholar]
Reuben 2005 {published data only}
- Reuben DB, Hirsch SH, Zhou K, Greendale GA. The effects of megestrol acetate suspension for elderly patients with reduced appetite after hospitalization: a phase II randomized clinical trial. Journal of the American Geriatrics Society 2005;53:970‐5. [DOI] [PubMed] [Google Scholar]
Ross 2001 {published data only}
- Ross DD, Alexander CS. Management of common symptoms in terminally ill patients: Part I. Fatigue, anorexia, cachexia, nausea and vomiting. American Family Physician 2001;64:807‐14. [PubMed] [Google Scholar]
Rowland 1996 {published data only}
- Rowland KM, Loprinzi CL. Randomized double‐blind placebo‐controlled trial of cisplatin and etoposide plus megestrol acetate/placebo in extensive‐stage small‐cell lung cancer: a North Central Cancer Treatment Group Study. Journal of Clinical Oncology 1996;14:135‐41. [DOI] [PubMed] [Google Scholar]
Ruiz‐Garcia 2002 {published data only}
- Ruiz‐Garcia V, Juan O, Perez Hoyos S, Peiro R, Ramon N, Rosero MA, et al. Megestrol acetate: a systematic review usefulness about the weight gain in neoplastic patients with cachexia. Medicina Clinica 2002;119:166‐70. [DOI] [PubMed] [Google Scholar]
Sanz‐Ortiz 2004 {published data only}
- Sanz‐Ortiz J. Anorexia treatment in the oncological patient. Revista Clinica Espanola 2004;204:542‐4. [DOI] [PubMed] [Google Scholar]
Schacter 1989 {published data only}
- Schacter L, Rozencweig M, Canetta R, Kelley S, Nicaise C, Smaldone L. Megestrol acetate: clinical experience [Review]. Cancer Treatment Reviews 1989;16:49‐63. [DOI] [PubMed] [Google Scholar]
Schmoll 1992a {published data only}
- Schmoll E. Risks and benefits of various therapies for cancer anorexia. Oncology 1992;49 Suppl 2:43‐5. [DOI] [PubMed] [Google Scholar]
Simmons 2004 {published data only}
- Simmons SF, Walker KA, Osterweil D. The effect of megestrol acetate on oral food and fluid intake in nursing home residents: a pilot study. Journal of the American Medical Directors Association 2004;5:24‐30. [PubMed] [Google Scholar]
Skarlos 1993 {published data only}
- Skarlos DV, Fountzilas G, Pavlidis N, Beer M, Makrantonakis P, Aravantinos G, et al. Megestrol acetate in cancer patients with anorexia and weight loss. A Hellenic Co‐operative Oncology Group (HeCOG) study. Acta Oncologica 1993;32:37‐41. [DOI] [PubMed] [Google Scholar]
Spaulding 1989 {published data only}
- Spaulding M. Recent studies of anorexia and appetite stimulation in the cancer patient. Oncology 1989;3(8 Suppl):18‐23. [PubMed] [Google Scholar]
Sullivan 2007 {published data only}
- Sullivan DH, Roberson PK, Smith ES, Price JA, Bopp MM. Effects of muscle strength training and megestrol acetate on strength, muscle mass, and function in frail older people. Journal of the American Geriatrics Society 2007;55:20‐8. [DOI] [PubMed] [Google Scholar]
Tchekmedyian 1986 {published data only}
- Tchekmedyian NS, Tait N, Aisner J. High dose megestrol acetate in the treatment of postmenopausal women with advanced breast cancer. Seminars in Oncology 1986;13:20‐5. [PubMed] [Google Scholar]
Tchekmedyian 1990 {published data only}
- Tchekmedyian NS, Hickman M, Siau J, Greco A, Aisner J. Treatment of cancer anorexia with megestrol acetate: impact on quality of life. Oncology 1990;4:185‐92. [PubMed] [Google Scholar]
Tchekmedyian 1991 {published data only}
- Tchekmedyian NS, Hickman M, Heber D. Treatment of anorexia and weight loss with megestrol acetate in patients with cancer or acquired immunodeficiency syndrome. Seminars in Oncology 1991;18 Suppl 2:35‐42. [PubMed] [Google Scholar]
Tchekmedyian 1993 {published data only}
- Tchekmedyian NS. Clinical approaches to nutritional support in cancer. Current Opinion in Oncology 1993;5:633‐8. [DOI] [PubMed] [Google Scholar]
Tchekmedyian 1993a {published data only}
- Tchekmedyian NS. Treatment of anorexia with megestrol acetate. Nutrition in Clinical Practice 1993;8:115‐8. [DOI] [PubMed] [Google Scholar]
Tchekmedyian 2006 {published data only}
- Tchekmedyian NS. Treating the anorexia/cachexia syndrome. Journal of Supportive Oncology 2006;4:506‐7. [PubMed] [Google Scholar]
Thomas 2006 {published data only}
- Thomas DR. Guidelines for the use of orexigenic drugs in long‐term care. Nutrition in Clinical Practice 2006;21:82‐7. [DOI] [PubMed] [Google Scholar]
Tisdale 1993 {published data only}
- Tisdale MJ. Cancer cachexia. Anti‐Cancer Drugs 1993;4:115‐25. [DOI] [PubMed] [Google Scholar]
Tisdale 2006 {published data only}
- Tisdale MJ. Clinical anticachexia treatments. Nutrition in Clinical Practice 2006;21:168‐74. [DOI] [PubMed] [Google Scholar]
Tomiska 2003 {published data only}
- Tomíska M, Tomisková M, Salajka F, Adam Z, Vorlícek J. Palliative treatment of cancer anorexia with oral suspension of megestrol acetate. Neoplasma 2003;50:227‐33. [PubMed] [Google Scholar]
Vigano 1994 {published data only}
- Vigano A, Watanabe S, Bruera E. Anorexia and cachexia in advanced cancer patients. Cancer Surveys 1994;21:99‐115. [PubMed] [Google Scholar]
von Haehling 2009 {published data only}
- Haehling S, Lainscak M, Springer J, Anker SD. Cardiac cachexia: a systematic overview. Pharmacology & Therapeutics 2009;121:227‐52. [DOI] [PubMed] [Google Scholar]
Von Roenn 1994a {published data only}
- Roenn JH. Randomized trials of megestrol acetate for AIDS‐associated anorexia and cachexia. Oncology 1994;51 Suppl 1:19‐24. [DOI] [PubMed] [Google Scholar]
Vyzula 1997 {published data only}
- Vyzula R. Current views on use of megestrol acetate in oncology practice. Vnitrni Lekarstvi 1997;43:250‐5. [PubMed] [Google Scholar]
Westman 1999 {published data only}
- Westman G, Bergman B, Albertsson M, Kadar L, Gustavsson G, Thaning L, et al. Megestrol acetate in advanced, progressive, hormone‐insensitive cancer. Effects on the quality of life: a placebo‐controlled, randomised, multicentre trial. European Journal of Cancer 1999;35:586‐95. [DOI] [PubMed] [Google Scholar]
Yavuzsen 2005 {published data only}
- Yavuzsen T, Davis MP, Walsh D, LeGrand S, Lagman R. Systematic review of the treatment of cancer‐associated anorexia and weight loss. Journal of Clinical Oncology 2005;23:8500‐11. [DOI] [PubMed] [Google Scholar]
Yeh 2004 {published data only}
- Yeh S, Hafner A, Chang C, Levine DM, Parker TS, Schuster MW. Risk factors relating blood markers of inflammation and nutritional status to survival in cachectic geriatric patients in a randomized clinical trial. Journal of the American Geriatrics Society 2004;52:1708‐12. [DOI] [PubMed] [Google Scholar]
Yeh 2006 {published data only}
- Yeh SS, Schuster MW. Megestrol acetate in cachexia and anorexia. International Journal of Nanomedicine 2006;1:411‐6. [DOI] [PMC free article] [PubMed] [Google Scholar]
Yeh 2007 {published data only}
- Yeh SS, Lovitt S, Schuster MW. Pharmacological treatment of geriatric cachexia: evidence and safety in perspective. Journal of the American Medical Directors Association 2007;8:363‐77. [DOI] [PubMed] [Google Scholar]
Yeh 2010 {published data only}
Zeca 1995 {published data only}
- Zeca E, Martini C, Venturino P, Tedeschi M, Ventafrida V, Conno F. Efficacy of megestrol acetate on anorexia in patients with advanced non hormone‐related tumors: a double‐blind placebo controlled clinical trial. European Journal of Cancer 1995;31A:S261‐2. [CN‐00519065] [Google Scholar]
Additional references
Argilés 2001
- Argilés JM, Meijsing SH, Pallares‐Trujillo J. Cancer cachexia. A therapeutic approach. Medical Research Review (US) 2001;21:83‐101. [DOI] [PubMed] [Google Scholar]
Balog 1998
- Balog DL, Epstein ME, Amidio‐Groton MI. HIV wasting syndrome: treatment update. Annals of Pharmacotherapy 1998;32(4):446‐58. [DOI] [PubMed] [Google Scholar]
Barber 1999
- Barber MD, Ross JA, Voss AC, Tisdale MJ, Fearon KC. The effect of an oral nutritional supplement enriched with fish oil on weight‐loss in patients with pancreatic cancer. British Journal of Cancer 1999;81:80‐6. [DOI] [PMC free article] [PubMed] [Google Scholar]
Boissel 1999
- Boissel JP, Cucherat M, Li W, Chatellier G, Gueyffier F, Buyse M, et al. The problem of therapeutic efficacy indices. 3. Comparison of the indices and their use. Therapie 1999;54:405‐11. [PubMed] [Google Scholar]
Bruera 1992
- Bruera E. Clinical management of anorexia and cachexia in patients with advanced cancer. Oncology 1992;49(2):35‐42. [DOI] [PubMed] [Google Scholar]
Campa 2005
- Campa A, Yang Z, Lai S, Xue L, Phillips JC, Sales S, et al. HIV‐related wasting in HIV‐infected drug users in the era of highly active antiretroviral therapy. Clinical Infectious Diseases 2005;41:1179‐85. [DOI] [PubMed] [Google Scholar]
Deeks 2008
- Deeks J, Higgins J, Altman D. Chapter 9: Analysing data and undertaking meta‐analyses. In: Higgins JPT, Green S (editors). Cochrane Handbook for Systematic Reviews of Interventions Version 5.0.0 [updated February 2008]. The Cochrane Collaboration, 2008. Available from: www.cochrane‐handbook.org.
Fearon 2011
- Fearon K, Strasser F, Anker SD, Bosaeus I, Bruera E, Fainsinger RL, et al. Definition and classification of cancer cachexia: an international consensus. Lancet Oncology 2011;12:489‐95. [DOI] [PubMed] [Google Scholar]
Fick 2012
- Fick D, Semla T, Beizer J, Brandt N, Dombrowski R, DuBeau CE, et al. American Geriatrics Society updated Beers Criteria for potentially inappropriate medication use in older adults. Journal of the American Geriatrics Society 2012;60(4):616‐31. [DOI] [PMC free article] [PubMed] [Google Scholar]
Higgins 2011
- Higgins JPT, Green S. Cochrane Handbook for Systematic Reviews of Interventions Version 5.1.0 [updated March 2011]. Chichester, UK: Wiley‐Blackwell, 2011:649. [Google Scholar]
Jadad 1996
- Jadad A, Moore RA, Carroll D, Jenkinson C, Reynolds DJ, Gavaghan DJ, et al. Assessing the quality of reports on randomized clinical trials: is blinding necessary?. Controlled Clinical Trials 1996;170:1‐12. [DOI] [PubMed] [Google Scholar]
Kjaergard 2001
- Kjaergard LL, Villumsen J, Gluud C. Reported methodologic quality and discrepancies between large and small randomized trials in meta‐analyses. Annals of Internal Medicine 2001;135:982‐9. [DOI] [PubMed] [Google Scholar]
Laird 1990
- Laird NM, Wang F. Estimating rates of change in randomized clinical trials. Controlled Clinical Trials 1990;11:405‐19. [DOI] [PubMed] [Google Scholar]
Laupacis 1988
- Laupacis A, Sackett DL, Roberts RS. An assessment of clinically useful measures of the consequences of treatment. New England Journal of Medicine 1988;318:1728‐33. [DOI] [PubMed] [Google Scholar]
Loprinzi 1990a
- Loprinzi C, Ellison NM, Goldberg RM, Michalak JC, Burch PA. Alleviation of cancer anorexia and cachexia: studies of the Mayo Clinic and the North Central Cancer Treatment Group. Seminars in Oncology 1990;17(6 Suppl 9):8‐12. [PubMed] [Google Scholar]
Loprinzi 1999
- Loprinzi CL, Kugler JW, Sloan JA. Randomized comparison of megestrol acetate versus dexamethasone versus fluoxymesterone for the treatment of cancer anorexia/cachexia. Journal of Clinical Oncology 1999;17:3299‐306. [DOI] [PubMed] [Google Scholar]
Mangili 2006
- Mangili A, Murman DH, Zampini AM, Wanke CA. Nutrition and HIV infection: review of weight loss and wasting in the era of highly active antiretroviral therapy from the nutrition for healthy living cohort. Clinical Infectious Diseases 2006;42:836‐42. [DOI] [PubMed] [Google Scholar]
Nelson 1994
- Nelson KA, Walsh D, Sheehan FA. The cancer anorexia‐cachexia syndrome. Journal of Clinical Oncology 1994;12:213‐25. [DOI] [PubMed] [Google Scholar]
Nüesch 2010
- Nüesch E, Trelle S, Reichenbach S, Rutjes AW, TschannenB, Altman DG, et al. Small study effects in meta‐analyses of osteoarthritis trials: meta‐epidemiological study. BMJ 2010;341:c3515. [DOI] [PMC free article] [PubMed] [Google Scholar]
RevMan 2011 [Computer program]
- The Nordic Cochrane Centre, The Cochrane Collaboration. Review Manager (RevMan). Version 5.1. Copenhagen: The Nordic Cochrane Centre, The Cochrane Collaboration, 2011.
Schulz 1993
- Schulz KF, Altman DG. Statistical Methods for Data Synthesis. Cochrane Workshop Report. Oxford: UK Cochrane Centre, 1993. [Google Scholar]
Splinter 1992
- Splinter TA. Cachexia and cancer: a clinician's view. Annals of Oncology 1992;3(3):25‐7. [DOI] [PubMed] [Google Scholar]
Tang 2005
- Tang AM, Jacobson DL, Spiegelman D, Knox TA, Wanke CA. Increasing risk of 5% or greater unintentional weight loss in a cohort of HIV‐infected patients, 1995 to 2003. Journal of Acquired Immune Deficiency Syndromes 2005;40:70‐6. [DOI] [PubMed] [Google Scholar]
Thompson 1952
- Thompson CM, Rodgers RL. Analysis of the autopsy records of 157 cases of carcinoma of the pancreas with particular reference to the incidence of thromboembolism. American Journal of the Medical Sciences 1952;223:469‐76. [DOI] [PubMed] [Google Scholar]
Thompson 1999
- Thompson SG, Sharp SJ. Explaining heterogeneity in meta‐analysis: a comparison of methods. Statistics in Medicine 1999;18:2693‐708. [DOI] [PubMed] [Google Scholar]
Tisdale 2009
- Tisdale M. Mechanisms of cancer cachexia. Physiological Reviews 209;89:381‐410. [DOI] [PubMed] [Google Scholar]
Verso 2003
- Verso M, Agnelli G. Venous thromboembolism associated with long‐term use of central venous catheters in cancer patients. Journal of Clinical Oncology 2003;21:3665‐75. [DOI] [PubMed] [Google Scholar]
Von Roenn 1996
- Roenn JH, Knopf K. Anorexia/cachexia in patients with HIV: lessons for the oncologist. Oncology 1996;10(7):1049‐56. [PubMed] [Google Scholar]
Wigmore 1997
- Wigmore SJ, Fearon KCH, Maingay JP, Ross JA. Down‐regulation of the acute‐phase response in patients with pancreatic cancer cachexia receiving oral eicosapentaenoic acid is mediated via suppression of interleukin‐6. Clinical Science 1997;92:215‐21. [DOI] [PubMed] [Google Scholar]
Wolf 2006
- Wolf I, Sadetzki S, Kanety H, Kundel Y, Pariente C, Epstein N, et al. Adiponectin, ghrelin and leptin in cancer cachexia in breast and colon cancer patients. Cancer 2006;106:966‐73. [DOI] [PubMed] [Google Scholar]
Yusuf 1991
- Yusuf S, Wittes J, Probstfield J, Tyroler HA. Analysis and interpretation of treatment effects in subgroups of patients in randomized clinical trials. JAMA 1991;266:93‐8. [PubMed] [Google Scholar]
References to other published versions of this review
Berenstein G 2005
- Berenstein EG, Ortiz Z. Megestrol acetate for the treatment of anorexia‐cachexia syndrome. Cochrane Database of Systematic Reviews 2005, Issue 2. [DOI: 10.1002/14651858] [DOI] [PubMed] [Google Scholar]
Berenstein G 2011
- Berenstein EG, Ortiz Z. Megestrol acetate for the treatment of anorexia‐cachexia syndrome. Cochrane Database of Systematic Reviews 2011, Issue 7. [DOI: 10.1002/14651858] [DOI] [PubMed] [Google Scholar]