

ABSTRACT
Multiple myeloma (MM) accounts for 13% to 15% of all blood cancers1 and is characterized by the proliferation of malignant cells within the bone marrow (BM). Despite important advances in treatment, most patients become refractory and relapse with the disease. As MM tumors grow in the BM, they disrupt hematopoiesis, create monoclonal protein spikes in the blood, initiate systemic organ and immune system shutdown,2 and induce painful osteolytic lesions caused by overactive osteoclasts and inhibited osteoblasts.3, 4 MM cells are also extremely dependent on the BM niche, and targeting the BM niche has been clinically transformative for inhibiting the positive‐feedback “vicious cycle” between MM cells and osteoclasts that leads to bone resorption and tumor proliferation.5, 6, 7, 8 Bone marrow adipocytes (BMAs) are dynamic, secretory cells that have complex effects on osteoblasts and tumor cells, but their role in modifying the MM cell phenotype is relatively unexplored.9, 10, 11, 12, 13 Given their active endocrine function, capacity for direct cell–cell communication, correlation with aging and obesity (both MM risk factors), potential roles in bone disease, and physical proximity to MM cells, it appears that BMAs support MM cells.14, 15, 16, 17 This supposition is based on research from many laboratories, including our own. Therapeutically targeting the BMA may prove to be equally transformative in the clinic if the pathways through which BMAs affect MM cells can be determined. In this review, we discuss the potential for BMAs to provide free fatty acids to myeloma cells to support their growth and evolution. We highlight certain proteins in MM cells responsible for fatty acid uptake and oxidation and discuss the potential for therapeutically targeting fatty acid metabolism or BMAs from where they may be derived. © 2019 The Authors. JBMR Plus published by Wiley Periodicals, Inc. on behalf of American Society for Bone and Mineral Research
Keywords: MULTIPLE MYELOMA, FATTY ACID UPTAKE AND OXIDATION, BONE MARROW ADIPOSE, BONE MARROW MICROENVIRONMENT, ETOMOXIR, CARNITINE PALMITOYLTRANSFERASE I, CPT1
Introduction
Multiple myeloma (MM) is a fatal, incurable cancer of the plasma cell that grows within the bone marrow (BM) and causes destructive bone lesions in patients.18, 19 Although MM is considered a rare disease, it is the second most‐prevalent hematological cancer, with almost 30,770 new cases (53% male, 47% female) diagnosed and about 12,770 deaths from myeloma estimated to occur in the United States in 2018 alone.20 Despite therapeutic advancements, MM remains an incurable disease in a vast majority of cases. Though patients respond very well to initial chemotherapeutic treatments, almost all patients relapse and develop a drug‐resistant disease, making any further treatment ineffective.21 Here we discuss what is known about myeloma growth in the niche, and explore the theory that drug resistance may occur through changes in cell metabolism and interactions with neighboring bone marrow adipocytes (BMAs).
The stages of developing MM progress from a monoclonal gammopathy of undetermined significance to smoldering myeloma, to active MM disease, and finally to plasma cell leukemia, where myeloma cells no longer require the BM niche for survival and proliferation. The biological transition between these stages consists of many oncogenic and epigenetic events, including the dysregulation of the cyclin D gene22 and activation of NF‐κB pathways.23 In addition to oncogenic, cell‐intrinsic adaptations, myeloma cells also receive external signals, including important signals from the BM niche that accelerate the progression of the disease.24, 25 Myeloma cells are also very heterogeneous in their mutational make‐up within and between patients, and evolve throughout the course of therapy, and hence interact differently with different types of BM niche cells. The BM itself constitutes a unique, complex microenvironment; it is rich in immune cells, bone cells, mesenchymal stromal cells (MSCs), growth factors (eg, IGF‐I and VEGF) and cytokines (eg, IL‐6 and TGFβ)26 that coordinate to regulate myeloma cell differentiation, migration, proliferation, survival, and drug resistance.3, 27, 28
Within the skeletal system, bone matrixes are constantly being remodeled. Osteoblasts secrete osteoid and mineralize this matrix to make strong, new bone, whereas osteoclasts reabsorb older bone matrix. Myeloma cells decrease the osteoblast number and activity while increasing osteoclast number and activity, leading to increased bone resorption and the release of stored factors that further accelerate tumor growth in a phenomenon termed the “vicious cycle.”29 In this cycle, tumor cells release factors such as PTHrP, and osteoclasts release factors stored within the bone (such as TGFβ1 and collagen I), which directly interact with osteoblasts and osteoclasts and further induce bone disease.30 The vicious cycle may also be supported by one of the major components of the BM niche, the BMA, which makeup bone marrow adipose tissue (BMAT). Over the last couple of decades, BMAT has been shown to play an active role in bone metabolism, bone cancer metastasis, and drug resistance.10, 11, 31, 32, 33, 34, 35 In this review, we present an overview of BMAs and bone metastasis, with particular emphasis on lipid metabolism in myeloma cells.
Bone Marrow Adipose Tissue
The BM is a complex organ containing two types of stem cells: the hematopoietic stem cell (responsible for the production of blood cells) and the nonhematopoietic bone‐marrow‐derived MSC (BMSC). BMSCs contain a population of stem cells that are multipotent cells and have the potential to differentiate into cells that comprise cartilage (chondrocytes), muscle (myocytes), bone (osteoblasts), and importantly, adipose tissue (adipocytes), in response to appropriate factors. In recent years, greater interest in the adipose depot located within the BM has become an area of intense research interest based on a greater understanding of adipose biology in general, and improved imaging modalities to assess this depot in the bone. Adipose tissue is the primary energy depot in the human body. It has classically been categorized into three types: white adipose tissue (WAT), brown adipose tissue (BAT), and beige adipose tissue, depending on anatomical location and composition.36 WATs store excess energy in the form of triglyceride droplets and release fatty acids (FAs) in response to energy depletion. They also serve as an endocrine organ, capable of secreting several adipokines to regulate body metabolism and inflammation.37 Brown adipocytes, on the other hand, are rich in mitochondria that contain uncoupling protein‐1 (UCP‐1), which dissipates energy into heat.38 Beige adipocytes are similar to brown adipocytes within WAT. Beige adipose tissue is rich in UCP‐1 as well, and is activated in response to cold exposure or catecholamines.39, 40
BMAT appears to have properties of all these adipose depots, but also functions as a distinct energy depot. For example, although WAT decreases during starvation, BMAT in fact increases and packs the BM, supporting an evolutionary function as the last energy depot during starvation and demonstrating a very different physiological response pattern from WAT.14 The gene‐expression profile of BMAT has both WAT and BAT characteristics.41 In addition, BMAT stores triglycerides and releases FAs that can be subsequently used to generate adenosine triphosphate (ATP). BMAT has similar histological characteristics to WAT; BMAs store triglycerides as unilocular intracellular lipid droplets, but BAT expresses gene markers such as deiodinase 2, peroxisome proliferation‐activated receptor gamma coactivator 1‐alpha, Forkhead box protein C2, and PR domain containing 16.42 BMAT is also considered to be an endocrine organ because of its capability to secrete several cytokines and adipokines, as well as hormones including leptin, which regulates energy intake, and adiponectin, which regulates glucose metabolism and insulin sensitivity.14 BMAs also secrete cytokines such as IL‐6 and TNFα, as well as other factors that enhance tumor growth, invasion, and survival.43, 44
There are two BMA subpopulations: constitutive BMA (cBMA) and regulated BMA (rBMA). These two types of BMAs are region‐specific and have differences in their development, function, regulation, size, and lipid composition, as well as gene expression.45 cBMAs arise during early life in distal tibias and caudal vertebras in mice, whereas rBMAs accumulate with age and are located in the long bones and at active sites of hematopoiesis.45 Interestingly, constitutive BMAs, unlike regulated BMAs, are not responsive to lipolytic signals such as cold exposure or certain diseases (eg, congenital generalized lipodystrophy type 4).45
Fat accumulation within the BM is a normal process seen within bone maturation during puberty46 and aging. BMAT constitutes 50% to 70% of BM volume, or ≥70% in the elderly.47 BMAT also accounts for 5% to 10% of the total fat mass in healthy adult humans.14, 48 However, excessive BMAT accumulation is also observed following diverse clinical conditions such as exposure to radiation, chemotherapy, and glucocorticoid treatment, or following starvation, as in patients with anorexia nervosa.15, 46, 49, 50 Furthermore, lifestyle influences (such as unloading of bones, seen in astronauts or during extensive bedrest) and obesity can also increase BMAT,51 whereas exercise and mechanical stimulation can decrease BMAT.51, 52, 53 Exercise may reduce BMAT by enhancing energy expenditure and FA β‐oxidation.51
The supportive effects of BMAT on multiple myeloma
The BM niche is an attractive site for various types of cancer, including breast and prostate cancer, as well as hematological malignancies such as MM. The BM microenvironment supports tumor growth, invasion, and survival through evasion of the immune system. Recently, BMAT has been shown to support cancer bone metastasis and drug resistance.(10) Emerging epidemiological studies have shown an association between obesity and MM.3, 10, 43, 44, 54 A meta‐analysis of prospective cohorts has shown an association between a high incidence of MM and being overweight; obesity is a poor prognostic factor for myeloma disease.55 Obesity is also associated with increased BMAT, which may provide an optimal microenvironment of myeloma cells to grow, survive, and become drug resistant.55, 56 Adipocytes have been shown to support cancerous cell growth and survival by influencing cell mitochondrial activity and lipid metabolism, which we will discuss next.57, 58
Because obesity and aging are both risk factors for MM and correlate with increased BMAT, BMAs may enhance MM engraftment and growth within the BM.24, 59 In vitro culture of BMAs isolated from MM patients has been shown to support myeloma growth and enhance chemoresistance by activating autophagy through leptin, leading to inhibition of caspase cleavage and apoptosis.31 We have seen similar results in our lab,17 and also observed that BMAs shrink when cocultured with MM cells, perhaps indicating lipolysis or some other form of delipidation.60 Furthermore, adipocytes have been shown to support ovarian cancer cells. Ovarian cancer cells enhanced lipolysis and fatty acid oxidation (FAO) when cocultured with adipocytes, which supported tumor growth in in vitro and in vivo studies.61 These studies suggest that BMAT might support myelomagenesis and enhance myeloma cell growth in patients.
Metabolism of Plasma Cells and B Lymphocytes
Plasma cells represent a unique type of immune cell that are committed to producing an immense amount of antibodies, the major determinant of protective humoral immunity, for as long as they live. The metabolic regulation of B‐cell proliferation and plasma cell differentiation that is required to support antibody synthesis, folding, and secretion is relatively unknown. Caro‐Maldonado and colleagues62 have shown that stimulation of B lymphocytes, either by lipopolysaccharides (LPSs) or by B‐cell receptors, increases lactate production and oxygen consumption rate (OCR), as well as glucose transporter 1 and mitochondrial mass.62 Interestingly, they showed that ex vivo stimulation of B lymphocytes by LPSs increased both glycolytic and mitochondrial metabolic activity, suggesting that B lymphocytes have potential metabolic flexibility to resist the loss of nutrients. Furthermore, targeting glycolytic pathways in both in vitro and in vivo studies disrupted antibody production.62 Further studies have shown that B lymphocytes undergo metabolic adaptation by increasing mitochondrial biogenesis and glucose uptake.63, 64 A recent study showed that activated B lymphocytes upregulate oxidative phosphorylation (OXPHOS), the tricarboxylic acid cycle (TCA), and nucleotide biosynthesis, but not glycolysis. Inhibiting OXPHOS or culturing B lymphocytes with glutamine‐free media causes a reduction in their proliferation and differentiation, suggesting that activated B cells utilize glutamine to fuel the TCA. Although glucose can be directed to the pentose phosphate pathway to generate ribose‐5‐phosphate for DNA and RNA synthesis, it can also be directed toward lipid synthesis via de novo fatty acid synthesis to support the rapid replication of activated B cells.64 Activation of B lymphocytes by LPS upregulates ATP‐citrate lyase (ACLY) levels and activity, generating cytosolic acetyl‐CoA released from the mitochondria.65 Inhibiting ACLY in activated B lymphocytes can block glucose‐dependent de novo fatty acid synthesis. Furthermore, inhibition of ACLY activity inhibits splenic B‐cell proliferation and decreases expression of CD138, a plasma cell marker, and Blimp1, a transcription factor that drives the terminal differentiation of B cells to plasma cells.65 These studies showed that B cells are metabolically flexible to support the production and secretion of antibodies.
Multiple Myeloma and Fatty Acid Metabolism
Alterations in cellular metabolism are common features of cancers, including myeloma. It is likely that interactions between MM cells and BM stromal cells affect, and are affected by, metabolic changes in both myeloma and stromal cells. BMAs provide a unique stromal cell type for myeloma cells to interact with and may produce FAs from their triglyceride stores that may feed neighboring myeloma or other tumor cells. Targeting fatty acid metabolism has great potential to constrain MM progression, as discussed herein.
Fatty acid uptake
FAs are essential for the biosynthesis of membranes and signaling molecules, and as substrates for energy production. FAs have long been considered to pass the cell membrane via simple diffusion, but over the past few years, studies have demonstrated the presence of various FA transporters integrated in the cell membrane as well as in the cytosol (Fig. 1).66, 67 A number of proteins have been identified to enhance the uptake of FAs into cells, including CD36/fatty acid translocase, the fatty acid binding protein (FABP) family, and the fatty acid transport protein (FATP) family.68 These proteins are ubiquitously expressed, and some of these transporters are tissue specific.69 Interestingly, most tissues have coexpression of different FA transporters.70 CD36 or fatty acid translocase (FAT) is a multifunctional transmembrane glycoprotein that enhances cellular FA uptake and has been considered a general marker of metastatic cancers. FAT was found to be involved in platelet activation and adhesion71 and has also been implicated in contributing to cancer development.72, 73
Figure 1.
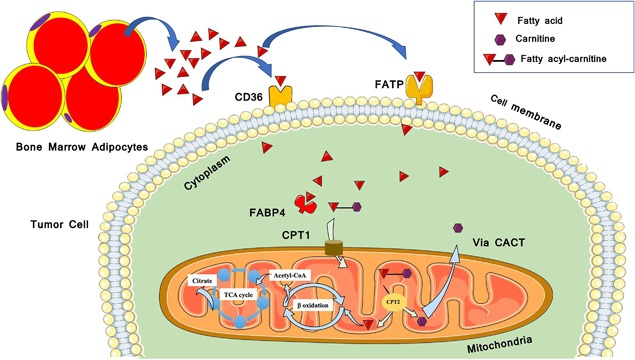
A schematic diagram of extracellular fatty acid (FA) uptake into the cell mediated by several transport proteins. Extracellular FAs are transferred across the plasma membrane by the action of fatty acid transport proteins (FATPs) and fatty acid translocase (FAT/CD36). In the cytoplasm free fatty‐acids (FFAs) bind to cytoplasmic fatty acid binding proteins (FABPs), to be delivered for further metabolism (eg, oxidation in the mitochondria). CPT1 = carnitine palmitoyltransferase 1; CPT2 = carnitine palmitoyltransferase 2; TCA cycle = tricarboxylic acid cycle; CACT = carnitine‐acylcarnitine translocase. (This figure was created using Servier Medical Art templates, which are licensed under a Creative Commons Attribution 3.0 Unported License; https://smart.servier.com.)
Fatty acid transport proteins
FATPs are a family of six related proteins involved in FA uptake and activation, although it remains controversial as to whether these are FA transporters or acyl‐coA synthetases. These proteins are widely expressed in different tissues.74 FATPs in general can both transport and activate FAs by acting as fatty acyl‐CoA synthetase (ACS) enzymes. However, one FATP (long‐chain fatty acid transport protein 3, known as SLC27A3, ACSVL3, or FATP3) is found primarily in the mitochondria and is an ACS capable of activating bone long‐chain (C16:0) and very long‐chain (C24:0) FAs, but has not shown evidence of affecting FA uptake.75 Fatty acyl‐CoA synthetase is an enzyme responsible for the activation of FAs to CoA esters (formation of fatty acyl CoA), which is important for anabolic and catabolic FA metabolism (including de novo FA synthesis as well as FA‐β oxidation).69
Recently, researchers have described a role for FATPs in tumor metabolism. Blask and colleagues found that increased FATPs enhance FA uptake in rat hepatomas.76 Zhang et al. showed that melanoma cells express FATPs, and that these proteins mediate transport of FAs from subcutaneous adipocytes to the tumor cells, which utilize FAs to fuel their growth and proliferation.77 Interestingly, blocking FATP reduced melanoma growth and lipid content both in in vitro and in vivo studies.77 However, as it is not clear yet how FATPs mediate FA uptake, and which FATPs have FA uptake and acyl‐CoA synthetase activity, more research into the roles of FATPs in cancer is needed. Although FATPs display many characteristics of a transporter, it is uncertain which of the family members are bona fide transporters, enzymes with ACS activity, or bifunctional proteins. Moreover, more research is needed into which types of fatty acid transport proteins are required for import as well as activation of FAs, and the role of plasticity in allowing tumor cells to adapt to using different types of fatty acid transport proteins if necessary.78
Fatty acid binding proteins
Malignant cells also increase FA trafficking through the upregulation of FABPs. FABPs are a family of proteins that are found in various tissues and play an important role in FA metabolism. FABPs facilitate the transport of long‐chain FAs (LCFAs) intracellularly and regulate lipid synthesis and oxidation.79 Changes in FABP family gene expression patterns have been associated with the development of various diseases including tumor development.80 FABPs are upregulated in various tumor cells such as prostate,81 breast,82 and other cancers.83 Glioma and breast cancer cells can increase their extracellular FA uptake through the upregulation of FABP3 and FABP7.84 FABP4, the adipocyte fatty acid binding protein (A‐FABP) is involved in fatty acid trafficking and storage,85 and carries unesterified FAs from the cell membrane into different cellular organelles.86 It is involved in glucose and lipid metabolism, signal transduction, and apoptosis in both normal and cancerous (eg, prostate and breast cancer) cells.87 Interestingly, endogenous FABP4 is functionally responsible for aggressive patterns of disease that likely contribute to poor prognosis in ovarian cancer,88 and exogenous FABP4 has also been found to be involved in prostate cancer development and progression.89 Uehara and colleagues showed that inhibiting FABP4 decreased cell invasion in vitro, whereas in vivo, an FABP4 inhibitor reduced subcutaneous growth and lung metastasis of prostate cancer.89 Contrarily, Celis et al. have shown a high level of expression of FABP4 in normal prostate cells, whereas loss of the endogenous FABP4 has been correlated with human prostate cancer progression, although compensation through increases in other FABP family members was also observed.90, 91 In addition, FABP4 has been shown to enhance the proliferation of metastatic prostate and ovarian cancer cells by increasing lipid availability and FAO.61, 92 Inhibiting FABP4 reduced adipocyte‐induced tumor cell invasion.92 Serum fingerprinting of myeloma patient versus normal donor serum samples also demonstrated a significant increase in FABP4 protein.93 Other FABPs are also involved in cancer development; for example, FABP1 is involved in hepatocellular carcinoma,94 whereas elevated levels of FABP2 have been shown in intestinal malignancies.95 Similarly, FABP5 and FABP6 were upregulated in colorectal cancer.96, 97
FA building blocks come either from exogenous sources or from de novo FA synthesis. De novo FA synthesis is an anabolic process that relies on the tandem activation of the FA biosynthetic enzymes adenosine triphosphate citrate lyase (ACLY), acetyl‐CoA carboxylase (ACC), and fatty acid synthase (FASN). However, glycolytic and fatty acid synthesis pathways are known to be affected and deregulated by oncogenes and tumor suppressor genes.98, 99 Limited evidence also suggests that cancer cells have altered expression or activity of the enzymes involved with FAO.100, 101, 102
Fatty acid oxidation
Recently, FAO has become a stimulating area of interest in cancer metabolism.102 The process of FAO produces nicotinamide adenine dinucleotide (NADH), nicotinamide adenine dinucleotide phosphate (NADPH), flavin adenine dinucleotide (FADH2), and ATP. During FAO, FAs are converted into long‐chain acyl‐CoA by long‐chain acyl‐CoA synthetase (LACS). Acyl‐CoAs are then converted into acyl‐carnitines by carnitine palmitoyltransferase 1 (CPT1) (Fig. 2), a mitochondrial enzyme expressed on its outer membrane. CPT1 is the rate‐limiting step of FAO, responsible for the formation of acyl‐carnitine, by transferring the acyl group from fatty acyl‐CoA to carnitine, which is then transported across the outer mitochondrial membrane into the mitochondrial matrix.102, 103 A translocase then shuttles the acyl‐carnitine across the inner mitochondrial membrane where it is converted back into palmitoyl‐CoA. Once inside the mitochondrial matrix, the acyl‐CoA undergoes a series of reactions, each releasing NADH and FADH2. This process produces a great deal of energy for the cell; in fact, 1 g of FA (eg, palmitic acid) can produce twice as much ATP as the metabolism of 1 g of glucose (6 carbons) when the palmitic acid is fully oxidized.104, 105
Figure 2.
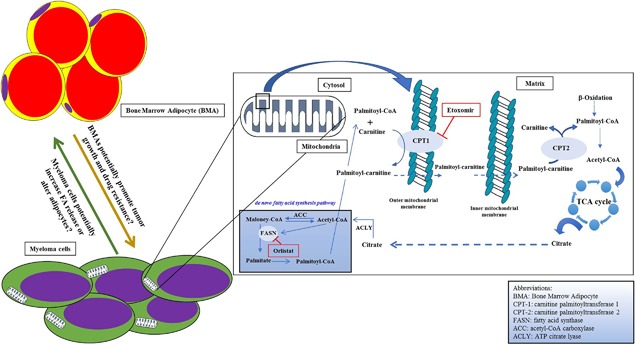
Multiple myeloma and fatty acid metabolism. This model demonstrates how inhibiting fatty acid oxidation might limit myeloma cell growth. In general, blocking the CPT1 enzyme reduces mitochondria fatty acid (FA) uptake and decrease FA β‐oxidation. Targeting CPT1 specifically in myeloma cells may be a novel method for therapeutically targeting and inducing death in these tumor cells.
LCFAs range from 12 to 18 carbons long and are an important source of energy for most cells, exclusive of brain cells. As LCFAs cannot pass through the mitochondrial inner membrane by mere diffusion, these FAs have to be actively transported by a specialized system called the carnitine system/shuttle (CS).106 The CS consists of four enzymes: carnitine palmitoyltransferase I (CPT1), carnitine palmitoyltransferase II (CPT2), carnitine‐acyl‐carnitine translocase (CACT), and carnitine acetyltransferase (CRAT).
The CPT1 family constitutes the rate‐limiting step of FAO and comprises three different enzymes: CPT1A (which is present mostly in the liver), CPT1B (which is expressed mainly in the muscles), and CPT1C (mainly expressed in the brain). Overexpression of CPT1A has been shown to be associated with tumor progression in several cancer types such as breast cancer,107 prostate cancer,108 lymphoma, and leukemia.109 Similarly, others have shown that inhibition of this enzyme increases apoptosis and suppresses cancer cell proliferation, neovascularization, and chemoresistance.110, 111, 112 Furthermore, CPT1A is hypothesized to be involved in cell survival by stimulating histone acetylase activity,113 protecting cells from apoptosis by removing long‐chain fatty acyl‐CoA (eg, palmitoyl‐CoA) from the cytoplasm, and preventing the production of the “palmitate/palmitoyl‐CoA/ceramide” complex involved in apoptosis activation.114
Etomoxir (2[6(4‐chlorophenoxy) hexyl] oxirane‐2‐carboxylate) is a safe, irreversible inhibitor of CPT1A and is commonly used to inhibit CPT1A in heart‐failure patients.115 Etomoxir blocks the transfer of LCFAs into the mitochondria for β‐oxidation. Recently, researchers have found that pharmacological inhibition of CPT1A by etomoxir altered cancer cell proliferation in acute myeloid leukemia (AML) and Burkitt's lymphoma.109, 116 In the lymphoma study, inhibition of FAO reduced c‐myc‐mediated lymphomagenesis, suggesting a potential role of CPT1A in the pathogenesis of c‐myc‐associated cancers.116 In addition, Shao and colleagues showed inhibition of CPT1A reduced cellular ATP levels and induced cell‐cycle arrest at G0/G1 in ovarian cancer cells in vitro.117 Concomitant pharmacological inhibition of CPT1A and the FASN enzyme with orlistat decreased prostate cancer cell viability in vitro. Decreasing FAO and FA synthesis decreased mTOR and AKT signaling and increased caspase‐3 activity.118, 119 Etoxomir and orlistat also inhibited β‐oxidation and de novo fatty acid synthesis, respectively, in myeloma cells, without significantly altering glucose metabolism.120 The drugs each reduced MM cell viability, caused cell‐cycle arrest in G0/G1, and reduced proliferation of MM cells by 40% to 70%.120 The combination of etoxomir and orlistat resulted in an additive inhibitory effect on cell proliferation. Orlistat, but not etoxomir, also sensitized MM cells to bortezomib.120 The inhibitory effect of these drugs on proliferation was associated with reduced p21 protein levels and levels of phosphorylated retinoblastoma protein.120 Moreover, inhibiting FAO proved to be a successful strategy to increase leukemia cell sensitivity to apoptosis induction by ABT‐737, a molecule that releases proapoptotic Bcl‐2 proteins such as Bak from antiapoptotic family members, and provided a substantial therapeutic benefit in a leukemic mouse model.121, 122
Recently, studies showed that etomoxir has significant off‐target effects on T lymphocytes at commonly used concentrations.123, 124 The mitochondria of T cells treated with 50 μM etomoxir had morphological changes and induced acute ROS and severe oxidative stress in proliferating T cells.123 Raud and colleagues showed that high concentrations of etomoxir reduced OCR in both WT and CPT1A‐deficient T cells.124 A high concentration of etomoxir inhibited adenine nucleotide translocator (ANT or ADP/ATP translocase) in the inner mitochondrial membrane, reduced the exchange of ATP in the matrix with ADP, increased the membrane potential of the mitochondria, and reduced OCR.124 These studies show that etomoxir at higher concentrations lacks specificity for CPT1A, and higher concentrations of etomoxir (>5 μM) shoul≏ be used with caution in cell culture experiments for inhibiting FAO.
Wang et al. showed that the JAK/STAT3 signaling pathway upregulates CPT1B expression and FAO activity, which promote breast cancer stem cells and chemoresistance.125 CPT1B was also upregulated in human colorectal cancer,126 and it is also associated with increased mortality in patients with muscle‐invasive bladder carcinoma.127 CPT1C, considered a more brain‐specific CPT1 isoform, plays an important role in the regulation of the hypothalamic food intake and energy expenditure128 with lower carnitine‐transferase activity.129 However, Zaugg and colleagues have shown that constitutive expression of CPT1C in different cancer cells increased FAO and ATP production.130 They showed that CPT1C is upregulated by hypoxia and glucose deprivation in tumor cells, which is mediated by the activation of mitogen‐activated protein kinases (MAPK). Moreover, CPT1C knockdown inhibits human cancer cell lines both in vitro and in vivo.130, 131 CPT1C regulates tumor cell senescence as well, through a metabolic reprogramming of the mitochondria.132 CPT1C depletion enhanced mitochondria dysfunction and cellular senescence, suppressed cell survival, and inhibited tumorigenesis in mice.132
Fatty Acids as Bioactive Molecules
Fatty acids are not only metabolized in MM cells, but also play a host of other roles in MM. One study found that ω‐3 polyunsaturated fatty acids specifically (often thought of as a healthy fat), enhances dexamethasone sensitivity in MM cells.133 The mechanism of this was found to be an increase in miR‐34a in MM cells, which likely suppresses Bcl‐2.133 Fatty acids are also essential in the construction of the plasma membranes of the cell membrane and its organelles. Interestingly, differences in circulating FA profiles in blood plasma have been identified between healthy controls and MM patients: Increased levels of saturated and n‐6 polyunsaturated fatty acids were observed in MM patients, either due to dietary differences or increased endogenous synthesis of these fatty acids perhaps due to increases in desaturase and elongase.134 The consequence of these changes in plasma FAs is unclear, but may relate to immune responses, inflammation, or cell metabolism. Overall, it is clear that more research into the biochemistry, origin, and roles of lipids in patients with MM needs to be undertaken.
Alternatives to Fatty Acid Metabolism in Multiple Myeloma
Another common metabolic pathway for cancer cells is the use of glucose to produce ATP via glycolysis. Glucose is transported across the cell membrane by several transport channels (GLUT 1‐4) and then is processed in the cytosol before entering the mitochondrial matrix in the form of pyruvate. As this is an oxygen‐independent pathway, glycolysis is a well‐investigated metabolic pathway for cancer cells that often survive in hypoxic environments. The pyruvate is then oxidized to form acetyl‐CoA as it enters the Krebs cycle (also known as the tricarboxylic acid cycle or citric acid cycle).135 A well‐known metabolic alteration to this process in cancer cells is the Warburg effect.57 During this process, pyruvate is converted into lactate even in the presence of oxygen, instead of entering into the mitochondria and completing oxidative phosphorylation.57, 135 This is seen with an overall increase in glucose uptake. Malignant cells utilize glucose through aerobic glycolysis (the Warburg effect) at a higher rate than normal cells. The production of lactate from glucose (anaerobic glycolysis) is 10 to 100 times faster than mitochondrial glucose oxidation (aerobic glycolysis), although a comparable amount of ATP is produced when either aerobic or anaerobic glycolysis occurs.136 Consumed glucose is used as a source of carbon to synthesize NADPH as well as ribose phosphate required for nucleotide synthesis through the pentose phosphate pathway (PPP).137
Myeloma patients with high expression of genes related to aerobic glycolysis (NEK2 and PKM2) have lower event‐free survival and overall survival.133 Reelin‐expressing MM cells also display the Warburg effect more strongly than Reelin‐negative MM cells, evidenced by increased glucose uptake and lactate production, which leads to an increase in FAK/Syk/Akt/mTOR and STAT3 pathways, cancer cell growth, and metabolic reprogramming (ie, increased glycolysis).133 Interestingly, the targeting of glycolysis using ritonavir is growth inhibitory and cytotoxic in a subset of MM cells, and sensitized MM cells to metformin because of their increased reliance on glutamine metabolism.133 Glutaminolysis, the process by which glutamine is converted into glutamate in the cytosol, and then broken down into α‐ketoglutarate to enter the mitochondria, is a common metabolic pathway. α‐Ketoglutarate enters the Kreb's cycle to undergo oxidative phosphorylation to produce ATP.57, 135 Ritonavir and metformin effectively elicited cytotoxicity both in vitro and in an in vivo xenograft model of MM, likely by targeting both glycolysis and glutaminolysis.133 The drug combination also suppressed AKT and mTORC1 phosphorylation and prosurvival BCL‐2 family member MCL‐1 expression in MM cell lines in vitro and in vivo.133 Hence, blocking glycolysis and glutamine metabolism may be an important avenue for therapy in MM, in addition to targeting FA metabolism.
Conclusion
Metabolic reprogramming is considered a hallmark of tumor cells. Although not fully understood, FAO may play an essential role in MM metabolism with or without concurrent aerobic glycolysis. Indeed, a metabolic shift from aerobic glycolysis towards more FAO has been reported to increase leukemic cell survival.121 Although multiple myeloma cells have been shown to have abnormally high glucose intake, these cells are often found in an environment with relatively high adiposity (in the bone marrow of aged human), which may shift myeloma cells from aerobic glycolysis to utilize more FAs and produce more energy by FAO. Targeting enzymes involved in FA metabolism or transport, such as CPT1 or FABP4, could be a promising treatment option for MM patients, and this has already been proven effective in leukemia preclinically.121, 122, 138
Disclosures
The other authors have no conflicts of interest.
Acknowledgments
This research utilized services from core facilities at Maine Medical Center Research Institute, which are supported by NIH/NIGMS P20GM121301 (L Liaw, PI), U54GM115516 (C Rosen, PI), and P30GM106391 (R Friesel, PI). The authors’ work is also supported by start‐up funds from the MMCRI, a pilot grant awarded to MR Reagan from the MGH Center for Skeletal Research (NIH/NIAMS P30 AR066261), and a pilot grant from the American Cancer Society (Research Grant #IRG‐16‐191‐33; MR Reagan, PI). The content is solely the responsibility of the authors and does not necessarily represent the official views of the NIH. We also thank Dr Clifford Rosen, Dr Calvin Vary, Dr Carolyne Falank, Connor Murphy, Heather Fairfield, and Mariah Farrell for their discussions about this review topic.
Authors’ roles: Drafting manuscript: all authors; revising manuscript: all authors; approving final version of manuscript: all authors.
References
- 1. Alexander DD, Mink PJ, Adami H‐O, et al. Multiple myeloma: a review of the epidemiologic literature. Int J Cancer. 2007;120(Suppl):40–61. [DOI] [PubMed] [Google Scholar]
- 2. Palumbo A, Anderson K. Multiple myeloma. N Engl J Med. 2011;364(11):1046–60. [DOI] [PubMed] [Google Scholar]
- 3. Fairfield H, Falank C, Avery L, Reagan MR. Multiple myeloma in the marrow: pathogenesis and treatments. Ann N Y Acad Sci. 2016; 1364 (1): 32–51. [DOI] [PMC free article] [PubMed] [Google Scholar]
- 4. Tian E, Zhan F, Walker R, et al. The role of the Wnt‐signaling antagonist DKK1 in the development of osteolytic lesions in multiple myeloma. N Engl J Med. 2003; 349 (26): 2483–94. [DOI] [PubMed] [Google Scholar]
- 5. Guise TA, Mohammad KS, Clines G, et al. Basic mechanisms responsible for osteolytic and osteoblastic bone metastases. Clin Cancer Res. 2006; 12(20 Pt 2):6213s –16s. [DOI] [PubMed] [Google Scholar]
- 6. Takeuchi K, Abe M, Hiasa M, et al. Tgf‐Beta inhibition restores terminal osteoblast differentiation to suppress myeloma growth. PLoS One. 2010; 5 (3):e9870. [DOI] [PMC free article] [PubMed] [Google Scholar]
- 7. Croucher PI, McDonald MM, Martin TJ. Bone metastasis: the importance of the neighbourhood. Nat Rev Cancer. 2016; 16 (6): 373–86. [DOI] [PubMed] [Google Scholar]
- 8. Suva LJ, Washam C, Nicholas RW, Griffin RJ. Bone metastasis: mechanisms and therapeutic opportunities. Nat Rev Endocrinol. 2011;7(4):208–18. [DOI] [PMC free article] [PubMed] [Google Scholar]
- 9. Scheller EL, Cawthorn WP, Burr AA, Horowitz MC, MacDougald OA. Marrow Adipose tissue: trimming the fat. Trends Endocrinol Metab. 2016; 27 (6): 392–403. [DOI] [PMC free article] [PubMed] [Google Scholar]
- 10. Falank C, Fairfield H, Reagan MR. Signaling interplay between bone marrow adipose tissue and multiple myeloma cells. Front Endocrinol (Lausanne). 2016;7:67. [DOI] [PMC free article] [PubMed] [Google Scholar]
- 11. McDonald MM, Fairfield H, Falank C, Reagan MR. Adipose, bone, and myeloma: contributions from the microenvironment. Calcif Tissue Int. 2017;100(5):433–48. [DOI] [PMC free article] [PubMed] [Google Scholar]
- 12. Fowler JA, Lwin ST, Drake MT, et al. Host‐derived adiponectin is tumor‐suppressive and a novel therapeutic target for multiple myeloma and the associated bone disease. Blood. 2011;118(22):5872–82. [DOI] [PMC free article] [PubMed] [Google Scholar]
- 13. Kajimura D, Lee HW, Riley KJ, et al. Adiponectin regulates bone mass via opposite central and peripheral mechanisms through FoxO1. Cell Metab. 2013;17(6):901–15. [DOI] [PMC free article] [PubMed] [Google Scholar]
- 14. Cawthorn WP, Scheller EL, Learman BS, et al. Bone marrow adipose tissue is an endocrine organ that contributes to increased circulating adiponectin during caloric restriction. Cell Metab. 2014; 20 (2): 368–75. [DOI] [PMC free article] [PubMed] [Google Scholar]
- 15. Suchacki KJ, Cawthorn WP, Rosen CJ. Bone marrow adipose tissue: formation, function and regulation. Curr Opin Pharmacol. 2016;28:50–6. [DOI] [PMC free article] [PubMed] [Google Scholar]
- 16. Hardaway AL, Herroon MK, Rajagurubandara E, Podgorski I. Bone marrow fat: linking adipocyte‐induced inflammation with skeletal metastases. Cancer Metas Rev. 2014;33(2–3):527–43. [DOI] [PMC free article] [PubMed] [Google Scholar]
- 17. Falank C, Fairfield H, Farrell M, Reagan MR. New bone cell type identified as driver of drug resistance in multiple myeloma: the bone marrow adipocyte. Blood. 2017; 130(Suppl 1): 122. [Google Scholar]
- 18. Kyle RA, Rajkumar SV. Criteria for diagnosis, staging, risk stratification and response assessment of multiple myeloma. Leukemia. 2009;23(1):3–9. [DOI] [PMC free article] [PubMed] [Google Scholar]
- 19. Kyle RA, Rajkumar SV. Multiple myeloma. Blood. 2008; 111 (6): 2962–72. [DOI] [PMC free article] [PubMed] [Google Scholar]
- 20. Siegel RL, Miller KD, Jemal A. Cancer statistics, 2018. CA. Cancer J Clin. 2018;68(1):7–30. [DOI] [PubMed] [Google Scholar]
- 21. Barlogie B, Shaughnessy J, Tricot G, et al. Treatment of multiple myeloma. Blood. 2004; 103 (1): 20–32. [DOI] [PubMed] [Google Scholar]
- 22. Bergsagel PL, Kuehl WM, Zhan F, Sawyer J, Barlogie B, Shaughnessy J. Cyclin D dysregulation: an early and unifying pathogenic event in multiple myeloma. Blood. 2005;106(1):296–303. [DOI] [PMC free article] [PubMed] [Google Scholar]
- 23. Roy P, Sarkar UA, Basak S. The NF‐ κ B activating pathways in multiple myeloma. Biomedicines. 2018; 6 (2): 59. [DOI] [PMC free article] [PubMed] [Google Scholar]
- 24. Reagan MR, Liaw L, Rosen CJ, Ghobrial IM. Dynamic interplay between bone and multiple myeloma: emerging roles of the osteoblast. Bone. 2015;75:161–9. [DOI] [PMC free article] [PubMed] [Google Scholar]
- 25. Reagan MR, Rosen CJ. Navigating the bone marrow niche: translational insights and cancer‐driven dysfunction. Nat Rev Rheumatol 2016; 12 (3): 154–68. [DOI] [PMC free article] [PubMed] [Google Scholar]
- 26. Manier S, Sacco A, Leleu X, Ghobrial IM, Roccaro AM. Bone marrow microenvironment in multiple myeloma progression. J Biomed Biotechnol. 2012; 2012: 157496. [DOI] [PMC free article] [PubMed] [Google Scholar]
- 27. Pagnucco G, Cardinale G, Gervasi F. Targeting multiple myeloma cells and their bone marrow microenvironment. Ann N Y Acad Sci. 2004; 1028:390–9. [DOI] [PubMed] [Google Scholar]
- 28. Ghobrial IM. Myeloma as a model for the process of metastasis: implications for therapy. Blood. 2012; 120 (1): 20–30. [DOI] [PMC free article] [PubMed] [Google Scholar]
- 29. Kingsley LA, Fournier PGJ, Chirgwin JM, Guise TA. Molecular biology of bone metastasis. Mol Cancer Ther. 2007; 6 (10): 2609–17. [DOI] [PubMed] [Google Scholar]
- 30. Buenrostro D, Mulcrone PL, Owens P, Sterling JA. The bone microenvironment: a fertile soil for tumor growth. Curr Osteoporos Rep. 2016; 14 (4): 151–8. [DOI] [PMC free article] [PubMed] [Google Scholar]
- 31. Liu Z, Xu J, He J, et al. Mature adipocytes in bone marrow protect myeloma cells against chemotherapy through autophagy activation. Oncotarget. 2015;6(33):34329–41. [DOI] [PMC free article] [PubMed] [Google Scholar]
- 32. Lecka‐Czernik B, Stechschulte LA. Bone and fat: a relationship of different shades. Arch Biochem Biophys. 2014;561:124–9. [DOI] [PubMed] [Google Scholar]
- 33. Fairfield H, Falank C, Harris E, et al. The skeletal cell‐derived molecule sclerostin drives bone marrow adipogenesis. J Cell Physiol. 2017; 233 (2): 1156–67. [DOI] [PMC free article] [PubMed] [Google Scholar]
- 34. Hardouin P, Rharass T, Lucas S. Bone marrow adipose tissue: to be or not to be a typical adipose tissue? Front Endocrinol (Lausanne). 2016; 7: 85. [DOI] [PMC free article] [PubMed] [Google Scholar]
- 35. Shen W, Scherzer R, Gantz M, et al. Relationship between MRI‐measured bone marrow adipose tissue and hip and spine bone mineral density in African‐American and Caucasian participants: the CARDIA study. J Clin Endocrinol Metab. 2012;97(4):1337–46. [DOI] [PMC free article] [PubMed] [Google Scholar]
- 36. Rosen ED, Spiegelman BM. What we talk about when we talk about fat. Cell. 2014; 156 (0): 20–44. [DOI] [PMC free article] [PubMed] [Google Scholar]
- 37. Coelho M, Oliveira T, Fernandes R. Biochemistry of adipose tissue: an endocrine organ. Arch Med Sci. 2013; 9 (2): 191–200. [DOI] [PMC free article] [PubMed] [Google Scholar]
- 38. Seale P, Lazar MA. Brown fat in humans: turning up the heat on obesity. Diabetes. 2009; 58 (7): 1482–4. [DOI] [PMC free article] [PubMed] [Google Scholar]
- 39. Cohen P, Spiegelman BM. Brown and beige fat: molecular parts of a thermogenic machine. Diabetes. 2015;64(7):2346–51. [DOI] [PMC free article] [PubMed] [Google Scholar]
- 40. Wang Q, Zhang M, Ning G, et al. Brown adipose tissue in humans is activated by elevated plasma catecholamines levels and is inversely related to central obesity. PLoS One. 2011; 6 (6): e21006. [DOI] [PMC free article] [PubMed] [Google Scholar]
- 41. Lecka‐Czernik B. Marrow fat metabolism is linked to the systemic energy metabolism. Bone. 2012; 50: 534–9. [DOI] [PMC free article] [PubMed] [Google Scholar]
- 42. Krings A, Rahman S, Huang S, Lu Y, Czernik PJ, Lecka‐Czernik B. Bone marrow fat has brown adipose tissue characteristics, which are attenuated with aging and diabetes. Bone. 2012; 50: 546–52. [DOI] [PMC free article] [PubMed] [Google Scholar]
- 43. Caers J, Deleu S, Belaid Z, et al. Neighboring adipocytes participate in the bone marrow microenvironment of multiple myeloma cells. Leukemia. 2007; 21 (7): 1580–4. [DOI] [PubMed] [Google Scholar]
- 44. Morris E.V., Edwards CM. The role of bone marrow adipocytes in bone metastasis. J Bone Oncol. 2016; 5 (3): 121–3. [DOI] [PMC free article] [PubMed] [Google Scholar]
- 45. Scheller EL, Doucette CR, Learman BS, et al. Region‐specific variation in the properties of skeletal adipocytes reveals regulated and constitutive marrow adipose tissues. Nat Commun. 2015; 6: 7808. [DOI] [PMC free article] [PubMed] [Google Scholar]
- 46. Rosen CJ, Klibanski A. Bone, fat, and body composition: evolving concepts in the pathogenesis of osteoporosis. Am J Med. 2009;122(5):409–14. [DOI] [PubMed] [Google Scholar]
- 47. Veldhuis‐Vlug AG, Rosen CJ. Clinical implications of bone marrow adiposity. J Intern Med. 2018; 283 (2): 121–39. [DOI] [PMC free article] [PubMed] [Google Scholar]
- 48. Fazeli PK, Horowitz MC, MacDougald OA, et al. Marrow fat and bone‐new perspectives. J Clin Endocrinol Metab. 2013; 98 (3): 935–45. [DOI] [PMC free article] [PubMed] [Google Scholar]
- 49. Bredella MA, Fazeli PK, Miller KK, et al. Increased bone marrow fat in anorexia nervosa. J Clin Endocrinol Metab. 2009; 94 (6): 2129–36. [DOI] [PMC free article] [PubMed] [Google Scholar]
- 50. Devlin MJ, Cloutier AM, Thomas NA, et al. Caloric restriction leads to high marrow adiposity and low bone mass in growing mice. J Bone Miner Res. 2010; 25 (9): 2078–88. [DOI] [PMC free article] [PubMed] [Google Scholar]
- 51. Styner M, Thompson WR, Galior K, et al. Bone marrow fat accumulation accelerated by high fat diet is suppressed by exercise. Bone. 2014; 64: 39–46. [DOI] [PMC free article] [PubMed] [Google Scholar]
- 52. Rantalainen T, Nikander R, Heinonen A, Cervinka T, Sievänen H, Daly RM. Differential effects of exercise on tibial shaft marrow density in young female athletes. J Clin Endocrinol Metab. 2013; 98 (5): 2037–44. [DOI] [PubMed] [Google Scholar]
- 53. Krishnamoorthy D, Frechette DM, Adler BJ, Green DE, Chan ME, Rubin CT. Marrow adipogenesis and bone loss that parallels estrogen deficiency is slowed by low‐intensity mechanical signals. Osteoporos Int. 2016. Feb; 27(2): 747–56. [DOI] [PubMed] [Google Scholar]
- 54. Morris EV, Edwards CM. Adipokines, adiposity, and bone marrow adipocytes: dangerous accomplices in multiple myeloma. J Cell Physiol. 2018. Dec; 233(12):9159–66. [DOI] [PubMed] [Google Scholar]
- 55. Wallin A, Larsson SC. Body mass index and risk of multiple myeloma: a meta‐analysis of prospective studies. Eur J Cancer. 2011; 47 (11): 1606–15. [DOI] [PubMed] [Google Scholar]
- 56. Islam R, Altundag K, Kurt M, Altundag O, Turen S. Association between obesity and multiple myeloma in postmenopausal women may be attributed to increased aromatization of androgen in adipose tissue. Med Hypotheses. 2005; 65 (5): 1001–2. [DOI] [PubMed] [Google Scholar]
- 57. Currie E, Schulze A, Zechner R, Walther TC, Farese RV. Cellular fatty acid metabolism and cancer. Cell Metab. 2013; 18 (2): 153–61. [DOI] [PMC free article] [PubMed] [Google Scholar]
- 58. Luo X, Cheng C, Tan Z, et al. Emerging roles of lipid metabolism in cancer metastasis. Mol Cancer. 2017; 16 (1): 76. [DOI] [PMC free article] [PubMed] [Google Scholar]
- 59. Trotter TN, Gibson JT, Sherpa TL, Gowda PS, Peker D, Yang Y. Adipocyte‐lineage cells support growth and dissemination of multiple myeloma in bone. Am J Pathol. 2016; 186(11): 3054–63. [DOI] [PMC free article] [PubMed] [Google Scholar]
- 60. Fairfield H, Falank C, Farrell M, et al. Development of a 3D bone marrow adipose tissue model. Bone. 2019. Jan; 118: 77–88. [DOI] [PMC free article] [PubMed] [Google Scholar]
- 61. Nieman KM, Kenny HA, Penicka CV, et al. Adipocytes promote ovarian cancer metastasis and provide energy for rapid tumor growth. Nat Med. 2011; 17 (11): 1498–503. [DOI] [PMC free article] [PubMed] [Google Scholar]
- 62. Caro‐Maldonado A, Wang R, Nichols AG, et al. Metabolic reprogramming is required for antibody production that is suppressed in anergic but exaggerated in chronically BAFF‐exposed B cells. J Immunol. 2014; 192 (8): 3626–36. [DOI] [PMC free article] [PubMed] [Google Scholar]
- 63. Jellusova J, Cato MH, Apgar JR, et al. Gsk3 is a metabolic checkpoint regulator in B cells. Nat Immunol. 2017; 18 (3): 303–12. [DOI] [PMC free article] [PubMed] [Google Scholar]
- 64. Waters LR, Ahsan FM, Wolf DM, Shirihai O, Teitell MA. Initial B cell activation induces metabolic reprogramming and mitochondrial remodeling. iScience. 2018. Jul; 5: 99–109. [DOI] [PMC free article] [PubMed] [Google Scholar]
- 65. Dufort FJ, Gumina MR, Ta NL, et al. Glucose‐dependent de novo lipogenesis in B lymphocytes: a requirement for atp‐citrate lyase in lipopolysaccharide‐induced differentiation. J Biol Chem. 2014. Mar; 289(10):7011–24. [DOI] [PMC free article] [PubMed] [Google Scholar]
- 66. Storch J, Thumser AE. The fatty acid transport function of fatty acid‐binding proteins. Biochim Biophys Acta − Mol Cell Biol Lipids. 2000; 1486 (1): 28–44. [DOI] [PubMed] [Google Scholar]
- 67. Stahl A, Gimeno RE, Tartaglia LA, Lodish HF. Fatty acid transport proteins: a current view of a growing family. Trends Endocrinol Metab. 2001; 12 (6): 266–73. [DOI] [PubMed] [Google Scholar]
- 68. Brinkmann JFF, Abumrad NA, Ibrahimi A, van der Vusse GJ, Glatz JFC. New insights into long‐chain fatty acid uptake by heart muscle: a crucial role for fatty acid translocase/CD36. Biochem J. 2002;367(Pt 3):561–70. [DOI] [PMC free article] [PubMed] [Google Scholar]
- 69. Gimeno RE. Fatty acid transport proteins. Curr Opin Lipidol. 2007; 18 (3): 271–6. [DOI] [PubMed] [Google Scholar]
- 70. Dutta‐Roy AK. Cellular uptake of long‐chain fatty acids: role of membrane‐associated fatty‐acid‐binding/transport proteins. Cell Mol Life Sci. 2000; 57 (10): 1360–72. [DOI] [PMC free article] [PubMed] [Google Scholar]
- 71. Tandon NN, Kralisz U, Jamieson GA. Identification of glycoprotein IV (CD36) as a primary receptor for platelet‐collagen adhesion. J Biol Chem. 1989; 264 (13): 7576–83. [PubMed] [Google Scholar]
- 72. Pascual G, Avgustinova A, Mejetta S, et al. Targeting metastasis‐initiating cells through the fatty acid receptor CD36. Nature. 2017;541(7635):41–5. [DOI] [PubMed] [Google Scholar]
- 73. Enciu A‐M., Radu E, Popescu ID, Hinescu ME, Ceafalan LC. Targeting CD36 as biomarker for metastasis prognostic: how far from translation into clinical practice? Biomed Res Int. 2018; 2018: 1–12. [DOI] [PMC free article] [PubMed] [Google Scholar]
- 74. Doege H, Stahl A. Protein‐mediated fatty acid uptake: novel insights from in vivo models. Physiology (Bethesda). 2006. Aug; 21: 259–68. [DOI] [PubMed] [Google Scholar]
- 75. Pei Z, Fraisl P, Berger J, Jia Z, Forss‐Petter S, Watkins PA. Mouse very long‐chain acyl‐CoA synthetase 3/fatty acid transport protein 3 catalyzes fatty acid activation but not fatty acid transport in MA‐10 cells. J Biol Chem. 2004; 279 (52): 54454–62. [DOI] [PubMed] [Google Scholar]
- 76. Blask DE, Sauer LA, Dauchy RT, Holowachuk EW, Ruhoff MS, Kopff HS. Melatonin inhibition of cancer growth in vivo involves suppression of tumor fatty acid metabolism via melatonin receptor‐mediated signal transduction events. Cancer Res. 1999; 59 (18): 4693–701. [PubMed] [Google Scholar]
- 77. Zhang M, Di Martino JS, Bowman RL, et al. Adipocyte‐derived lipids mediate melanoma progression via FATP proteins. Cancer Discov. 2018; 8 (8): 1006–25. [DOI] [PMC free article] [PubMed] [Google Scholar]
- 78. Jia Z, Pei Z, Maiguel D, Toomer CJ, Watkins PA. The fatty acid transport protein (FATP) family: very long chain acyl‐CoA synthetases or solute carriers? J Mol Neurosci. 2007; 33 (1): 25–31. [DOI] [PubMed] [Google Scholar]
- 79. Balaban S, Lee LS, Schreuder M, Hoy AJ. Obesity and cancer progression: is there a role of fatty acid metabolism? Biomed Res Int. 2015;2015:1–17. [DOI] [PMC free article] [PubMed] [Google Scholar]
- 80. Amiri M, Yousefnia S, Seyed Forootan F, Peymani M, Ghaedi K, Nasr Esfahani MH. Diverse roles of fatty acid binding proteins (FABPs) in development and pathogenesis of cancers. Gene. 2018;676:171–83. [DOI] [PubMed] [Google Scholar]
- 81. Al Fayi MS, Gou X, Forootan SS, et al. The increased expression of fatty acid‐binding protein 9 in prostate cancer and its prognostic significance. Oncotarget. 2016;7(50):82783–97. [DOI] [PMC free article] [PubMed] [Google Scholar]
- 82. Greenhill C. A‐FABP links obesity and breast cancer. Nat Rev Endocrinol. 2018; 14 (10): 566. [DOI] [PubMed] [Google Scholar]
- 83. Tölle A, Suhail S, Jung M, Jung K, Stephan C. Fatty acid binding proteins (FABPs) in prostate, bladder and kidney cancer cell lines and the use of IL‐FABP as survival predictor in patients with renal cell carcinoma. BMC Cancer. 2011;11(1):302. [DOI] [PMC free article] [PubMed] [Google Scholar]
- 84. Bensaad K, Favaro E, Lewis CA, et al. Fatty acid uptake and lipid storage induced by HIF‐1α contribute to cell growth and survival after hypoxia‐reoxygenation. Cell Rep. 2014; 9 (1): 349–65. [DOI] [PubMed] [Google Scholar]
- 85. Xu A, Wang Y, Xu JY, et al. Adipocyte fatty acid‐binding protein is a plasma biomarker closely associated with obesity and metabolic syndrome. Clin Chem. 2006;52(3):405–13. [DOI] [PubMed] [Google Scholar]
- 86. De Santis ML, Hammamieh R, Das R, Jett M. Adipocyte‐fatty acid binding protein induces apoptosis in DU145 prostate cancer cells. J Exp Ther Oncol. 2004; 4 (2): 91–100. [PubMed] [Google Scholar]
- 87. Guaita‐Esteruelas S, Gumà J, Masana L, Borràs J. The peritumoural adipose tissue microenvironment and cancer. The roles of fatty acid binding protein 4 and fatty acid binding protein 5. Mol Cell Endocrinol. 2018;462:107–18. [DOI] [PubMed] [Google Scholar]
- 88. Gharpure KM, Pradeep S, Sans M, et al. FABP4 as a key determinant of metastatic potential of ovarian cancer. Nat Commun. 2018; 9 (1): 2923. [DOI] [PMC free article] [PubMed] [Google Scholar]
- 89. Uehara H, Takahashi T, Oha M, Ogawa H, Izumi K. Exogenous fatty acid binding protein 4 promotes human prostate cancer cell progression. Int J Cancer. 2014; 135: 2558–68. [DOI] [PubMed] [Google Scholar]
- 90. Celis JE, Ostergaard M, Basse B, et al. Loss of adipocyte‐type fatty acid binding protein and other protein biomarkers is associated with progression of human bladder transitional cell carcinomas. Cancer Res. 1996;56(20):4782–90. [PubMed] [Google Scholar]
- 91. Das R, Hammamieh R, Neill R, Melhem M, Jett M. Expression pattern of fatty acid‐binding proteins in human normal and cancer prostate cells and tissues. Clin. Cancer Res. 2001; 7 (6): 1706–15. [PubMed] [Google Scholar]
- 92. Herroon MK, Rajagurubandara E, Hardaway AL, et al. Bone marrow adipocytes promote tumor growth in bone via FABP4‐dependent mechanisms. Oncotarget. 2013; 4 (11): 2108–23. [DOI] [PMC free article] [PubMed] [Google Scholar]
- 93. Schneiderova P, Pika T, Gajdos P, et al. Serum protein fingerprinting by PEA immunoassay coupled with a pattern‐recognition algorithms distinguishes MGUS and multiple myeloma. Oncotarget. 2017;8(41):69408–21. [DOI] [PMC free article] [PubMed] [Google Scholar]
- 94. Inoue M, Takahashi Y, Fujii T, Kitagawa M, Fukusato T. Significance of downregulation of liver fatty acid‐binding protein in hepatocellular carcinoma. World J Gastroenterol. 2014; 20 (46): 17541. [DOI] [PMC free article] [PubMed] [Google Scholar]
- 95. Bingold TM, Franck K, Holzer K, et al. Intestinal fatty acid binding protein: a sensitive marker in abdominal surgery and abdominal infection. Surg Infect (Larchmt). 2015;16(3):247–53. [DOI] [PubMed] [Google Scholar]
- 96. Kawaguchi K, Senga S, Kubota C, Kawamura Y, Ke Y, Fujii H. High expression of fatty acid‐binding protein 5 promotes cell growth and metastatic potential of colorectal cancer cells. FEBS J. 2016;6(3):190–9. [DOI] [PMC free article] [PubMed] [Google Scholar]
- 97. Ohmachi T, Inoue H, Mimori K, et al. Fatty acid binding protein 6 is overexpressed in colorectal cancer. Clin Cancer Res. 2006; 12 (17): 5090–5. [DOI] [PubMed] [Google Scholar]
- 98. Alvarez JV, Belka GK, Pan TC, et al. Oncogene pathway activation in mammary tumors dictates FDG‐PET uptake. Cancer Res. 2014; 74 (24): 7583–98. [DOI] [PMC free article] [PubMed] [Google Scholar]
- 99. Yoon S, Lee M‐Y, Park SW, et al. Up‐regulation of acetyl‐CoA carboxylase α and fatty acid synthase by human epidermal growth factor receptor 2 at the translational level in breast cancer cells. J Biol Chem. 2007;282(36):26122–31. [DOI] [PubMed] [Google Scholar]
- 100. Lin H, Patel S, Affleck VS, et al. Fatty acid oxidation is required for the respiration and proliferation of malignant glioma cells. Neuro Oncol. 2017; 19 (1): 43–54. [DOI] [PMC free article] [PubMed] [Google Scholar]
- 101. Santos CR, Schulze A. Lipid metabolism in cancer. FEBS J. 2012;279(15):2610–23. [DOI] [PubMed] [Google Scholar]
- 102. Qu Q, Zeng F, Liu X, Wang QJ, Deng F. Fatty acid oxidation and carnitine palmitoyltransferase I: Emerging therapeutic targets in cancer. Cell Death Dis. 2016;7(5):1–9. [DOI] [PMC free article] [PubMed] [Google Scholar]
- 103. Melone MAB, Valentino A, Margarucci S, Galderisi U, Giordano A, Peluso G. The carnitine system and cancer metabolic plasticity. Cell Death Dis. 2018. Feb; 9(2): 228. [DOI] [PMC free article] [PubMed] [Google Scholar]
- 104. Carracedo A, Cantley LC, Pandolfi PP. Cancer metabolism: fatty acid oxidation in the limelight. Nat Rev Cancer. 2013; 13 (4): 227–32. [DOI] [PMC free article] [PubMed] [Google Scholar]
- 105. Darvey IG. How does the ratio of atp yield from the complete oxidation of palmitic acid to that of glucose compare with the relative energy contents of fat and carbohydrate? Biochem Educ. 1998;26(1):22–3. [Google Scholar]
- 106. Longo N, Frigeni M, Pasquali M. Carnitine transport and fatty acid oxidation. Biochim Biophys Acta − Mol Cell Res. 2016; 1863 (10): 2422–35. [DOI] [PMC free article] [PubMed] [Google Scholar]
- 107. Gatza ML, Silva GO, Parker JS, Fan C, Perou CM. An integrated genomics approach identifies drivers of proliferation in luminal‐subtype human breast cancer. Nat Genet. 2014; 46 (10): 1051–9. [DOI] [PMC free article] [PubMed] [Google Scholar]
- 108. Valentino A, Calarco A, Di Salle A, et al. Deregulation of microRNAs mediated control of carnitine cycle in prostate cancer: molecular basis and pathophysiological consequences. Oncogene. 2017;36(43):6030–40. [DOI] [PubMed] [Google Scholar]
- 109. Pacilli A, Calienni M, Margarucci S, et al. Carnitine‐acyltransferase system inhibition, cancer cell death, and prevention of myc‐induced lymphomagenesis. J Natl Cancer Inst. 2013; 105 (7): 489–98. [DOI] [PubMed] [Google Scholar]
- 110. Li J, Zhao S, Zhou X, et al. Inhibition of lipolysis by mercaptoacetate and etomoxir specifically sensitize drug‐resistant lung adenocarcinoma cell to paclitaxel. PLoS One. 2013;8(9):e74623. [DOI] [PMC free article] [PubMed] [Google Scholar]
- 111. Tung S, Shi Y, Wong K, et al. PPARα and fatty acid oxidation mediate glucocorticoid resistance in chronic lymphocytic leukemia. Blood. 2013; 122 (6): 969–80. [DOI] [PubMed] [Google Scholar]
- 112. Schoors S, Bruning U, Missiaen R, et al. Fatty acid carbon is essential for dNTP synthesis in endothelial cells. Nature. 2015; 520 (7546): 192–7. [DOI] [PMC free article] [PubMed] [Google Scholar]
- 113. Mazzarelli P, Pucci S, Bonanno E, Sesti F, Calvani M, Giusto Spagnoli L. Carnitine palmitoyltransferase I in human carcinomas: a novel role in histone deacetylation? Cancer Biol Ther. 2007;6(10):1606–13. [DOI] [PubMed] [Google Scholar]
- 114. Grösch S, Schiffmann S, Geisslinger G. Chain length‐specific properties of ceramides. Prog Lipid Res. 2012. Jan; 51(1): 50–62. [DOI] [PubMed] [Google Scholar]
- 115. Abozguia K, Clarke K, Lee L, Frenneaux M. Modification of myocardial substrate use as a therapy for heart failure. Nat Clin Pract Cardiovasc Med. 2006. Sep; 3(9): 490–8. [DOI] [PubMed] [Google Scholar]
- 116. Ricciardi MR, Mirabilii S, Allegretti M, et al. Targeting the leukemia cell metabolism by the CPT1a inhibition: functional preclinical effects in leukemias. Blood. 2015; 126 (16): 1925–9. [DOI] [PubMed] [Google Scholar]
- 117. Shao H, Mohamed EM, Xu GG, et al. Carnitine palmitoyltransferase 1A functions to repress FoxO transcription factors to allow cell cycle progression in ovarian cancer. Oncotarget. 2016;7(4):3832–46. [DOI] [PMC free article] [PubMed] [Google Scholar]
- 118. Schlaepfer IR, Rider L, Rodrigues LU, et al. Lipid catabolism via CPT1 as a therapeutic target for prostate cancer. Mol Cancer Ther. 2014; 13 (10): 2361–71. [DOI] [PMC free article] [PubMed] [Google Scholar]
- 119. Schlaepfer IR, Glodé LM, Hitz CA, et al. Inhibition of lipid oxidation increases glucose metabolism and enhances 2‐deoxy‐2‐[18f]fluoro‐d‐glucose uptake in prostate cancer mouse xenografts. Mol Imaging Biol. 2015; 17 (4): 529–38. [DOI] [PMC free article] [PubMed] [Google Scholar]
- 120. Tirado‐Vélez JM, Joumady I, Sáez‐Benito A, Cózar‐Castellano I, Perdomo G. Inhibition of Fatty acid metabolism reduces human myeloma cells proliferation. PLoS One. 2012; 7 (9): e46484. [DOI] [PMC free article] [PubMed] [Google Scholar]
- 121. Samudio I, Harmancey R, Fiegl M, et al. Pharmacologic inhibition of fatty acid oxidation sensitizes human leukemia cells to apoptosis induction. J Clin Invest. 2010; 120 (1): 142–56. [DOI] [PMC free article] [PubMed] [Google Scholar]
- 122. Shafat MS, Oellerich T, Mohr S, et al. Leukemic blasts program bone marrow adipocytes to generate a protumoral microenvironment. Blood. 2017; 129 (10): 1320–32. [DOI] [PubMed] [Google Scholar]
- 123. O'Connor RS, Guo L, Ghassemi S, et al. The CPT1a inhibitor, etomoxir induces severe oxidative stress at commonly used concentrations. Sci Rep. 2018; 8 (1): 6289. [DOI] [PMC free article] [PubMed] [Google Scholar]
- 124. Raud B, Roy DG, Divakaruni AS, et al. Etomoxir actions on regulatory and memory T cells are independent of Cpt1a‐mediated fatty acid oxidation. Cell Metab. 2018;28(3):504–515. [DOI] [PMC free article] [PubMed] [Google Scholar]
- 125. Wang T, Fahrmann JF, Lee H, et al. JAK/STAT3‐regulated fatty acid β‐oxidation is critical for breast cancer stem cell self‐renewal and chemoresistance. Cell Metab. 2018; 27 (1): 136–150. [DOI] [PMC free article] [PubMed] [Google Scholar]
- 126. Yeh C‐S., Wang J‐Y., Cheng T‐L., Juan C‐H., Wu C‐H., Lin S‐R. Fatty acid metabolism pathway play an important role in carcinogenesis of human colorectal cancers by microarray‐bioinformatics analysis. Cancer Lett. 2006; 233 (2): 297–308. [DOI] [PubMed] [Google Scholar]
- 127. Kim WT, Yun SJ, Yan C, et al. Metabolic pathway signatures associated with urinary metabolite biomarkers differentiate bladder cancer patients from healthy controls. Yonsei Med J. 2016; 57 (4): 865. [DOI] [PMC free article] [PubMed] [Google Scholar]
- 128. Wolfgang MJ, Cha SH, Millington DS, et al. Brain‐specific carnitine palmitoyl‐transferase‐1c: role in CNS fatty acid metabolism, food intake, and body weight. J Neurochem. 2008;105(4):1550–9. [DOI] [PMC free article] [PubMed] [Google Scholar]
- 129. Wolfgang MJ, Kurama T, Dai Y, et al. The brain‐specific carnitine palmitoyltransferase‐1c regulates energy homeostasis. Proc Natl Acad Sci U S.A. 2006; 103 (19): 7282–7. [DOI] [PMC free article] [PubMed] [Google Scholar]
- 130. Zaugg K, Yao Y, Reilly PT, et al. Carnitine palmitoyltransferase 1C promotes cell survival and tumor growth under conditions of metabolic stress. Genes Dev. 2011;25(10):1041–51. [DOI] [PMC free article] [PubMed] [Google Scholar]
- 131. Wang R, Cheng Y, Su D, et al. Altered resting‐state hippocampal functional networks associated with chemotherapy‐induced prospective memory impairment in breast cancer survivors. J Cancer. 2017;8(18):3675–81. [DOI] [PMC free article] [PubMed] [Google Scholar]
- 132. Wang Y, Chen Y, Guan L, et al. Carnitine palmitoyltransferase 1C regulates cancer cell senescence through mitochondria‐associated metabolic reprograming. Cell Death Differ. 2018; 25 (4): 733–46. [DOI] [PMC free article] [PubMed] [Google Scholar]
- 133. Gu Z, Xia J, Xu H, Frech I, Tricot G, Zhan F. NEK2 promotes aerobic glycolysis in multiple myeloma through regulating splicing of pyruvate kinase. J Hematol Oncol. 2017; 10 (1): 17. [DOI] [PMC free article] [PubMed] [Google Scholar]
- 134. Jurczyszyn A, Czepiel J, Gdula‐Argasińska J, et al. Plasma fatty acid profile in multiple myeloma patients. Leuk Res. 2015; 39 (4): 400–5. [DOI] [PubMed] [Google Scholar]
- 135. El Arfani C, De Veirman K, Maes K, De Bruyne E, Menu E. Metabolic features of multiple myeloma. Int J Mol Sci. 2018. Apr; 19(4). [DOI] [PMC free article] [PubMed] [Google Scholar]
- 136. Shestov AA, Liu X, Ser Z, et al. Quantitative determinants of aerobic glycolysis identify flux through the enzyme GAPDH as a limiting step. Elife. 2014; 3(July2014): 1–18. [DOI] [PMC free article] [PubMed] [Google Scholar]
- 137. Liberti MV, Locasale JW. The Warburg effect: how does it benefit cancer cells? Trends Biochem Sci. 2016. Mar; 41(3): 211–18. [DOI] [PubMed] [Google Scholar]
- 138. Carracedo A, Cantley LC, Pandolfi PP. Cancer metabolism: fatty acid oxidation in the limelight. Nat Rev Cancer. 2013; 13: 227–32. [DOI] [PMC free article] [PubMed] [Google Scholar]