

Abstract
Salt tolerance status at early seedling stage in 30 rice varieties including two tolerant (Pokkali and CSR-36) and two susceptible (IR-29 and IR-64) checks was assessed under different levels of salinity (0, 4, 8 and 16 dS m−1) created by salt mixture of NaCl, CaCl2, Na2SO4 in 7:2:1 ratio. Overall salinity tolerance indices clearly reflected that 17 varieties including the two tolerant checks were highly tolerant, seven varieties exhibited moderately tolerant, whereas six varieties including the two susceptible checks had highly susceptible response to salt stress. Molecular profiling of 13 tolerant and 5 susceptible rice varieties by using 24 SSR markers revealed 8.5 alleles per primer with altogether 114 shared and 91 unique allelic variants. Considering the allele number, polymorphism information content and polymorphism percent, SSR primers RM 302, RM 8094, RM 10665, RM 10694, RM 10748 and RM 10825 appeared to be highly polymorphic and comparatively more informative. Hierarchical classification and spatial distribution patterns based on amplification profiles dependent similarity indices unambiguously discriminated these 18 varieties in accordance with their salt tolerance response. Sequential exclusion of primers in further analysis led to validation of RM 140, RM 1287, RM 3412, RM 10745, RM 10764 and RM 10772 for their efficiency to distinguish salt tolerant varieties from susceptible ones. A specific combination of either four (RM 1287, RM 3412, RM 10764 and RM 10772) or even two markers (RM 1287 and RM 3412) also seemed to be equally effective in discrimination of entries according to their salt stress responsiveness. Principal coordinate analysis completely corroborated hierarchical classification of the varieties. Salt tolerance donors identified and SSR primers validated in the present study may be further utilized in the development of salt stress tolerant varieties of rice.
Keywords: Rice, Salt tolerance, Principal component analysis, SSR markers, Principal coordinate analysis
Introduction
Rice is the second most important food crops cultivated over nearly one-fifth of the total land area covered globally under cereals. Being the staple food for more than half of the global population, rice contributes substantially to their daily calorie intake as the source of carbohydrate and protein (Gopalan et al. 2007; Ali et al. 2014). It is grown under diverse agro-climatic conditions over wide geographical range and exposed to different types of abiotic stresses, in addition to biotic stresses, causing substantial reduction in yield. Soil salinity is the biggest abiotic constraint in rice growing areas of many countries (Senadhira 1987), severely affecting its productivity and production. Salinity represents the presence of increased levels of different types of salts, such as, sodium chloride, calcium and magnesium sulphates and bicarbonates. It is caused by weathering of rocks, heavy irrigation with saline water, entry of sea water into freshwater areas, poor water management, high evaporation and regular use of chemical fertilizers (Kumari et al. 2016a; Kumari et al. 2018b). Salinity is, therefore, a major abiotic problem faced under irrigated as well as rainfed ecosystems, affecting almost all the stages of growth and development, starting from seedling stage to reproductive stage of rice plant (Kumari et al. 2015).
Because of extreme sensitivity exhibited to salt-stress condition, rice is considered as the most salt-sensitive cereal crop (Mass and Hoffman 1977; Shannon et al. 1998) and soil salinity is globally regarded as the most serious abiotic constraint to increased rice production. Several studies have indicated that rice is tolerant during germination and vegetative stage but becomes very sensitive during seedling and reproductive stage (Agnihotri et al. 2006; Ali et al. 2014; Kumari et al. 2018b). Genetic enhancement and development of salt tolerant rice varieties seem to be the best way to overcome the problem of salinity. Past evidences indicate that some success with respect to the enhancement of salt stress tolerance has been achieved in rice, however only modest extent of improvement has been attained in this direction. In order to enhance the extent of salinity tolerance in rice varieties, it is imperative to devise and use appropriate and reliable screening techniques capable of identifying salt tolerant genotypes (Kranto et al. 2016) for exploitation of genetic variability. Screening carried out under laboratory condition to enhance salinity tolerance offers several advantages over screening under field condition (Ali et al. 2014). Furthermore, simple criteria based seedling stage screening can be adopted as a rapid method for this purpose (Ali et al. 2014). Besides in vitro morphological study, different rice varieties also need to be characterized at the molecular level for precise analysis of the genetic variation.
Molecular markers are important tools for characterization of salt tolerant genotypes. Amongst the several classes of molecular markers, SSR marker is considered as the most suitable marker for salt tolerance specific characterization of genotypes, because it is highly polymorphic, highly reproducible, co-dominant and multi-allelic (Ganie et al. 2016). Because of several advantages offered by SSR markers, such markers have been widely used in rice for varietal identification, diversity analysis, identification of introgression in inter-specific crosses, tracing pedigrees, locating genes and quantitative trait loci and assisting in marker aided selection (Wong et al. 2009). Usefulness of SSR markers for germplasm characterization in rice is well established on the basis of the studies on landraces (Thomson et al. 2010), cultivars (Garris et al. 2005) and relatives (Brondani et al. 2003), showing the importance and preference for analysis of genetic differentiation and diversity at molecular level. Additionally, SSR markers have been exploited by many researchers to analyze the complex quantitative character like salinity tolerance (Yeo and Flowers 1986; Ganie et al. 2016) and to determine the chromosomal location of the salt tolerance response related gene(s) in rice (Lang et al. 2001; Singh et al. 2007). A major QTL for salinity stress responsiveness, designated as Saltol, has been mapped on chromosome 1. Reliable molecular markers linked to Saltol have also been reported and used for purposeful screening of the rice genetic resources (Gregorio et al. 1997; Islam et al. 2012). As it is well established, Saltol QTL plays an important role in maintaining the Na+/K+ homeostasis thereby contributing profoundly to tolerance to salinity stress at early seedling stage (Gregorio et al. 1997; Mohammadi-Nejad et al. 2008; Ganie et al. 2016). A purposefully chosen set of SSR markers, specific to target the salt stress responsive genomic regions, can effectively facilitate in unbiased and an unambiguous characterization in relation to response of rice cultivars to salinity stress. Taking all above into consideration, an attempt was made in the present investigation to assess the seedling stage specific salt tolerance status of some rice varieties and to characterize the rice varieties having different extent of adaptation to salt stress by using a panel of SSR markers in order to validate their usefulness in relation to screening of rice genotypes for salt-stress tolerance at seedling stage.
Materials and methods
Experimental materials
A set of thirty rice varieties (Table 1) including two tolerant (Pokkali and CSR-36) and two susceptible (IR-29 and IR-64) checks with diverse genetic backgrounds constituted the basic experimental materials of the present study. These varieties were screened for the assessment of the extent of their salt tolerance at different salinity levels in an experiment conducted in the Molecular Biology Laboratory, Department of Agricultural Biotechnology and Molecular Biology, Dr. Rajendra Prasad Central Agricultural University, Pusa (Samastipur), Bihar.
Table 1.
List of rice varieties evaluated in the present study along with their source
| S. No. | Varieties | Source |
|---|---|---|
| 1. | Pokkali (check) | UAS, Dharwad |
| 2. | CSR-36 (check) | CSSRI, Karnal |
| 3. | IR-29 (check) | IRRI, Philippines |
| 4. | IR-64 (check) | IRRI, Philippines |
| 5. | Kranthi | IGKV, Raipur |
| 6. | Ratnagiri-4 | Landrace, Ratnagiri |
| 7. | Annada | CRRI, Cuttack |
| 8. | Rajendra Dhan-102 | RAU, Pusa |
| 9. | Mandakini | OUAT, Bhubaneswar |
| 10. | Sahbhagi Dhan | CRURRS, Hazaribag |
| 11. | Pusa Sugandh-2 | IARI, New Delhi |
| 12. | Daya | OUAT, Bhubaneswar |
| 13. | Kalinga-3 | OUAT, Bhubaneswar |
| 14. | Sarsa | Landrace, Bihar |
| 15. | Jyothi | KAU, Thrissur |
| 16. | Sanwal Basmati | SKUAST, Srinagar |
| 17. | Saraswathi | RRS, Chinsurah |
| 18. | Golaka | Landrace, Bihar |
| 19. | Pusa-834 | IARI, New Delhi |
| 20. | Shatabdi | CRRI, Cuttack |
| 21. | Duna Sankhi | Landrace, Bihar |
| 22. | Govind | G.B.UAT, Pantnagar |
| 23. | Shanthi | DRR, Hydrabad |
| 24. | Vaisak | Landrace, Bihar |
| 25. | Khira | Landrace, Bihar |
| 26. | Bardhan | AAU, Jorhat |
| 27. | MTU-7029 | ANGRAU, Hydrabad |
| 28. | Pusa Sugandh-5 | IARI, New Delhi |
| 29. | Jyotrirmayee | Titabar, Assam |
| 30. | Badami | OUAT, Bhubaneswar |
Phenotypic evaluation
The methodology adopted during screening for salt tolerance involved overnight soaking of 50 seeds of each rice variety in water. Soaked seeds were treated with 70% ethyl alcohol for 30 s and then washed with distilled water. Thereafter, seeds were treated with 0.1% mercuric chloride (HgCl2) for 10–15 min, rinsed with sterile distilled water thrice and placed for germination on filter paper in petri dish containing different salinity levels (0, 4, 8 and 16 dS m−1) created by using a salt mixture of NaCl, CaCl2, Na2SO4 in 7:2:1 ratio. Petri dishes were kept under laboratory conditions and the experiment was laid out following CRD design (Gomez and Gomez 1984) with three replications. The observation on seed germination was recorded at regular intervals and the final observation was recorded after 30 days. In addition to in vitro seed germination, seedling growth based on dry weights of shoot and root (Reddy and Vaidyanath 1982) was also recorded. Salinity tolerance index representing the relative performance of a variety at a particular level of salinity to that of control was calculated for the two attributes, namely, seed germination and seedling growth. An average value obtained across the attributes and salinity levels yielded the overall salinity tolerance index of the variety under consideration. Salinity tolerance index value obtained for each of the varieties was compared with the mean index (MI) value obtained as average of index value of all the varieties under evaluation. Experimental varieties were then classified into highly tolerant (> MI + ½ Sd), moderately tolerant (MI ± ½ Sd) and highly susceptible (< MI – ½ Sd) groups. Principal component analysis was conducted using a similarity correlation matrix to obtain two-dimensional ordinations of the varieties along the orthogonal coordinate axes.
Genotypic characterization
The survey of genetic polymorphism among 18 varieties, namely, Pokkali, CSR-36, IR-29, IR-64, Mandakini, Pusa Sugandh-2, Saraswathi, Ratnagiri-4, Rajendra Dhan-102, Sahbhagi Dhan, Badami, Sarsa, Jyotrirmayee, MTU-7029, Golaka, Daya, Vaisak, and Shatabdi, out of 30 varieties initially evaluated for germination frequency and seedling growth, was conducted by employing a purposefully chosen and chromosome specific (Chromosome No. 1) panel of 24 SSR markers. Using CTAB method (Doyle and Doyle 1990) with some modifications, total genomic DNA was isolated from the leaves of 15 days old seedlings. The isolated DNA samples were stored at—20 °C in TE buffer and the quality of extracted DNA samples was ascertained by agarose gel (0.8%) electrophoresis and measurement of absorbance at 260 and 280 nm with the help of spectrophotometer (Varian Cary 50 Spectrophotometer). The quantity of extracted DNA in the samples was determined with the help of biospectrometer (Eppendorf).
The information pertaining to SSR primer sequences and repeat motifs of the microsatellite sites flanked by these primer pairs was obtained from rice genome database (http://www.gramene.org) and the most suitable annealing temperature for each of the primer pairs was experimentally determined. The PCR based amplification was carried out with the help of a thermal cycler (Eppendorf) using 15 μl reaction mixture that contained 5X PCR buffer, 1 mM deoxyribonucleotide triphosphates (dNTPs), 10 mM of MgCl2, 5 μM of each forward and reverse primer, 1 unit Taq DNA polymerase (Fermentas) and 20 ng of template DNA. Thermal profile for amplification through PCR was programmed to 1 cycle of 4 min at 94 °C as an initial strand separation step and this was followed by 35 cycles of 1 min at 94 °C for denaturation, 1 min for primer annealing with varying annealing temperature depending on the primer pairs used (54–65 °C) and 2 min at 72 °C for primer extension. Finally, 1 cycle of 10 min at 72 °C was used for final extension and then products generated from amplification reactions were stored at 4 °C till separation and resolution through electrophoresis. The products of amplification reactions were separated using agarose (Fermentas) gels (2%) containing ethidium bromide solution. A 50 bp DNA ladder (Gene ruler, Fermentas) was used as size marker to determine the molecular size of amplified products. Electrophoresis was done at 100 V for 90 min in 0.5X TBE buffer. The gels were the visualized and documented under a gel documentation system (Alpha Innotech) and the molecular size of amplified product was determined in relation to the size of markers in the ladder with the help of alpha view gel reader. Assuming the location of well as initial position (Rf = 0) and the position of migrated dye as final position (Rf = 1) in a frame of reference, the Rf value for each band was determined. The position of amplified products corresponded to the location of the bands along y-axis (ranging from 0 to 1030).
Molecular data analyses
All the entries were scored for the presence and absence of bands, which represented the products of PCR based and SSR primer directed amplification of targeted genomic regions. Binary data matrix was generated by scoring for the presence and absence of bands in all the entries in respect of each of the primer pairs employed during genomic profiling. Efficiency of primer pairs in terms of their ability to yield unique and genotype specific allele(s) was assessed by computing the Polymorphism percent as PP = [un/tn] × 100, where un and tn represent number of unique alleles and total number of alleles detected amongst the varieties, respectively (Kumari et al. 2018a). Allelic diversity of the markers was assessed by calculating the Polymorphic information content (Anderson et al. 1993) of the primer pairs as , where, k is the total number of alleles detected for a marker; Pij is the frequency of the jth allele for ith marker and summation extends over k alleles. Similarity coefficients (Dice 1945) were computed for pair-wise comparisons based on the proportions of shared bands produced by the primers as Similarity coefficient = 2a/(2a + b+c), where, a, b and c represent number of bands shared between Jth and Kth genotypes; number of bands present in Jth genotype but absent in Kth genotype and number of bands absent in Jth genotype but present in Kth genotype, respectively.
Sequential agglomerative hierarchical nested (SAHN) cluster analysis was performed using the data on similarity coefficients and the dendrogram based on similarity indices was obtained by un-weighted pair-group method using arithmetic mean (UPGMA). Analysis was performed with the help of NTSYS-pc software (Rohlf 1997). The pattern of differentiation and divergence at molecular level was examined by identifying the clusters at appropriate phenon level. Principal coordinate analysis of the SSR primers based genetic profiles of rice varieties was conducted and two-dimensional spatial distribution pattern was compared with the results obtained from cluster analysis.
Results and discussion
Phenotyping of rice varieties
Phenotypic evaluation of rice varieties based on their response to salt stress revealed that the germination of seeds initiated within the first week and the first sign of germination was exhibited by the appearance of plumule followed by radical. Only in the case of control (0 dS m−1), the seeds of all the varieties showed germination in the first week. The seeds of all varieties also germinated in the first week at 4 dS m−1 salinity level. But, some seeds of all varieties germinated in the second week due to their exposure to 8, 12 and 16 dS m−1 salinity levels. The frequency of seed germination and seedling growth of all the varieties gradually decreased with increasing concentrations of salt. Germination frequency based salinity tolerance indices across different salinity levels ranged from 82.53 in Daya to 98.87 in Pokkali with general mean of 94.21 ± 5.21. Salinity tolerance index (STI) calculated on the basis of shoot and root dry weights at different levels of salt stresses revealed that the index based on shoot growth was higher than that based on root growth at all concentrations of salt. Based on these comparisons, it was inferred that the shoot growth was less affected than the root growth under salt stress. Numerical value of the seedling growth based index across different salinity levels ranged from 27.12 in Daya to 84.21 in pokkali with general mean of 69.38 ± 19.12. Phenotypic grouping of the rice varieties for their salt tolerance level based on overall salinity tolerance indices across in vitro seed germination and seedling growth (shoot and root dry weight) under salt stress clearly reflected that seventeen varieties, namely, Pokkali, CSR-36, Mandakini, Kranthi, Jyothi, Bardhan, Pusa Sugandh-2, Duna Sankhi, Sanwal Basmati, Ratnagiri-4, Shanthi, Rajendra Dhan-102, Sahbhagi Dhan, Vaisak, Annada, Badami and Jyotrirmayee were highly tolerant to salt stress. All these varieties had overall salt tolerance index value greater (> MI + ½ Sd) than average value obtained over all the varieties under evaluation. Among the remaining entries, Pusa-834, Sarsa, Govind, Khira, Pusa Sugandh-5, MTU-7029 and Saraswathi were found to be moderately salt tolerant (MI ± ½ Sd), whereas varieties IR-29, IR-64, Daya, Kalinga-3, Golaka and Shatabdi with overall salt tolerance index value lesser (< MI − ½ Sd) than average value were regarded as highly susceptible to salt stress.
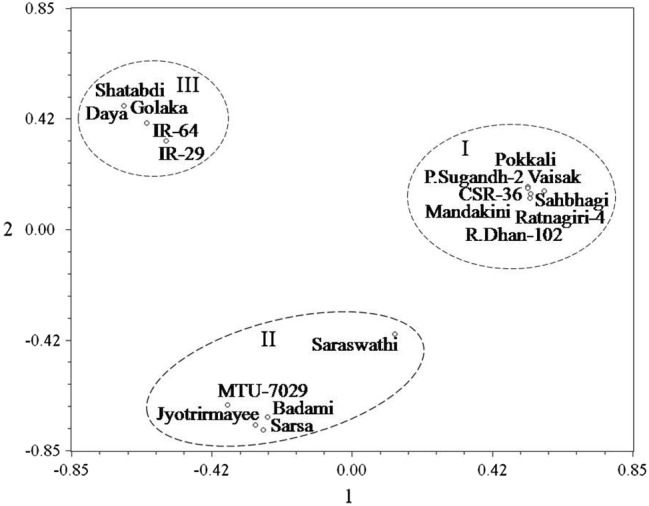
Principal component analysis using a similarity correlation matrix revealed that eigen value from the first principal component axis accounted for 99.8% of the total variance present. The relative magnitude of eigenvectors from the first principal component axis indicated that both seed germination and seedling growth were the important classification variables and contributed equally to the total variation. Principal component analysis, therefore, revealed the importance of these attributes as classification variables in cluster analysis. Spatial distribution pattern of the varieties in two dimensional projections along orthogonal coordinate axes (Fig. 1) clearly separated the six highly susceptible varieties from rest of the varieties, apparently accommodating them into one group (C). Among the seven moderately tolerant varieties, four varieties had closer spatial position and accordingly appeared to be clustered together in another group (B). Remaining three moderately tolerant and seventeen highly tolerant varieties were located to be clustered together with spatial proximity within a separate group (A).
Fig. 1.
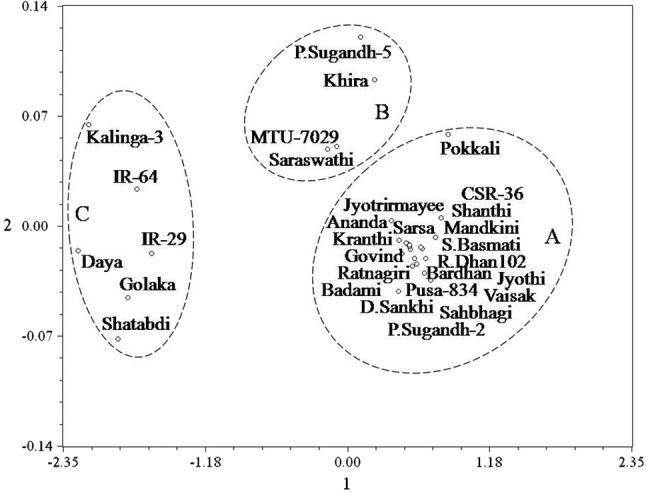
Principal component analysis based two dimensional spatial distributions of 30 rice varieties along orthogonal coordinate axes
The inhibitory influence of salt stress on seed germination and seedling growth has also been reported by earlier researchers (Bhumbla and Singh 1965; Kumari et al. 2016b, 2018b). A concentration dependent decrease in seed germination under sodium chloride stress, as recorded in the present investigation, corroborated the earlier report (Ali et al. 1996) in which differential salinity tolerance among cultivars deduced on the basis of germination frequency was considered significant because decline in germination also leads to significant reduction in seedling length, early seedling vigour, speed of germination and dry matter production per plant (Reddy et al. 1994). The higher concentration of salt is known to reduce the water potential, hindering water absorption by germinating seeds and thereby reducing germination and seedling growth (Agnihotri et al. 2006; Jamil et al. 2006; Abbas et al. 2013; Hariadi et al. 2015).
Genotyping of rice varieties
Genotypic characterization of rice varieties on the basis of evaluation of molecular profiles generated by 24 SSR primers based amplified products clearly indicated that altogether 205 allelic variants including 114 shared and 91 unique alleles were detected with an average of 8.54 alleles per primer due to length variation of simple sequence repeats present in the entries. Polymorphism amongst entries was recognised in the form of presence or absence of bands, in addition to number and position of bands (Fig. 2). Ample allelic diversity was observed with the number of alleles per primer ranging from 3 (RM 10745) to 19 (RM 220 and RM10825). The number of shared alleles per primer ranged from three in the cases of RM 5, RM 292, RM 302, RM 10694, RM 10745, RM 10772 and RM 10864 to eleven in the case of RM 220. Similarly, the number of unique alleles per primer ranged from zero in the case of RM 1287, RM 10745 and RM 10764 to eleven in the case of RM 10825 (Table 2). Precise analysis of the amplification pattern further revealed that the marker revealing greater number of allelic variants per locus, in general, recorded more number of unique alleles in accordance with the earlier reports (Bajracharya et al. 2006; Brondani et al. 2006; Joshi and Behera 2006; Lapitan et al. 2007; Ebana et al. 2008; Herrera et al. 2008; Borba et al. 2009; Pervaiz et al. 2010; Rabbani et al. 2010; Singh et al. 2011; Kumari et al. 2016a; Kumar et al. 2018). Abundance of unique alleles indicated that the experimental materials subjected to molecular profiling represent a rich source of genetic diversity for their purposeful and effective utilization in rice breeding program with the basic objective to bring genetic improvement in respect of salt tolerance. Occurrence of null allele was also noticed in one of the varieties subjected to molecular characterization that resulted in the failure of locus specific generation of amplified product. The null allele exhibiting variety differed with the repeat locus associated with the primers RM 5, RM 14, RM 220, RM 10665 and RM 10694. Absence of amplified product due to failure of amplification can be attributed to the failure of primer annealing due to variation in primer binding site specific unique flanking sequences of the concerned microsatellite. Using different panels of primer pairs and different genotypes of rice, similar results have been reported earlier (Ganie et al. 2016; Priyadarshini et al. 2018).
Fig. 2.

Amplification pattern of targeted genomic regions in 18 varieties of rice
Table 2.
Analysis of 24 SSR primer pairs used for the amplification of genomic template extracted from 18 rice varieties
| Primer | Repeat motif | Physical position (Mb) | Amplicon size range (bp) | Amplicon size difference (bp) | No. of alleles | No. of unique alleles | No. of shared alleles | PP | PIC |
|---|---|---|---|---|---|---|---|---|---|
| RM 5 | (GA)14 | 23.9 | 127–142 | 015 | 6 | 3 | 3 | 50.00 | 0.703 |
| RM 14 | (GA)18 | 41.3 | 165–193 | 028 | 6 | 1 | 5 | 16.66 | 0.753 |
| RM 24 | (GA)29 | 18.9 | 146–214 | 068 | 9 | 3 | 6 | 33.33 | 0.864 |
| RM 113 | (CA)8 | 18.8 | 147–187 | 040 | 5 | 1 | 4 | 25.00 | 0.771 |
| RM 140 | (CT)12 | 12.3 | 260–304 | 044 | 8 | 3 | 5 | 37.50 | 0.814 |
| RM 220 | (CT)17 | 4.4 | 111–300 | 189 | 19 | 8 | 11 | 66.66 | 0.564 |
| RM 292 | (GT)10-6-(TGA)2 TGT(TGA)4 | 9.5 | 147–162 | 015 | 4 | 1 | 3 | 33.33 | 0.623 |
| RM 302 | (AT)13 | 32.9 | 131–233 | 102 | 9 | 6 | 3 | 66.66 | 0.814 |
| RM 490 | (CT)13 | 51.0* | 091–100 | 009 | 6 | 1 | 5 | 16.16 | 0.790 |
| RM 493 | (CTT)9 | 12.3 | 197–270 | 073 | 8 | 2 | 6 | 25.00 | 0.750 |
| RM 562 | (AAG)13 | 14.6 | 200–266 | 066 | 6 | 2 | 4 | 33.33 | 0.564 |
| RM 1287 | (AG)17 | 10.8 | 153–200 | 047 | 5 | 0 | 5 | 00.00 | 0.771 |
| RM 3412 | (CT)17 | 11.6 | 200–276 | 076 | 7 | 2 | 5 | 28.00 | 0.793 |
| RM 7025 | (AAAT)6 | 25.8 | 127–187 | 060 | 9 | 3 | 6 | 33.33 | 0.870 |
| RM 8094 | (AT)31 | 11.2 | 143–300 | 157 | 13 | 9 | 4 | 60.00 | 0.870 |
| RM 10665 | (ATAC)6 | 10.5 | 380–493 | 113 | 13 | 9 | 4 | 69.00 | 0.901 |
| RM 10694 | (AC)18 | 10.9 | 196–240 | 018 | 9 | 6 | 3 | 66.33 | 0.830 |
| RM 10745 | (TATG)9 | 11.7 | 183–200 | 017 | 3 | 0 | 3 | 0.00 | 0.648 |
| RM10748 | (AG)14 | 11.8 | 088–134 | 046 | 12 | 7 | 5 | 58.33 | 0.901 |
| RM 10764 | (AT)28 | 12.1 | 154–179 | 025 | 4 | 0 | 4 | 00.00 | 0.740 |
| RM 10772 | (CTT)16 | 12.2 | 362–490 | 128 | 6 | 3 | 3 | 50.00 | 0.635 |
| RM 10825 | (AAG)10 | 14.0 | 110–520 | 410 | 19 | 11 | 8 | 42.00 | 0.783 |
| RM 10864 | (GT)27 | 14.2 | 212–376 | 164 | 10 | 7 | 3 | 70.00 | 0.704 |
| RM 11008 | (TTC)12 | 17.9 | 250–283 | 033 | 9 | 3 | 6 | 33.33 | 0.870 |
PP Polymorphism percent; PIC polymorphism information content
*Indicates marker position in cM
Differential ability to discover polymorphism and to determine variability among the entries was exhibited by the primer pairs and the higher polymorphism percent of a primer indicated greater percentage of unique alleles generated by that primer. The polymorphism percent expressed in the form of percentage of unique allele was recorded to be the maximum (70.00%) in the case of RM 10864 and the minimum (00.00%) in the case of RM 1287, RM 10745 and RM 10764 with an average value of 38.08%. Revealing allelic diversity and frequency among the entries, PIC value of the primer pairs varied from 0.564 (RM 220 and RM 562) to 0.901 (RM 10665 and RM 10748) with an average of 0.763 across the primers. Since the PIC value provides a simple measure of marker specific allelic diversity and frequency amongst the entries under evaluation, relatively higher numerical value indicated comparatively greater probability of allelic variants detection among the varieties evaluated. Utilizing different set of primer pairs and different genotypes of rice, similar results and inferences have been reported earlier (Giarrocco et al. 2005; Brondani et al. 2006; Joshi and Behera 2006; Islam et al. 2008; Bhowmik et al. 2009; Pervaiz et al. 2009; Dhar et al. 2012; Davla et al. 2013; Islam et al. 2012, 2015).
The average value of both PIC (0.763) and PP (38.08) confirms that the primers utilized for molecular characterization of rice varieties were, in general, polymorphic and informative. Considering the number of alleles generated by primer pairs employed in conjunction with the level of polymorphism detected, the primers RM 302, RM 8094, RM 10665, RM 10694, RM 10748 and RM 10825 appeared to be highly polymorphic and comparatively more informative for the purpose of molecular characterization of rice varieties. Considerably greater number of allelic variants were generated by these six SSR primers due to variation in the length of microsatellite repeats based amplified products as a consequence of amplification of the repeats flanked by them (Ganie et al. 2016; Rashid et al. 2018). Since the total repeat count of the di-nucleotide microsatellite loci was not seemed to be associated with the number of alleles detected per locus, a direct relationship was not established between the repeat number involved in the microsatellite locus and the number of identified alleles. This inference is based on the observation that more allelic variants were recorded even with relatively lower repeat count of microsatellite loci having di-nucleotide repeat motifs. Therefore, the experimental results, in general, failed to reflect that larger the repeat number involved in the microsatellite locus, the larger was the number of identified alleles.
Simple sequence repeat loci with di-nucleotide and tri-nucleotide repeat motifs, in general, detected greater number of alleles than the repeat loci with tetra-nucleotide and complex repeat motifs. Therefore, the results provided the evidence to strengthen the view point that the primers targeting di-nucleotide repeat sequence motifs are found to be more polymorphic than those amplifying tri-nucleotide, tetra-nucleotide and complex repeat motifs (Lapitan et al. 2007; Pervaiz et al. 2009; Kumar et al. 2018). While establishing the relation between di-nucleotide repeat motifs having a particular type of nucleotide composition and the number of alleles generated by primer pairs (Table 3), it was observed that the simple sequence repeat loci with CT, GT, AC, AT and AG di-nucleotide repeat motifs detected greater number of alleles. Contrarily, the loci with GA and CA di-nucleotide motifs of simple sequence repeats detected relatively lesser number of alleles. This is not in conformity with the earlier report in which perfect di-nucleotide repeat unit GA has been documented to exhibit high level of allelic variation among the rice genotypes (Sajib et al. 2012; Kumar et al. 2018). The discrepancy may be attributed to a different set of experimental materials and different primer pairs used in the present study.
Table 3.
Allelic diversity of 15 SSR primers with di-nucleotide repeat motifs utilized for amplification of targeted genomic regions in 18 rice varieties
| Di-nucleotide repeat motifs of primer | No. of primers | No. of alleles | No. of alleles per primers |
|---|---|---|---|
| GA | 3 | 21 | 07.00 |
| CT | 4 | 40 | 10.00 |
| AC | 1 | 09 | 09.00 |
| AT | 3 | 26 | 08.66 |
| AG | 2 | 17 | 08.50 |
| CA | 1 | 05 | 05.00 |
| GT | 1 | 10 | 10.00 |
Evolutionary process of plant genomes has extensively involved gradual reduction and augmentation in the percentage of microsatellites, which consist of C/G and A/T, respectively. Consequently, the percentage of A/T is higher than C/G in monocots and dicots with lesser A/T percentage in the former than the latter (Qin et al. 2015). Frequency of A/T di-nucleotide repeat motifs in rice is greater than that in maize. During the course of evolution, the percentage of di-nucleotide AT/TA repeat motif increased along with the increase of repeat number opposite to CG/GC repeat motif. This trend is more apparent in dicots than monocots (Qin et al. 2015). In monocots, AG/CT/GA/TC repeat motifs are dominant showing an increasing trend along with the increase of repeat number. Contrarily, the percentage of these repeat motifs shows a declining trend along with the increase of repeat number in most of the dicots. Microsatellites having tri-nucleotide repeat motifs exhibit diversification in terms of the combination of three nucleotides along with the increase of repeat number. The tri-nucleotide repeat motifs having a combination of two or three A/T exhibit an increasing trend along with the genome evolution from monocots to dicots. Majority of the primers employed to target the tri-nucleotide and tetra-nucleotide repeats in the present study had a dominant combination of two to three A/T in their repeat motifs in agreement with the evolutionary changes of simple sequence repeats in plants.
Amongst pair-wise combinations of entries, the magnitude of similarity coefficient between Daya and Golaka (0.750) was found to be the maximum. This was followed by remarkably higher magnitude of similarity coefficient between Sahbhagi and Rajendra Dhan-102 (0.727). It was interesting to observe that the magnitude of similarity coefficient among 23 pair-wise combinations of 18 entries was equal to zero. Therefore, the microsatellite markers based molecular profiles did not exhibit any genetic similarity with respect to the nucleotide sequence composition at primer binding sites and the molecular size of the genomic regions spanned by the primer pairs in these 23 pair-wise varietal combinations. Ample genetic diversity at the molecular level was, therefore, revealed by the range of similarity coefficients (0.0–0.7) obtained for pair-wise combinations of the entries, providing greater confidence for the classification of entries and assessment of genetic relationships. Similar inference has been derived in the studies conducted on the molecular markers including SSR marker based divergence analysis in rice by earlier researchers (Aliyu et al. 2011; Kanawapee et al. 2011; Dhar et al. 2012; Sudharani et al. 2013; Shakil et al. 2013; Kumar et al. 2018; Priyadarshini et al. 2018).
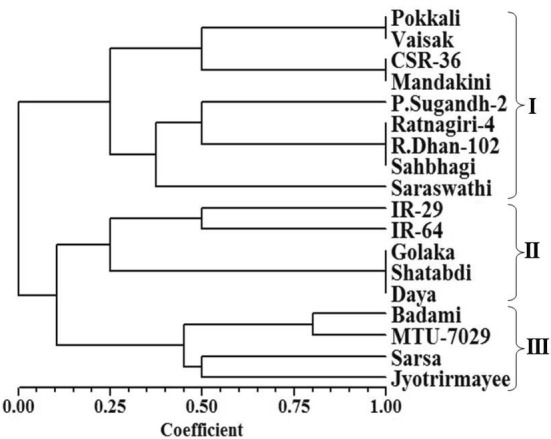
Numerical taxonomic approach based classification of entries using sequential agglomerative hierarchical nested method for tree building and arithmetic mean dependent un-weighted pair-group method for dendrogram construction basically discriminated the entries into three broad groups (Fig. 3), which were further divided into clusters, sub-clusters and sub–sub clusters. The first multi-genotypic group consisted of eight entries, namely, Pokkali, CSR-36, Mandakini, Pusa Sugandh-2, Ratnagiri-4, Rajendra Dhan-102, Sahbhagi and Vaisak, whereas the second multi-genotypic group consisted of five entries namely, Saraswathi, Badami, Sarsa, Jyotrirmayee, and MTU-7029. The third multi-genotypic group consisted of five susceptible entries namely, IR-29, IR-64, Shatabdi, Daya and Golaka. Therefore, salt susceptible entries were unambiguously differentiated from tolerant and moderately tolerant entries. The results revealing remarkable potential of microsatellite markers characterized by their polymorphic nature and allelic diversity, as noticed in the present study and also reported earlier by several research workers (Ganie et al. 2014; Ganie et al. 2016), indicated their usefulness in discrimination of salt stress tolerant rice varieties from susceptible rice varieties.
Fig. 3.
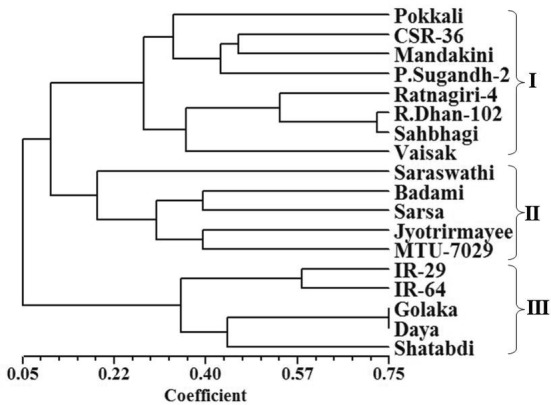
Hierarchical classification of 18 rice varieties using 24 SSR primers based similarity indices
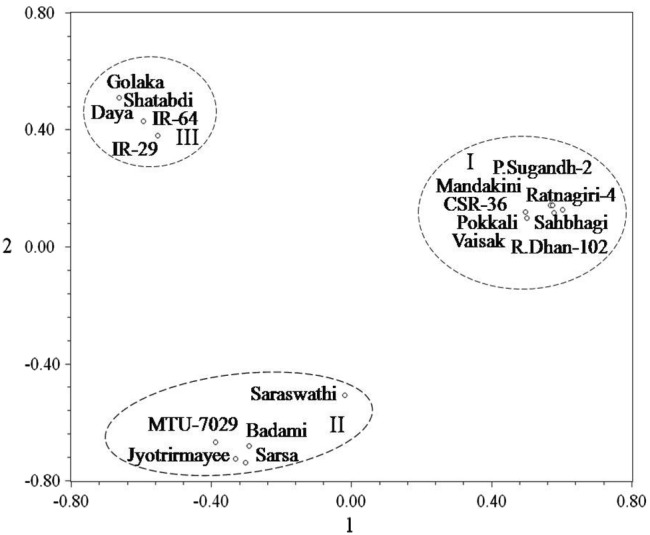
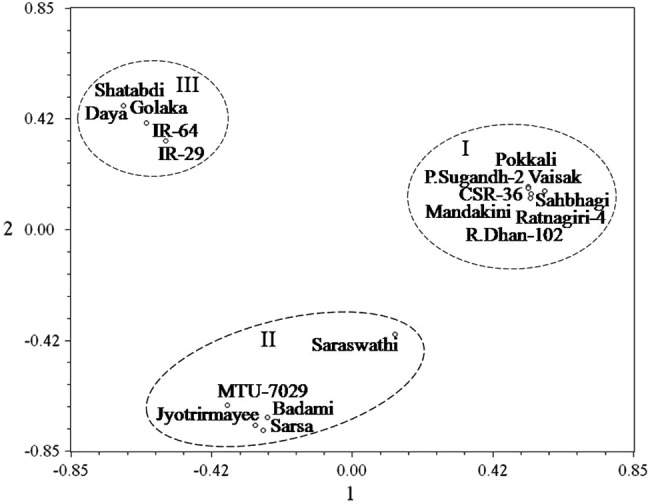
Principal coordinate analysis (Fig. 4) based two dimensional ordinations of 24 SSR primers dependent genetic profiles from 18 rice varieties revealed their spatial distribution pattern along the two principal axes. While most of the entries were placed far away from the centroid of the clusters and only few entries were placed more or less around the centroid, it is evident that entries were distinctly divided into three multi-genotypic groups and susceptible varieties were unambiguously discriminated from moderately and highly tolerant varieties. Therefore, the inferences derived from the similarity coefficients based hierarchical classification were completely supported by the principal coordinate analysis (Islam et al. 2015; Kumar et al. 2018; Priyadarshini et al. 2018). Using both the approaches, susceptible rice varieties were discriminated from tolerant rice varieties without intermixing of varieties.
Fig. 4.
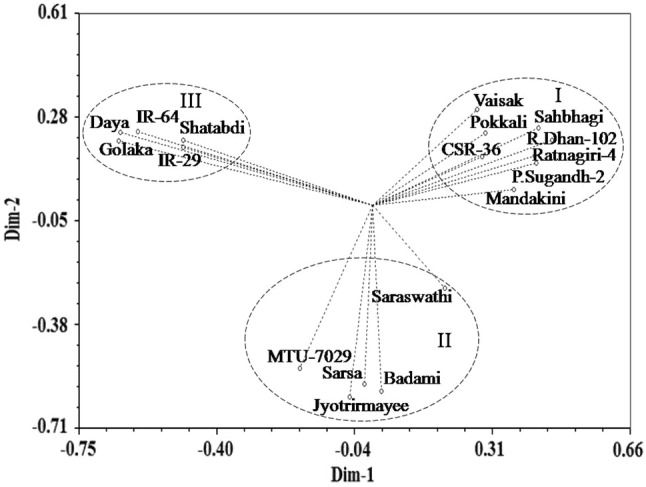
Spatial two-dimensional distribution of 24 SSR primers based genetic profiles of 18 rice varieties
Validation of microsatellite markers for salinity tolerance
A gradual exclusion of primer pairs in the analysis of differentiation and divergence among the entries finally led to the identification and validation of six SSR primer pairs, namely, RM 140, RM 1287, RM 3412, RM 10745, RM 10764 and RM 10772, on the basis of their efficiency to distinguish salt tolerant varieties from susceptible varieties. Hierarchical cluster analysis performed by using the similarity matrix based on allelic diversity data of these six SSR primer pairs yielded considerably similar classification pattern, clearly discriminating the susceptible varieties from tolerant varieties (Fig. 5). These six primers appeared to be efficient and sufficient for the purpose of genetic differentiation and discrimination in relation to salt stress responsiveness of the rice genotypes. Principal coordinate analysis (Fig. 6) based two dimensional projections of these six SSR primers dependent genetic profiles of the entries was more or less in complete agreement with the hierarchical classification pattern of the entries, validating the usefulness of these six SSR primers in discrimination of salt susceptible and tolerant rice varieties. According to the information available in the genomic database of rice, the physical position of the six validated SSR markers (Fig. 7a, b) varies from 10.0 Mb (RM 1287) to 12.3 Mb (RM 140) in Saltol QTL region on chromosome 1 (Islam et al. 2012; Aliyu et al. 2013; Chattopadhyay et al. 2014; Ganie et al. 2016; Meghana et al. 2015; Vasuki and Geetha 2016; Ganie et al. 2016; Kumari et al. 2016a; De Leon et al. 2017).
Fig. 5.
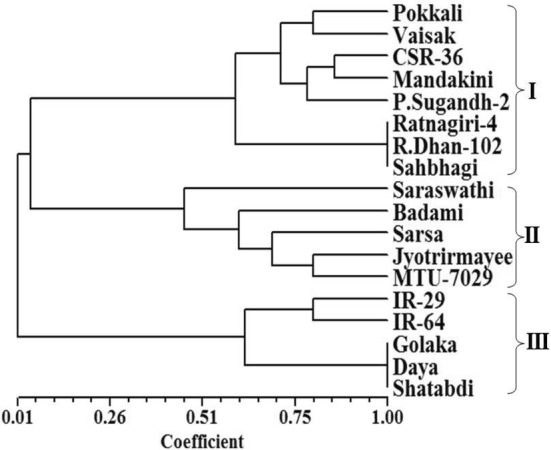
Hierarchical classification of 18 rice varieties using six SSR primers (RM 140, RM 1287, RM 3412, RM 10745, RM 10764 and RM 10772) based similarity indices
Fig. 6.
Spatial two-dimensional distribution of six SSR primers (RM 140, RM 1287, RM 3412, RM 10745, RM 10764 and RM 10772) based genetic profiles of 18 rice varieties
Fig. 7.
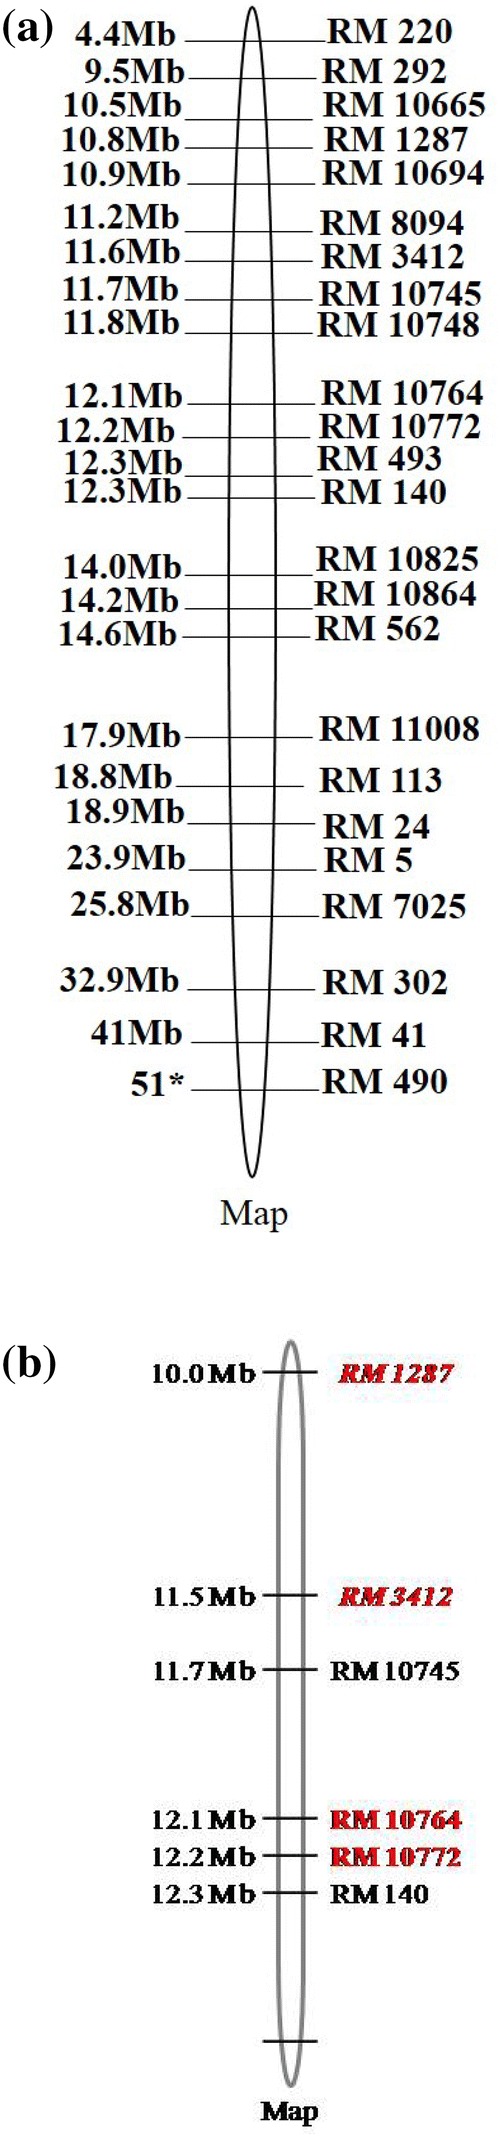
a Position and arrangement of utilized SSR markers (*Marker position expressed in cM). b Position and arrangement of validated SSR markers
Interestingly enough, further exclusion of primer pairs in the analysis of differentiation and divergence yielded almost similar results (Fig. 8) and well supported by the principal coordinate analysis (Fig. 9) based two dimensional ordinations of the four SSR primers, namely, RM 1287, RM 3412, RM 10764 and RM 10772, dependent genetic profiles of the entries, differentiating salt stress susceptible rice varieties from rest of the entries that included moderately and highly tolerant varieties. Hierarchical cluster analysis further conducted by utilizing the allelic diversity data of only two among these four SSR primer pairs also yielded considerably similar classification pattern, unambiguously discriminating the susceptible varieties from tolerant varieties (Fig. 10). Spatial distribution pattern of the entries as exhibited by the principal coordinate analysis based on allelic diversity data of these two SSR primers, namely, RM 1287 and RM 3412, also discriminated the susceptible varieties from tolerant varieties (Fig. 11). Apparently therefore, a specific combination of either four (RM 1287, RM 3412, RM 10764 and RM 10772) or even two (RM 1287 and RM 3412) markers from the panel of six validated SSR markers was also found to be equally effective in discrimination of entries according to their salt stress responsiveness. Thus, molecular profiling with such markers can be effectively utilized as efficient tools for genotyping the entries with reasonable accuracy and for discrimination and unambiguous identification of salt susceptible and tolerant rice varieties. Allelic variation identified in the microsatellites within salt stress responsive candidate genes has been considered as important role player in differential regulation of genes and behavioral reaction of rice genotypes (Molla et al. 2015). The genomic resources enriched and highlighted in the form of salt stress response related microsatellite specific variation in the present study, therefore, can be effectively utilized for developing and enhancing salt stress tolerance in rice.
Fig. 8.

Hierarchical classification of 18 rice varieties using four SSR (RM 1287, RM 3412, RM 10764 and RM 10772) primers based similarity indices
Fig. 9.
Spatial two-dimensional distribution of four SSR primers (RM 1287, RM 3412, RM 10764 and RM 10772) based genetic profiles of 18 rice varieties
Fig. 10.
Hierarchical classification of 18 rice varieties using two SSR primers (RM 1287 and RM 3412) based similarity indices
Fig. 11.
Spatial distribution of two SSR primers (RM 1287 and RM 3412) based genetic profiles of 18 rice varieties
Acknowledgements
Authors gratefully acknowledge the support of the Department of Plant Breeding and Genetics, Dr. Rajendra Prasad Central Agricultural University, Pusa (Samastipur), India for providing rice varieties utilized in the experiment and the Department of Agricultural Biotechnology and Molecular Biology, Dr. Rajendra Prasad Central Agricultural University, Pusa (Samastipur), India, for providing University Fellowship to the first author during the present investigation.
Abbreviations
- CTAB
Cetyl trimethyl ammonium bromide
- CRD
Completely randomized design
- PIC
Polymorphism information content
- PP
Polymorphism percent
- QTL
Quantitative trait locus
- SSR
Simple sequence repeat
- PCR
Polymerase chain reaction
References
- Abbas MK, Ali AS, Hasan HH, Ghal RH. Salt tolerance study of six cultivars of rice (Oryza sativa L.) during germination and early seedling growth. J Agric Sci. 2013;5:250–259. [Google Scholar]
- Agnihotri RK, Palni LMS, Pandey DK. Screening of landraces of rice under cultivation in kumaun himalaya for salinity stress during germination and early seedling growth. Indian J Plant Physiol. 2006;11:266–272. [Google Scholar]
- Ali MS, Karim MA, Hamid A (1996) Effect of sodium chloride on seed germination, growth and photosynthesis of rice. In: Abstracts: 2nd international crop science congress., p 55. New Delhi
- Ali MN, Yeasmin L, Gantait S, Goswami R, Chakraborty S. Screening of rice landraces for salinity tolerance at seedling stage through morphological and molecular markers. Physiol Mol Biol Pla. 2014;20:411–423. doi: 10.1007/s12298-014-0250-6. [DOI] [PMC free article] [PubMed] [Google Scholar]
- Aliyu R, Adamu AK, Muazu S, Alonge SO, Gregorio GB. Tagging and validation of SSR markers to salinity tolerance QTLs in rice. Int Proc Chem Biol Environ Eng. 2011;1:328–332. [Google Scholar]
- Aliyu RE, Adamu AK, Muazu S, Alonge S, Gregorio GB. Validation of rice markers tagged to salinity stress. Afr J Biotechnol. 2013;12:3239–3243. [Google Scholar]
- Anderson JA, Chhurchill GA, Autrique JE, Tanksley SD, Sorrells ME. Optimizing parental selection for genetic linkage maps. Genome. 1993;36:181. doi: 10.1139/g93-024. [DOI] [PubMed] [Google Scholar]
- Bajracharya J, Steele KA, Jarvis DI, Sthapit BR, Witcombe JR. Rice landraces diversity in Nepal: variability of agro- morphological traits and SSR markers in landraces from a high-altitude site. Field Crops Res. 2006;95:327–335. doi: 10.1016/j.fcr.2005.04.014. [DOI] [Google Scholar]
- Bhowmik SK, Titov S, Islam MM, Siddika A, Sultana S, Haque MDS. Phenotypic and genotypic screening of rice genotype at seedling stage for salt tolerance. Afr J Biotechnol. 2009;8:6490–6494. [Google Scholar]
- Bhumbla DR, Singh NT. Effect of salt on seed germination. Curr Sci. 1965;31:96–97. [Google Scholar]
- Borba TCO, Mendes CA, Guimaraes EP, Brunes TO, Fonseca JR, Brondani RV, Brondani C. Genetic variability of Brazilian rice landraces determined by SSR markers. Pesqui Agropecu Bras. 2009;44:706–712. doi: 10.1590/S0100-204X2009000700009. [DOI] [Google Scholar]
- Brondani C, Rangel PHN, Borba TCO, Brondani RPV. Transferability of microsatellite and sequence tagged site markers in Oryza species. Hereditas. 2003;138:187–192. doi: 10.1034/j.1601-5223.2003.01656.x. [DOI] [PubMed] [Google Scholar]
- Brondani C, Caldeira KS, Borba TCO, Rangel PN, Morais OP, Castro EM, Rangel PHN, Mendonca JA, Brondani RV. Genetic variability analysis of elite upland rice genotypes with SSR markers. Crop Breed Appl Biotechnol. 2006;6:9–17. doi: 10.12702/1984-7033.v06n01a02. [DOI] [Google Scholar]
- Chattopadhyay K, Nath D, Mohanta RL, Bhattacharyya S, Marndi BC, Nayak AK, Singh DP, Sarkar RK, Singh ON. Diversity and validation of microsatellite markers in Saltol QTL region in contrasting rice genotypes for salt tolerance at the early vegetative stage. Aust J Crop Sci. 2014;8:356–362. [Google Scholar]
- Davla D, Sasidharan N, Macwana S, Chakraborty S, Trivedi R, Ravikiran R, Shsh G. Molecular characterization of rice (Oryza sativa L) genotypes for salt tolerance using microsatellite markers. Bioscan. 2013;8:499–502. [Google Scholar]
- De Leon TB, Linscombe S, Subudhi PK. Identification and validation of QTLs for seedling salinity tolerance in introgression lines of a salt tolerant rice landrace `Pokkali. PLoS ONE. 2017;12:e0175361. doi: 10.1371/journal.pone.0175361. [DOI] [PMC free article] [PubMed] [Google Scholar]
- Dhar P, Ashrafuzzaman M, Begum SN, Islam MM, Chowdhury MMH. Identification of salt tolerant rice genotypes and their genetic diversity analysis using SSR markers. Int J Biosci. 2012;2:40–50. [Google Scholar]
- Dice LR. Measures of the amount of ecologic association between species. Ecology. 1945;26:297–302. doi: 10.2307/1932409. [DOI] [Google Scholar]
- Doyle JJ, Doyle JN. Isolation of plant DNA from fresh tissue. Focus. 1990;12:13–15. [Google Scholar]
- Ebana K, Kojima Y, Fukuoka S, Nagamine T, Kawase M. Development of mini core collection of Japanese rice landrace. Breed Sci. 2008;58:281–291. doi: 10.1270/jsbbs.58.281. [DOI] [Google Scholar]
- Ganie SA, Borgohain MJ, Kritika K, Talukdar A, Pani DR, Mondal TK. Assessment of genetic diversity of Saltol QTL among the rice (Oryza sativa L.) genotypes. Physiol Mol Biol Plants. 2016;22:107–114. doi: 10.1007/s12298-016-0342-6. [DOI] [PMC free article] [PubMed] [Google Scholar]
- Ganie SA, Karmakar J, Roychowdhury R, Mondal TK, Dey N. Assessment of genetic diversity in salt-tolerant rice and its wild relatives for ten SSR loci and one allele mining primer of salT gene located on 1st chromosome. Plant Syst Evol. 2014;300:1741–1747. doi: 10.1007/s00606-014-0999-7. [DOI] [Google Scholar]
- Garris AJ, Tai TH, Coburn SK, McCouch S. Genetic structure and diversity in Oryza sativa L. Genetics. 2005;169:1631–1638. doi: 10.1534/genetics.104.035642. [DOI] [PMC free article] [PubMed] [Google Scholar]
- Giarrocco LE, Marassi MA, Salerno GL. Assessment of the genetic diversity in Argentine rice cultivars with SSR markers. Crop Sci. 2005;4:853–858. [Google Scholar]
- Gomez KA, Gomez AA. Statistical procedure for agricultural research. 2. New York: Wiley; 1984. [Google Scholar]
- Gopalan C, Rama Sastri BV, Balasubramanian S. Nutritive value of Indian foods. Hyderabad: National Institute of Nutrition (NIN), Indian Council of Medical Research; 2007. [Google Scholar]
- Gregorio GB, Senadhira D, Mendoza RD. Screening rice for salinity tolerance. IRRI discussion paper series no. 22. Manila: International Rice Research Institute; 1997. pp. 1–30. [Google Scholar]
- Hariadi YC, Nurhayati AY, Soeparjono S, Arif I. Screening six varieties of rice (Oryza sativa) for salinity tolerance. Procedia Environ Sci. 2015;28:78–87. doi: 10.1016/j.proenv.2015.07.012. [DOI] [Google Scholar]
- Herrera TH, Duque DP, Almeida IP, Nunez GT, Pieters AJ, Martinez CP, Tohme JM (2008) Assessment of genetic diversity in Venezuelan rice cultivars using simple sequence repeats markers. Electron J Biotechnol 11. 10.2225/vol11-issue5-fulltext-6
- Islam MR, Singh RK, Salam MA, Hassan L, Gregorio GB. Molecular diversity of stress tolerant rice genotypes using SSR markers. Sabrao J Breed Genet. 2008;40:127–139. [Google Scholar]
- Islam ASMF, Ali MR, Gregorio GB, Islam MR. Genetic diversity analysis of stress tolerant rice (Oryza sativa L.) Afr J Biotechnol. 2012;11:15123–15129. [Google Scholar]
- Islam SN, Islam MM, Ullah MA, Alam MS. Molecular characterization of selected landraces of rice for salt tolerance using SSR markers. Int J Inno Sci Res. 2015;17:206–218. [Google Scholar]
- Jamil M, Lee D, Jung KY, Ashraf M, Lee SC, Rha ES. Effect of salt stress on germination and early seedling growth of four vegetables species. J Cent Eur Agric. 2006;7:273–282. [Google Scholar]
- Joshi RK, Behera L. Identification and differentiation of indogenous non-basmati aromatic rice genotypes of India using microsatellite markers. Afric J Biotechnol. 2006;6:48–354. [Google Scholar]
- Kanawapee N, Sanitchon J, Srihaban P, Theerakulpisut P. Genetic diversity analysis of rice cultivars differing in salinity tolerance based on RAPD and SSR markers. Electron J Biotechnol. 2011;14:1–15. [Google Scholar]
- Kranto S, Chankaew S, Monkham T, Theerakulpisut P, Sanitchon J. Evaluation for salt tolerance in rice using multiple screening methods. J Agric Sci Technol. 2016;18:1921–1931. [Google Scholar]
- Kumar P, Kumari R, Sharma VK. Choice of microsatellite markers for isolation of fertility restorers of wild abortive (WA) type cytoplasmic male sterility in rice. Indian J Genet Plant Breed. 2018;78:202–210. doi: 10.5958/0975-6906.2018.00026.3. [DOI] [Google Scholar]
- Kumari R, Sharma VK, Kumar H. Seed culture of rice cultivars under salt stress. Int J Pure Appl Biosci. 2015;3:191–202. [Google Scholar]
- Kumari R, Kumar P, Sharma VK, Kumar H. Molecular characterization for salinity tolerance in rice using microsatellite markers. Int J Agric Environ Biotechnol. 2016;9:163–174. doi: 10.5958/2230-732X.2016.00023.1. [DOI] [Google Scholar]
- Kumari R, Kumar P, Sharma VK, Kumar H. In vitro seed germination and seedling growth for salt tolerance in rice cultivars. J Cell Tissue Res. 2016;16:5901–5910. [Google Scholar]
- Kumari S, Kumar P, Sharma VK. Identification of microsatellite markers for genetic differentiation and authentication of promising aerobic rice genotypes. J Pharmacogn Phytochem. 2018;7:2772–2776. [Google Scholar]
- Kumari R, Kumar P, Sharma VK, Kumar H. Evaluation of salinity tolerance of rice varieties through in vitro seed germination and seedling growth. Int J Curr Microbiol Appl Sci. 2018;7(special:issue):2648–2659. [Google Scholar]
- Lang NT, Li ZK, Bui CB. Microsatellite markers linked to salt tolerance in rice. Omonrice. 2001;9:9–21. [Google Scholar]
- Lapitan VC, Brar DS, Abe T, Redona ED. Assessment of genetic diversity of Philippine rice cultivars carrying good quality traits using SSR markers. Breed Sci. 2007;57:263–270. doi: 10.1270/jsbbs.57.263. [DOI] [Google Scholar]
- Mass EV, Hoffman GJ. Crop salt tolerance current assessment. J Irrig Drain Div ASCE. 1977;103:115–134. [Google Scholar]
- Meghana HS, Hittalmani S, Gandhi RV, Meera N. Phenotypic screening for salt tolerance at germination and seedling stage and SSR marker validation in rice (Oryza sativa L.) Mysore J Agric Sci. 2015;49:686–692. [Google Scholar]
- Mohammadi-Nejad G, Arzani A, Rezai AM, Singh RK, Gregorio GB. Assessment of rice genotypes for salt tolerance using microsatellite markers associated with the Saltol QTL. Afr J Biotechnol. 2008;7:730–736. [Google Scholar]
- Molla KA, Debnath AB, Ganie SA, Mondal TK. Identification and analysis of novel salt responsive candidate gene based SSRs (cgSSRs) from rice (Oryza sativa L.) BMC Plant Biol. 2015;15:122. doi: 10.1186/s12870-015-0498-1. [DOI] [PMC free article] [PubMed] [Google Scholar]
- Pervaiz ZH, Rabbani MA, Pearce SR, Malik SA. Determination of genetic variability of Asian rice (Oryza sativa L.) varieties using microsatellite markers. Afr J Biotechnol. 2009;8:5641–5651. doi: 10.5897/AJB09.827. [DOI] [Google Scholar]
- Pervaiz ZH, Rabbani MA, Khaliq I, Pearce SR, Malik SA (2010) Genetic diversity associated with agronomic traits using microsatellite markers in Pakistani rice landraces. Electron J Biotechnol 13. 10.2225/vol13-issue3-fulltext-5
- Priyadarshini M, Kumar P, Sharma VK. Molecular differentiation and classification in relation to fragrance of landraces and improved varieties of aromatic rice using microsatellite markers. Int J Chem Stud. 2018;6:3014–3021. [Google Scholar]
- Qin Z, Wang Y, Wang Q, Li A, Hou F, Zhang L. Evolution analysis of simple sequence repeats in plant genome. PLoS ONE. 2015;10(12):e0144108. doi: 10.1371/journal.pone.0144108. [DOI] [PMC free article] [PubMed] [Google Scholar]
- Rabbani MA, Masood MS, Shinwari ZK, Shinozaki KY. Genetic analysis of basmati and non-basmati Pakistani rice (Oryza sativa L.) cultivars using microsatellite markers. Pak J Bot. 2010;42:2551–2564. [Google Scholar]
- Rashid MM, Imran S, Islam MA, Hassan L. Genetic diversity analysis of rice landraces (Oryza sativa L.) for salt tolerance using SSR markers in Bangladesh. Fundam Appl Agric. 2018;3:460–466. doi: 10.5455/faa.298103. [DOI] [Google Scholar]
- Reddy PJ, Vaidyanath K. Note on the salt tolerance of some rice varieties of Andra Pradesh during germination and early seedling growth. Indian J Agric Sci. 1982;52:72–474. [Google Scholar]
- Reddy SKN, Reddy BM, Ankaiah R. Effect of initial germination levels on vigour, growth and yield in rice. Seed Res. 1994;22:22–25. [Google Scholar]
- Rohlf FJ. NTSYS-pc numerical taxonomy and multivariate analysis system, version 2.00. New York: Exeter Software; 1997. [Google Scholar]
- Sajib AM, Hossain MM, Mosnaz ATMZ, Hossain H, Islam MM, Ali MS, et al. SSR-marker based molecular characterization and genetic diversity analysis of aromatic landraces of rice (Oryza sativa L.) J Biosci Biotechnol. 2012;2:107–116. [Google Scholar]
- Senadhira D (1987) Salinity as a concept to increasing rice production in Asia. In: Proeedings of. Regional Workshop in Maintenance of Life Support Species in Asia Pacific Region. NBPGR, New Delhi, India
- Shakil SK, Sultana S, Hasan MM, Hossain MM, Ali MS, Prodhan SH. SSR marker based genetic diversity analysis of modern rice varieties and coastal landraces in Bangladesh. Indian J Biotechnol. 2013;14:33–41. [Google Scholar]
- Shannon MC, Rhoades JD, Draper JH, Scardaci SC, Spyres MD. Assessment of salt tolerance in rice cultivars in response to salinity problems in California. Crop Sci. 1998;38:394–398. doi: 10.2135/cropsci1998.0011183X003800020021x. [DOI] [Google Scholar]
- Singh RK, Gregorio GB, Jain RK. QTL mapping for salinity tolerance in rice. Physiol Mol Biol Plants. 2007;13:87–99. [Google Scholar]
- Singh AK, Kumar R, Singh A, Bansal S, Singh D, Tomar A. Studies on genetic variability in rice using molecular markers. Vegetos. 2011;24:123–131. [Google Scholar]
- Sudharani M, Reddy PR, Reddy GH. Identification of genetic diversity in rice (Oryza sativa L.) genotypes using microsatellite markers for salinity tolerance. Int J Sci Innov Discov. 2013;3:22–30. [Google Scholar]
- Thomson MJ, De Ocampo M, Egdane J, Rahman MA, Sajise AG, Adorada DL, Tumimbang-Raiz E, Blumwald E, Seraj ZI, Singh RK, Gregorio GB, Ismail AM. Characterizing the Saltol quantitative trait locus for salinity tolerance in rice. Rice. 2010;3:148–160. doi: 10.1007/s12284-010-9053-8. [DOI] [Google Scholar]
- Vasuki A, Geetha S. Validation of ‘Saltol’ QTL under sodicity. Electron J Plant Breed. 2016;7:838–841. doi: 10.5958/0975-928X.2016.00113.7. [DOI] [Google Scholar]
- Wong SC, Yiu PH, Bong STW, Lee HH, Neoh PNP, Rajan A. Analysis of Sarawak Bario rice diversity using microsatellite markers. Am J Agric Biol Sci. 2009;4:298–304. doi: 10.3844/ajabssp.2009.298.304. [DOI] [Google Scholar]
- Yeo AR, Flowers TJ. The physiology of salinity tolerance in rice (Oryza sativa) and a pyramiding approach to breeding varieties for saline soils. Aust J Plant Physiol. 1986;13:75–91. [Google Scholar]