

Abstract
Drought is one of major constraints that limits agricultural productivity. Some factors, including climate changes and acreage expansion, indicates towards the need for developing drought tolerant genotypes. In addition to its protective role against endoplasmic reticulum (ER) stress, we have previously shown that the molecular chaperone binding protein (BiP) is involved in the response to osmotic stress and promotes drought tolerance. Here, we analyzed the proteomic and metabolic profiles of BiP-overexpressing transgenic soybean plants and the corresponding untransformed line under drought conditions by 2DE-MS and GC/MS. The transgenic plant showed lower levels of the abscisic acid and jasmonic acid as compared to untransformed plants both in irrigated and non-irrigated conditions. In contrast, the level of salicylic acid was higher in transgenic lines than in untransformed line, which was consistent with the antagonistic responses mediated by these phytohormones. The transgenic plants displayed a higher abundance of photosynthesis-related proteins, which gave credence to the hypothesis that these transgenic plants could survive under drought conditions due to their genetic modification and altered physiology. The proteins involved in pathways related to respiration, glycolysis and oxidative stress were not signifcantly changed in transgenic plants as compared to untransformed genotype, which indicate a lower metabolic perturbation under drought of the engineered genotype. The transgenic plants may have adopted a mechanism of drought tolerance by accumulating osmotically active solutes in the cell. As evidenced by the metabolic profiles, the accumulation of nine primary amino acids by protein degradation maintained the cellular turgor in the transgenic genotype under drought conditions. Thus, this mechanism of protection may cause the physiological activities including photosynthesis to be active under drought conditions.
Electronic supplementary material
The online version of this article (10.1007/s12298-019-00643-x) contains supplementary material, which is available to authorized users.
Keywords: Stress abiotic, Amino acid metabolism, Proteomic, Metabolomic
Introduction
Soybean production is among the economic activities that has grown more significantly in the last decades because of its applications in food industry and biodiesel production. Accordingly, soybean grains represent the fourth most consumed and produced grain worldwide (Hirakuri and Lazzarotto 2014). In the global context, Brazil has matched the United States to share global leadership in soybean exports, supplying 40% of the international market (CONAB 2014; Oliveira 2016). However, the prevalance of drought in several parts of the world threatens the sustainability of soybean production (Dai 2013; Foyer et al. 2016). Thus, it is necessary to obtain drought-tolerant cultivars that can overcome threat imposed on food security (Ku et al. 2013).
On the molecular level, the induction of pathways related to stress are mediated by several gene families. These include genes involved in osmoprotection, free radical scavengers, in addition to late embryogenesis abundant (LEA) proteins, heat shock proteins and chaperones, membrane transporters and ion channels, transcription factors such as MYB/MYC, bZIP, NAC, CBF/DREB and ABF/ABAE (Gupta et al. 1993; Wehmeyer and Vierling 2000; Zhu et al. 2001; Shinozaki et al. 2003; Rodrigues et al. 2006; Ashraf and Foolad 2007; Khan et al. 2015). Stress-responsive genes have been used as target for engineering drought tolerance in several different plant species (Djilianov et al. 2005; Khan et al. 2015). Among them, BiP-overexpressing soybean, tobacco and Arabidopsis plants have been shown to display tolerance to drought (Alvim et al. 2001; Valente et al. 2009; Reis et al. 2016).
BiP is the most abundant chaperone in the endoplasmic reticulum (ER) and belongs to the family of 70 kDa heat shock protein (HSP70). In addition to its molecular chaperone activity, BiP attenuates ER stress and osmotic stress-induced cell death and promotes plant innate immunity, exhibiting protective functions against abiotic and biotic stress conditions (Hamman et al. 1998; Alvim et al. 2001; Haigh and Johnson 2002; Wang et al. 2005; Pincus et al. 2010; Hong et al. 2008; Costa et al. 2008; Valente et al. 2009; Reis et al. 2011; Carvalho et al. 2014). Thus, under moderate stress conditions, the unfolded protein response (UPR) mediates induction of ER-resident chaperones and ER-associated protein degradation (ERAD) genes to promote the ER quality control processes, thereby re-establishing ER homeostasis (Leborgne-Castel et al. 1999; Ruberti et al. 2015; Bao and Howell 2017). Furthermore, BiP overexpression enhances drought tolerance in transgenic soybean (Glycine max), tobacco (Nicotiana tabacum) and Arabidopsis (Arabidopsis thaliana) plants (Alvim et al. 2001; Valente et al. 2009; Reis et al. 2016). BiP overexpression modulate the expression and activity of the components of the N-rich protein (NRP)-mediated cell death response, including GmNRP-A, GmNRP-B, GmNAC81 and vacuolar processing enzyme (VPE), thus attenuating the stress-induced cell death signal (Alvim et al. 2001; Valente et al. 2009, Reis et al. 2011; Reis and Fontes 2012; Carvalho et al. 2014). The BiP protective property against drought has been linked to its capacity to modulate the stress-induced NRP-mediated cell death response (Reis et al. 2011; Carvalho et al. 2014: Reis et al. 2016).
In spite of extensive studies about the BiP protective properties against stresses in plants, the effect of BiP overexpression on environmental stimuli-induced metabolic and protein profile changes has not been examined. The analysis of the proteome and metabolome provides information about mechanisms underlying plant acclimation, essential for understanding the physiological and biochemical responses. Here, we evaluated the proteomic and metabolomic profiles of the BiP-overexpressing transgenic soybean line and the corresponding untransformed genotype exposed to drought by 2DE-MS, LC/MS and GC/MS. An integrative overview showed that the tolerant plants maintain cell homeostasis and the photosynthetic metabolism unaltered under moderate stress condition, which supports the hypothesis that these transgenic plants could survive under drought conditions due to their genetic modification and altered physiology. These findings suggest that the mechanism underlying BiP tolerance to drought involves a regulatory adjustment of the leaf metabolism to promote an efficient water use.
Materials and methods
Plant growth and genotypes
Independently transformed soybean lines (35S:BiP-1, 35S:BiP-2, 35S:BiP-3, 35S:BiP-4), previously obtained by transforming soybean plants (Glycine max cv. Conquista) with a soyBiPD gene under the control of a cauliflower mosaic virus 35S promoter (Cascardo et al. 2001; Valente et al. 2009) have been extensively evaluated. The physiological and genetic behavior of these lines related to drought and irrigated conditions has been highly similar (Valente et al. 2009, Reis et al. 2011; Reis and Fontes 2012; Carvalho et al. 2014; Reis et al. 2016). Thus, the line 35S::BiP-4, designated as C9, was used to contrasting the proteomic and metabolomic profiles against the wild-type Conquista genotype (WT genotype).
Soybean seeds, untransformed, wild-type (WT) and transgenic (C9) genotypes were germinated in organic substrate, and three seedlings were transferred to 3L pots containing a mixture of soil, sand and dung (3:1:1) and grown in a greenhouse under ambient light, relative humidity (65–85%) and temperature (15–35 °C) conditions. Each pot was weighed and received an equal amount of soil mixture. After germination, the presence of the transgene was confirmed by polymerase chain reaction (PCR) analysis, using genomic DNA from leaf as template.
Water stress induction
The plants were grown under normal water conditions until reaching the development stage V3 (fully expanded third trifoliate). The control plants were watered daily with approximately 180 mL water per plant. The transgenic C9 and WT plants were exposed to a slow drying soil treatment, which consisted of a reduction in irrigation to 40% of the daily normal (Valente et al. 2009). The hydric regimes were assigned as irrigated (IR) and non-irrigated (NI), respectively.
The leaf water potential (ψw) was measured in the third emerging trifoliate at dawn by using a Scholander pump (Scholander et al. 1965) during the stress period. The stress severity was also determined by measuring leaves relative water content (RWC) (Silva et al. 2007). Samples were collected in liquid nitrogen when the transgenic plants had a water potential − 1 MPa and then stored at − 80 °C until use.
Metabolite extraction and chemical derivatization for GC/MS analysis
The leaf samples were ground in liquid nitrogen and subsequently 50 mg of powder was used. Then, 1.5 mL of cold extraction solution (1:2.5:1 water, methanol, chloroform) containing 60 µL of ribitol (0.2 mg/mL stock in water) were added as an internal quantitative standard. The samples were shaken in Thermomix for 30 min at 4° C, centrifuged at 14,000×g for 5 min and the supernatant was collected. Then, 750 µL of water were added and the samples were vortexed, followed by centrifugation at 14,000×g for 5 min. An aliquot of 50 µL of the supernatant was transferred to a new tube and dried by vacuum centrifugation. The dried samples were dissolved in methoxyamine pyridine (40 µL of a 20 mg/mL solution) and vortexed for 30 s, and then incubated for 2 h at 37 °C stirring. Lastly, 70 µL of N-methyl-N-(trimethylsilyl) trifluoroacetamide (MSTFA) reagent (20 µL/mL of retention time standard) were added and the mixture was incubated for 30 min at 37 °C (Lisec et al. 2006).
Metabolite analysis by GC/MS
Metabolites extracted were analyzed using an Agilent 7890A GC System coupled to Mass Spectrometric TruTOF® HT TOFMS, Leco, equipped with a capillary column of 30 mm (MDN-35) operating according to Lisec et al. (2009). Samples were injected in splitless mode at 230 °C using a gas flow (continuous flow of helium) of 2 mL/min. The oven temperature was initially maintained constant at 80 °C and then increased to 15 °C/min to reach 330 °C, which was maintained for 5 min. Mass spectrum was obtained by the full-scan method ranging from 33 to 600 m/z. A series of n-alkanes was used along with samples to calculate retention indexes.
Data processing and metabolite identification
Raw GC/MS data were processed and converted for the CDF format (NetCDF) using the ChromaTof package and automatically analyzed by TargetSearch algorithms. We used a script for identification and quantification of metabolites, designed to run on R (Cuadros-Inostroza et al. 2009) and the processing parameters and the used alignment were optimized for our GC/TOF platform. The parameters used were: massRange of 85–500 Da, IntThreshold 50, TopMasses 10, r thresh of 0.05. The identification of the compounds was determined by database searches based on the combination of the fragment mass spectrum and chromatographic retention index by the mass spectral tags (MSTs)-based method (Cuadros-Inostroza et al. 2009). The GMD Mass Spectrum Reference Library (GMDB_FAMELib_TS_20110228_IS.txt) downloaded from http://gmd.mpimp-golm.mpg.de/download/), containing the retention indexes (RI) and mass spectra from 938 compounds, was used for metabolite identification. The GC/MS platform used in work was the same applied for generation of the libraries. A filtered identification table, for a quality factor index over 600, containing the identified compounds and their intensities, was used as input data for processing and statistical analysis by MetaboAnalyst platform (http://www.metaboanalyst.ca/).
Metabolite data analysis
The identification and intensity table was used as input data for identification of differential metabolites, generating a display of the significantly disturbed metabolites using MetaboAnalyst 3.0 package. Quality filters based on the standard deviation methods were used to automatically remove low quality data and, then, the intensity values were normalized by the median. The data were analyzed using the Partial Least Squares Discriminant Analysis (PLS-DA). Discriminating metabolites were identified using a statistically significant threshold of variable influence on projection values (VIP > 1.0) obtained from the PLS-DA model and were further validated by ANOVA analysis with p value less than 0.05.
Phytohormone analysis
The hormones were extracted from soybean leaves according to the methodology described by Müller and Munné-Bosch (2011) with modifications. Ten mg of powdered fresh tissue were weighed and 400 μL of extraction solvents were added (methanol: isopropyl alcohol: acetic acid 20: 79: 1). The samples were mixed in vortex 4 times for 20 s (on ice), sonicated for 5 min, placed on ice for 30 min and then centrifuged at 13,000×g for 10 min at 4 °C. After centrifugation, 350 μL of supernatant were removed and transferred to a new tube. The process was repeated with the resulting pellet and then the supernatants were pooled.
Approximately 300 μL of the extracts were placed in vials and 5.0 µL were injected into the LC/MS system from NuBioMol (Center for Biomolecules Analysis-UFV, Brazil). We used a chromatography column (Agilent Eclipse Plus, RRHD, 1.8 μm, 2.1 × 50 mm) with a flow of 0.3 mL/min, coupled online to a mass spectrometer QQQ triple quadrupole (Agilent). The mass spectrometer was operated at negative/positive alternating mode according to the retention time for each hormone standard and the sample scanned by Multiple Reaction Monitoring (MRM) using the following mass transitions: JA 209 > 59; SA 137 > 93; ABA 263 > 153; ACC 106 > 56. The tests were carried out for four replicates for each biological treatment.
The generated mass spectra were processed using the MassHunter software to obtain the extracted ion chromatograms (XIC) of each transition and the area values, as indicative of the abundance of each hormone. A standard curve of each hormones, in a concentration range of 0.1 to 300 ng/mL, was used to convert the area values from XIC in ng/g of plant tissue.
Proteolytic activity assay
Protein activity was determined using 2% (w/v) azocasein as substrate in 0.1 M Tris–HCl buffer, pH 8.0; 37 °C. The reaction mixture consisted of 50 μL of substrate plus 60 μL of enzyme extract, incubated for 30 min at 37 °C. The reaction was stopped by the addition of 240 μl of 10% (w/v) trichloroacetic acid (TCA). The samples were homogenized in vortex and kept on ice for 15 min and were centrifuged at 8000×g for 5 min at 25° C for removal of the precipitated protein. Aliquots of 240 μl from the supernatant were transferred to tubes containing 280 μl of 1 M NaOH. The absorbance were determined at 440 nm and the protease activity was expressed as M s−1 using the extinction molar coefficient and the formula V = A440 (ε l t)−1.
RNA extraction, cDNA synthesis and Real time RT-PCR (qRT-PCR)
Total RNA was extracted from leaves using TRIzol (Life Tecnologies Inc.) and treated with RNase-free DNase (Life Tecnologies Inc.). Then, the RNA was quantified by spectrophotometry (Evolution 60 Thermo Scientific) and examined in a 1.3% (p/v) denaturing agarose gel that was stained with 0.1 μg/mL ethidium bromide (EtBr). Total RNA was used for RT-PCR. Reverse transcription (RT)-PCR assays were performed with 3 μg of total RNA, 5 µM of oligo-dT, 0.5 mM of dNTPs and 1U of M-MLV reverse transcriptase (Life Tecnologies Inc.). All the procedures for real-time PCR, including tests, validations and experiments were conducted according to the recommendations of Applied Biosystems. Real-time RTPCR reactions were performed on an ABI7500 instrument (Applied Biosystems), using cDNAs from the treatments, gene-specific primers and SYBRH Green PCR Master Mix (Applied Biosystems). The amplification reactions were performed as follows: 10 min at 95 °C and 40 cycles of 94 °C for 15 s and 60 °C for 1 min. Soybean RNA helicase and tobacco RNA actin were used as endogenous control to normalize all values in the real-time RT-PCR assays. Gene expression was quantified using the 2−ΔCT.
Extraction of total protein
The samples were prepared by pooling leaves of three plants. Approximately 4 g of leaf was powdered in liquid nitrogen and suspended in 10 mL of ice-cold buffer (2% v/v β-mercaptoethanol, 1 mM phenylmethylsulfonylfluoride and 1% w/v polyvinylpolypyrrolidonein in acetone 100%). The solutions were vortexed for 30 s and maintained on ice for 10 min. Then, the solutions were submitted to three cycles of sonication, applying an amplitude of 30% of the maximum power supplied by the instrument corresponding to 20 watts and pulser cycles of 30 s ON and 30 s OFF. After sonication, 10 mL of 20% (v/v) trichloroacetic acid (TCA) were added and incubated on ice for 20 min. The extracts were centrifuged at 6000×g for 15 min at 4 °C and the precipitate was washed five times with ice cold acetone, four times with 10%. (v/v) TCA on ice cold acetone, twice with 10% (v/v) TCA in water, twice in 80% (v/v) acetone, once in 70% (v/v) ethanol and dried at room temperature.
The precipitate was then resuspended in 10 mL of extraction buffer [30% (w/v) sucrose, 2% (w/v) SDS, 0.1 M Tris–HCl pH 8.0, 1 mM PMSF, 2% (v/v) β-mercaptoethanol] and allowed to stand for 15 min. at room temperature. Subsequently, 5 mL of phenol pH 8.0 were added to each tube and kept on ice for 10 min, followed by vortex vigorously for 30 s, then put them on ice every 2 min. After the centrifugation at 6000×g for 15 min at 4 °C, the phenolic fraction was collected and transferred to a new falcon tube. The proteins were precipitated by adding five volumes of cold 0.1 M ammonium acetate in methanol at − 20 °C overnight. After centrifugation at 6000×g for 15 min at 4 °C, pellets were washed twice in 0.1 M ammonium acetate in methanol, twice in 80% (v/v) acetone and once more in 70% (v/v) ethanol. Pellets were finally resuspended in 7 M urea, 2 M thiourea and 4% (w/v) CHAPS. Protein quantification was performed by the Bradford method with a bovine serum albumin standard to ensure a protein concentration between 1 and 15 mg/mL (Bradford 1976).
Separation of proteins by two-dimensional gel electrophoresis
The isoelectric focusing (IEF) was performed in 13 cm IPG strip pH 3–10 (GE Healthcare). Initially, the strips were rehydrated for 20 h in 250 μL of rehydration buffer [7 M urea, 2 M thiourea, 2% (w/v) CHAPS, 0.002% (w/v) bromophenol blue, 2% IPG-buffer, 0.2% (w/v) DTT] containing 1.0 mg protein for each sample. The protein extracts were separated in the first dimension at 20 °C using an IPGphor3 isoelectric focusing system (GE Healthcare). The voltage settings for IEF was 200 V for 1 h, 500 V for 2 h, 1000 V for 4 h, 8000 V for 4 h, and 8000 V to a total 46.86 kVh. Following electrophoresis, the protein in the strips was reduced with equilibration buffer [50 mM Tris–HCl pH 8.8, 6 M urea, 30% (v/v) glycerol, 4% (w/v) SDS, 0.002% (w/v) bromophenol blue, 1% (w/v) DTT] and then alkylated by incubation with the same buffer containing 2.5% (w/v) iodoacetamide instead of DTT for 30 min at room temperature. The second-dimension electrophoresis was performed on a 12% gel using a Hoefer SE 600 Ruby electrophoresis unit (GE Healthcare). Gels were stained with Coomassie Blue G-250 solution [8% (w/v) ammonium sulfate, 0.8% (v/v) phosphoric acid, 0.08% (w/v) Coomassie Blue G-250 and 20% (v/v) methanol. The 2DE gels were scanned using ImageScanner III scanner and LabScan 6.0 software (GE Healthcare).
The protein profiles of the irrigated and non-irrigated treatments for both genotypes were compared using ImageMaster2D Platinum 7 software (GE Healthcare) for the detection of differentially abundant protein spots. As threshold, the proteins were considered as differentially expressed, if they fitted the criteria: (i) a measured overlay variation above 1.0 (ratio normalization), (ii) ANOVA with p value less than 0.05 and (iii) presence in the three gels (biological replicates).
In-gel digestion and mass spectrometry for the protein identification
Protein spots were manually excised from the gel and subjected to in-gel trypsin digestion according to Shevchenko et al. (2007). Selected gel plugs were washed extensively with 50 mM ammonium bicarbonate/50% methanol (v/v), followed by acetonitrile for dehydration. The proteins were then reduced using 200 mM DTT in 100 mM ammonium bicarbonate for 30 min at 56 °C followed by alkylation with 200 mM iodoacetamide in 100 mM ammonium bicarbonate for 30 min at room temperature. The spots were washed with 100 mM ammonium bicarbonate solution, dehydrated with acetonitrile and dried by vacuum centrifugation. Spots were then rehydrated with trypsin digestion solution overnight (20 h) at 37 °C. Digested peptides were extracted using extraction buffer [50% (v/v) acetonitrile, 5% (v/v) formic acid] and dried by vacuum centrifugation. Peptides were dissolved in 0.1% (v/v) formic acid and analyzed by LC–MS using a nanoUPLC (nanoACQUITY-Waters) system containing a capillary column C18 BEH130 1.7 μM − 100 nm × 100 mm, operating at a flow rate of 0.5 µL/min. The eluted peptides were automatically injected into a mass spectrometer ION TRAP (Amazon-Bruker), online using a nanoESI ionization needle. The scanning of the ions from the mass spectrometer was performed at between 300 and 1500 m/z in positive mode and data were acquired for 70 min in each LC–MS/MS analysis. The mass spectrometer was operated in the auto-MSn mode. Data acquisition of the LC–MS instrument was managed by Hystar software (Bruker) and the spectra were processed with the Data Analysis software (Bruker) using the default settings for proteomics.
The spectra were analyzed by PEAKS 7.0 program with a local Client license, connected to a remote server to identify proteins. The parameters used in the program were: a protein list obtained from Phytozome, containing all the proteins described for soybean as database, methionine oxidation as a variable modification of cysteine carbamidomethylation as a fixed modification, one missed cleavage, charge states of 2 + , 3 + , 4 + , trypsin-like cleavage enzyme and mass error of 0.15 Da. For protein identification, we considered a false discovery rate (FDR) less than 1.0% along with at least three unique peptides.
Results
Drought stress assays
The water deficit regime resulted in a progressive decline in the leaf water potential (ψw), leading to changes in the leaf turgor and the relative water content (RWC) from both WT and C9 plants; as for the irrigated plants, the water potential was higher than − 0.2 MPa throughout the experiment (Fig. 1 and Supplemental Fig. S1). After 32 days, a sharp decline in the water potential curve was observed in the leaves of plants exposed to the drought treatment, but at 36- and 37-day, the leaf ψw was significantly different between WT and C9 genotypes. While the WT genotype reached ψw = − 1.8 MPa at 37-days, the C9 genotype displayed values close to − 1.0 MPa during the same period of water deficit (Supplementary Fig. S1A). After 36 days of reduction in the water supply, the visual differences in the leaf turgor between transformed and non-transformed plants were registered (Supplementary Fig. S1B). The leaf RWC decreased with the progression of the stress in both genotypes although to a different extent (Fig. 1). In the leaf ψw = − 1 MPa, the RWC decline in WT leaves was 56.31% while in leaves of the C9 genotype, the decline in RWC was 49.29%. These results are consistent with a better water-use efficiency in the C9 genotype, suggesting that the transgenic genotype deploys an efficient mechanism to maintain the leaf turgor under water deficit.
Fig. 1.

Relative water content RWC (%) of the soybean leaves from the WT and C9 genotypes under different water potential. Bars represent mean ± SE. Means followed by the same letter do not differ statistically by Tukey test at 5% significance. Lower case letters refer to genotypes and capital letters to treatment
Differential accumulation of phytohormones in the BiP-overexpressing plant
The absolute concentration of the phytohormones was determined by mass spectrometry coupled to liquid chromatography. The concentration of abscisic acid (ABA) and salicylic acid (SA) in the leaves of both genotypes increased in response to drought. While the drought-induced levels of ABA were higher in the sensitive genotype (Fig. 2a), the increase in SA was more pronounced in the C9 tolerant genotype (Fig. 2b). The level of jasmonic acid (JA) was reduced in response to water deficit in both genotypes, although to a different extent (Fig. 2c). Under water deprivation, the reduction of JA was more pronounced in the C9 genotype (Fig. 2c).
Fig. 2.

Quantification of phytohormones (ng/g) by UHPLC/QqQ. The data represent the mean ± SE (n = 3). Means followed by the same letter do not differ statistically by Tukey test at 5% significance. Lowercase letters refer to genotypes and capital letters to the treatment
Metabolite profiles of soybean leaves during drought
To understand the major physiological changes caused by water deficit in soybean, we also analyzed changes in metabolism by GC/MS. The metabolic profiles were compared between the contrasting genotypes to verify the fluctuation of the metabolites during drought treatments related with the tolerance mechanism. We identified 288 metabolites. Among them, the levels of amino acids and their derivatives increased strongly in the plants of the genotype C9 exposed to drought. However, in the drought-exposed WT leaves, we observed higher levels of carbohydrate and organic acids (Fig. 3a and Supplementary Table S3). To further examine the differentially accumulated metabolites that correlated with water deficit, we used a discriminating analysis by PLS-DA (Partial least squares Discriminant Analysis). The metabolite profiles showed a trend of separation between the samples analyzed, with an explanation of 91.5% of the total variance (Fig. 3b). This analysis indicated a distinct metabolic response of 30 metabolites between the genotypes during water deficit, including 6 amino acids and their derivatives, 10 carbohydrates, 6 fatty acids and lipids, 7 organic acids, as the major determinants for the variance (Fig. 3c and Supplementary Table S4). The data generated from the primary metabolism were grouped to highlight the changes between the genotypes in the imposition of water deficit (Fig. 4). The water deficit treatment affected differentially the amino acid composition from the leaves of the WT and C9 genotypes. The tolerant C9 genotype displayed an increased abundance of Proline, Isoleucine, Tryptophan, Valine, Leucine, Histidine, Asparagine and Methionine as compared to the sensitive WT genotype.
Fig. 3.

Analysis of the metabolic profiles of the C9 and WT genotypes under irrigated (IR) and non-irrigated (NI) conditions. a Heat map showing the differences in the abundance of the metabolites in response to drought in soybean leaves. b Principal component analysis (PCA) of all the metabolites identified. c Major metabolites responsible for discrimination between irrigated and non-irrigated soybean groups identified by VIP score
Fig. 4.

Pathway overview of some drought responsive metabolites from soybean genotypes under water deficit. Metabolites were identified by GC–MS and their abundances expressed in terms of normalized intensities using the MetaboAnalyst platform. The most responsive metabolites between genotypes determined by the VIP score analysis are shown. The Y-axis defines the relative abundances of specific metabolite and X-axis defines the treatment group
Protease activities
The leaves extracts were evaluated for hydrolytic activity of peptide subtracts. The proteolytic activities were not altered for the irrigated plants and for the wild-type genotypes under drought stress (Fig. 5). However, for the transgenic C9 genotype, the protease activity was increased under drought. The protein levels in the leaves were reduced only for the drought tolerant C9 genotype under water deficit and was not altered for wild-type (Fig. 5).
Fig. 5.

Protease Activity of the soybean leaves. The asterisk indicate statistical differences between WT and transgenic plants
Gene expression by RT-qPCR
The expression of some genes related with the amino acid biosynthesis and protein degradation (BCAT: Branched-chain-amino-acid aminotransferase; ALT: Alanine aminotransferase; P5CS: 1-pyrroline-5-carboxylate synthetase; ALS: Acetolactate synthase; PAE1: Ubiquitin-20S proteasome alpha subunit) were evaluated. The transcriptional levels of the NPF 4.7 gene, coding for a transporter for ABA and nitrogen compounds, was also determined (Fig. 6). The genes coding for ALT and BCAT was up-regulated only for the sensitive genotype WT (Fig. 6), while the gene coding for ALS was up-regulated in the tolerant C9 genotype. These genes, ALS and BCAT are important for biosynthesis of branched-amino acid. The gene coding for first enzyme of the proline biosynthesis P5CS was also up-regulated in the leaves of the sensitive WT genotype (Fig. 6). The expression for BCAT, ALT and P5CS was not altered in the drought tolerant genotype. Otherwise, the gene coding for the protein PAE1, that is an important component of the 20S proteasome, which degrade unneeded or damaged proteins by proteolysis, was up-regulated only in the tolerant genotype (Fig. 6). As the phytohormone profiles indicated higher levels of ABA in the leaves of the transgenic genotype C9 (Fig. 2a), the expression of the gene coding for NPF 4.7 was also evaluated that showed higher levels in the tolerant soybean and was up-regulated only in the C9 genotype (Fig. 6).
Fig. 6.

Gene expression analysis by RT-qPCR. Total RNA was isolated from WT and C9 leaves and expression of indicated genes was monitored by qRT-PCR, as follows: BCAT (Branched-chain-amino-acid aminotransferase); ALT (Alanine aminotransferase); P5CS (1-pyrroline-5-carboxylate synthetase); ALS (Acetolactate synthase); PAE1 (Ubiquitin-20S proteasome alpha subunit); NPF 4.7 (transporter for ABA and nitrogen compounds). Expression values were obtained using the method of 2−(DCt) and the endogenous control
Proteomics: identification of differentially expressed proteins by drought conditions
By analysis of the 2-DE profiles, the changes in the protein expression were investigated in response to drought, comparing the same genotypes in different treatments (IR-irrigated and NI-non-irrigated). Protein spots with lower or higher relative abundances between treatments were selected and identified. For the genotype WT, 661 well separated spots were used in the comparison between WT IR x WT NI treatments. Of those, 48 were identified as differentially expressed spots and 41 were identified by mass spectrometry (Supplementary Table S1). The 41 spots corresponded to 29 different proteins in addition to isoforms or post-translational modifications of the same protein, which were represented by more than one spot in the same gel. Among 41 spots identified, 10 spots showed a relative increase and 17 were present only in the plants under drought stress. In contrast, 3 spots were expressed only in the IR and 11 spots displayed a reduction in relative abundance when comparing IR x NI. For the tolerant genotype C9, 548 spots were used to compare the contrast IR x NI. Of these, 28 were classified as differentially expressed spots, of which 27 were identified by mass spectrometry (Supplementary Table S2). These 27 spots corresponded to 20 different proteins, with some possible isoforms or modifications. Among the 27 spots identified, 5 spots had an increase in relative abundance in NI treatment compared to the irrigated IR, 3 spots were present only in the plants under drought stress. In contrast, 6 spots were expressed only in the IR and 13 spots showed a reduction in relative abundance when comparing IR x NI. To facilitate comparison, the abundance (%Volume) of the responsive proteins to drought of each genotypes was converted to fold-change and classified as up- or down-regulated, if an increase or reduction of the protein abundance was observed in the NI treatment (Figs. 7, 8, 9).
Fig. 7.
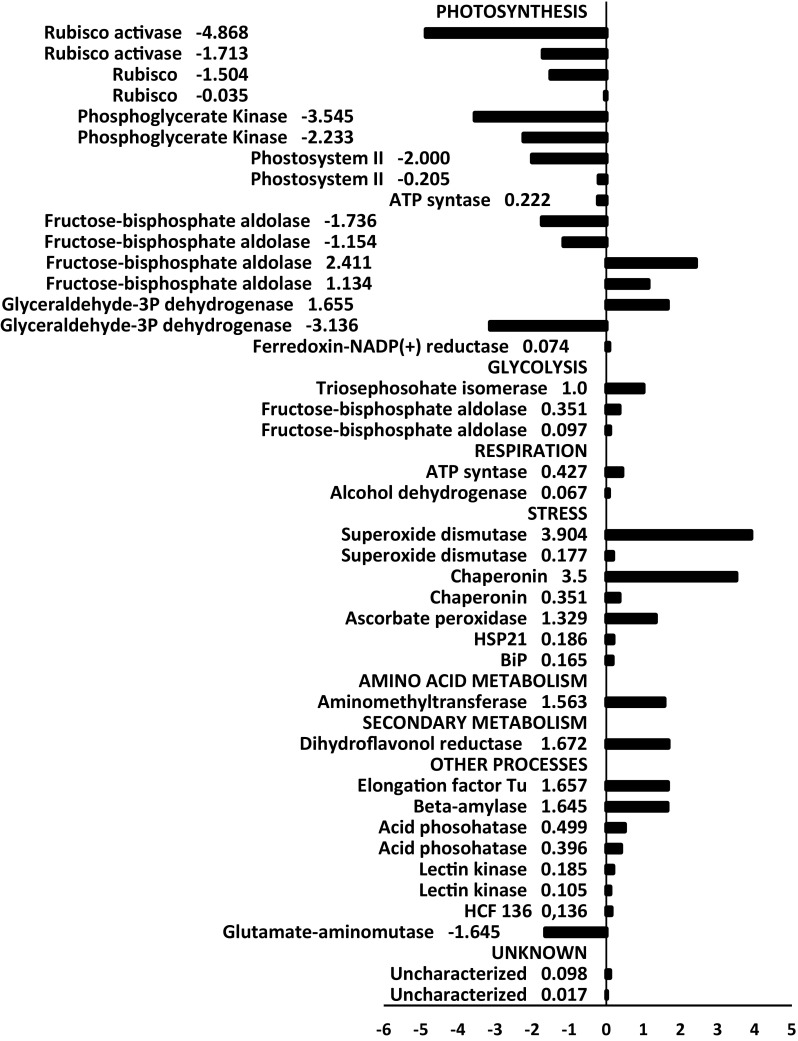
Up- and down-regulated proteins by water deficit in the soybean leaves from the drought sensitive genotype WT
Fig. 8.

Up- and down-regulated proteins by water deficit in soybean leaves form the drought tolerant genotype C9
Fig. 9.
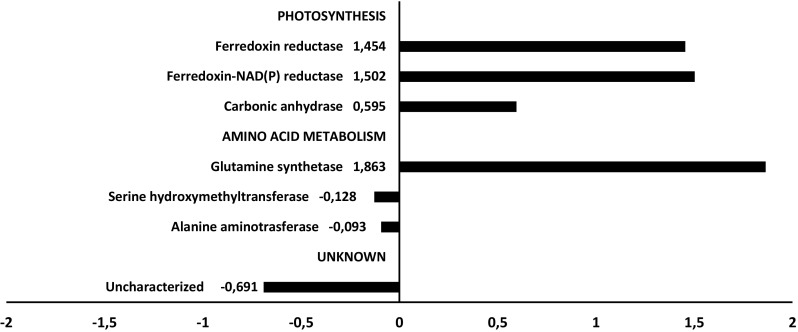
Up- and down-regulated proteins of the soybean leaves identified by the contrast C9 × WT during drought treatment
To visualize the general differences of response between genotypes, the proteins were classified by functional categories and prevalent biological process. The ontological classification of theses protein is showed in the Fig. S2, a distinct response was observed for the genotypes. The up-regulated proteins of the sensitive WT genotype shared clusters related to glycolysis, respiration and oxidative stress (Fig. S2A), whereas the tolerant C9 genotype did not display differentially expressed proteins related to these biological processes (Fig. S2B).
Discussion
The effect of BiP overexpression in plants under drought conditions has been previously evaluated at the molecular and physiological levels (Alvim et al. 2001; Hong et al. 2008; Valente et al. 2009; Reis et al. 2011; Carvalho et al. 2014; Reis et al. 2016). These studies have established that the BiP-mediated drought tolerance mechanism involves the regulation of the NRP-mediated signaling cascade to attenuate the propagation of a stress-induced cell death signal. Here, we further examined the BiP-overexpressing lines under a slow soil-drying regime and observed that an additional mechanism to maintain the leaf turgor under drought may be invoked in the transgenic lines. Consistent with previous studies (Carvalho et al. 2014), BiP overexpression delays leaf dehydration because exposing soybeans to a gradual water deprivation regime caused a slower decline of the leaf ψw in the transgenic plants than in WT (Supplementary Fig. S1). We showed here that this delay in leaf dehydration was at least partially due to the maintenance of the leaf turgor for a longer period and a better water-use efficiency in the C9 transgenic genotype because, at the same leaf ψw = − 1.0 MPa, the leaf RWC was significantly higher in the BiP-overexpressing line than in WT leaves (Fig. 1).
The drought signaling also influences the expression of several genes involved in the synthesis, distribution and signaling of hormones, underlying the importance in assessing hormonal changes, as they exhibit rapid responses to the environmental changes. A key role in the regulation of the response to drought is played by the hormone abscisic acid (ABA). As expected, the absolute concentration of ABA showed great variations in response to drought treatment, although the ABA increase was significantly higher in drought-stressed WT leaves than in drought-stressed C9 leaves (Fig. 2a). Similarly, the levels of salicylic acid enhanced during the water deficit regime in both genotypes (Fig. 2b). Studies have demonstrated considerable importance for the ability of SA to induce protective effects in plants under stress by increasing or regulating the activity of the detoxification enzyme (Azooz and Youssef 2010). The BiP-mediated amplification of the hypersensitive programmed cell death response may be connected to SA signaling activation as the BiP line in contrast to wild type exhibited enhanced SA accumulation and enhanced expression of SA-responsive genes even under normal conditions, thus, indicating that it may serve as a priming state for SA signaling induction under stress conditions (Carvalho et al. 2014). In contrast, the jasmonic acid levels decreased by exposition to stress in both genotypes, which could be an indirect effect of the antagonism between JA and SA (Fig. 2c). Thus, salicylic acid appears to have considerable importance in inducing protective effects in drought-stressed plants and may be related to antioxidative metabolisms and attenuation of cellular senescence. However, the exact mechanism of salicylic acid action under drought is not yet well understood.
In general, plant cells perceive stress through receptors on the plasma membrane, the signal is then transduced and as a result secondary messengers, such as hormones, are generated. There is activation of a signaling cascade, mediated by protein kinases, which promotes the regulation of gene expression by different transcription regulators, and the induction of several defense pathways, such as antioxidant metabolism and osmosprotection, in order to confer tolerance to environmental stresses, connecting upstream sensing mechanisms and to downstream changes in gene expression, metabolism, physiology, growth, and development. (You and Chan 2015; Zhu 2016).
Abiotic stresses result in disruption of metabolic homeostasis, resulting in reduction in plant growth and development (Shulaev et al. 2008), including carbohydrate, amino acid, and peptide metabolism (Huang and Gao 2000; Aayudh et al. 2017). The metabolic profiles of leaves showed a trend of sample separation from irrigated and non-irrigated genotypes. The metabolites from the irrigated genotypes were grouped together, indicating a great similarity of the metabolite profiles between the contrasting genotypes. In contrast, the samples from drought-stressed WT and C9 displayed a divergent spatial distribution, which revealed that the genotypes responded differently to water deficit (Fig. 3b). Thus, the metabolites with higher discriminatory values between treatments for both genotypes were selected to identify the metabolic pathways significantly disturbed by the imposition of water deficit (Fig. 3c). Drought treatment induced a higher content of amino acids and their derivatives in the C9 leaves, whereas the WT genotype presented higher levels of carbohydrates under the same conditions (Figs. 3a, 4).
Metabolic profile data showed a reduction in glucose, sucrose, fructose and maltose content in the C9 genotype as compared to WT genotype exposed to drought. It is known that increasing the glucose content in the cell generates a signal mediated by hexokinase, which promotes respiration and repression of transcription of photosynthetic genes (Reddya et al. 2004; Fernie et al. 2004). These data corroborate with our proteomic analysis, in which the WT genotype under stress showed a higher abundance of respiration- and glycolysis-related proteins and lower abundance of photosynthetic proteins. In soybean, in addition to glucose, the major solutes accumulated under water deficit are fructose and sucrose (Meyer and Boyer 1981). The metabolomic findings of the current study illustrate how drought may affect carbohydrate metabolism; the respiratory pathways, such as glycolysis and the tricarboxylic acid (TCA) cycle, that may help in maintainance of physiological functions in the WT genotype. Silvente et al. (2012) showed that under drought conditions, sugar levels varied significantly in soybean genotypes as well as among the types of tissues, the effect being more evident in the leaves than in nodules.
Although the sugars decrease in the genotype C9 under stress, there was a significant increase in the abundance of amino acids. The higher levels of amino acids in the C9 genotype supports the hypothesis that they may be major contributors for the cell turgor maintenance, stomatal conductance, CO2 assimilation rate, growth of tissues and cell integrity (De Ronde et al. 2000; Alia and Matysik 2001; Bartels and Sunkar 2005; Carvalho et al. 2014). The relative increase of isoleucine and leucine (Fig. 4a) in drought-stressed soybean leaves was similar to that observed in Arabidopsis (Nambara et al. 1998). Similar results, specifically for amino acid metabolism, were also described by Tripathi et al. (2016), in which changes in metaboloism were studied in hydroponically grown soybean plants under drought stress. The increase in the free amino acid level could be due to elevated synthesis of amino acids observed in plants under water deficit to adjust metabolism, being used for the synthesis of specific enzymes or proteins involved in tolerance or osmoprotectors against dehydration (Stewart and Larher 1980; Nambara et al. 1998). Aayudh et al. (2017) demonstrated that significance of maintainance of sugar and nitrogen metabolism, along with phytochemical metabolism in soybeans under drought and heat stress conditions. However, for soybean (Less and Galili 2008) and Arabidopsis (Huang and Jander 2017), the accumulation of amino acids is primarily the result of the abscisic acid-regulated protein degradation. We also observed that the protease activity was higher under drought conditions only for transgenic plant expressing BiP (Fig. 5), however it did not correlate with lower levels of ABA in the C9 genotype, both in the plants irrigated and in drought conditions (Fig. 2). The higher levels of amino acid observed for transgenic soybean leaves was also not related with the expression of the genes for biosynthesis because the transcription of the genes coding for P5CS, ALT and BCAT were not altered during drought stress in the tolerant genotype C9 (Fig. 6). These results suggest that proteolytic pathways can be responsible for higher levels of the amino acids in transgenic plants expressing BiP, under water deficit. Otherwise, the gene coding for Ubiquitina-20S proteasome alpha subunit was up-regulated in this genotype. Thus, BiP overexpression culminated in an increase of the amino acid levels by induction of the proteolysis in the soybean leaves. ER stress and osmotic stress, together in combination cause induction of the TF GmERD15 expression to activate membrane-associated protein DCD/NRP-B expression. Induction of DCD/NRP-B activates a signaling cascade of vacuolar processing enzyme (VPE) promoter, which in turn activate plant caspase-like proteases (Silva et al. 2015). Thus, proteasome activity could also be under control by PIB.
Despite lower levels of ABA in the transgenic plants, the expression of an ABA transporter (NPF 4.7) was up-regulated in this genotype. Thus, the increase of the amino acids was not dependent on ABA levels as observed in Arabidopsis leaves (Huang and Jander 2017). Some proteins related to amino acids metabolism were observed differentially expressed under drought conditions (Figs. 7, 8, 9), such as an ubiquitin 20S proteasome alpha subunit that was up-regulated in the C9 transgenic genotype. In plant cells, there is a mixture of 26S and 20S proteasomes that mediate ubiquitin-dependent and ubiquitin-independent proteolysis, respectively. Increased biogenesis of 20S proteasome biogenesis has been related to increase oxidative stress tolerance as it enhances the degaradation of oxidized proteins (Kurepa et al. 2009).
The importance of amino acid catabolism has been highlighted by studies that have analysed plant metabolism aspects showing their involvement not only during plant senescence but also in tolerance against stress in land plants. Certain amino acids such as serine, proline, and leucine act as signaling molecules while others are involved in phytohormones or other secondary metabolites biosynthesis, with signaling function (Häusler et al. 2014; Hildebrandt et al. 2015).
Protein expression analysis by two-dimensional electrophoresis revealed differential expression patterns induced by drought, which were distinct between contrasting genotypes related to the drought tolerance. A global analysis of the protein abundancy for both genotypes indicated that some molecular and physiological processes including glycolysis, respiration and oxidative stress were more affected by reducing the water supply in the genotype WT (Fig. 7). Most of the proteins related to photosynthesis were downregulated during stress conditions in both the soybean genotypes. However, the reduction in the abundance was more pronounced for some proteins, such as for the rubisco activase and phosphoglycerate kinase in the genotype WT than C9 under stress conditions (Figs. 7, 8). Drought stress reduces the carboxylation process because the limitation of the Rubisco activase prevents the reactivation of Rubisco molecules (Reddy et al. 2004; Parry et al. 2002). Many studies report that drought stress affects significantly the activities of the Calvin cycle enzymes (Dias and Brüggemann 2010; Das et al. 2016). Some key enzymes of Calvin cycle involved in the carboxylation had a distinct pattern of expression between the contrasting genotypes (Figs. 7, 8). The sedoheptulose-1,7-bisphosphatase was up-regulated by water deficit only in the C9 genotype, which also showed drought-induced up-regulation of some isoforms of the fructose-bisphosphate aldolase. The accumulation of these enzymes could be related to the greater level of CO2 fixation and higher photosynthetic rate observed in the C9 genotype (Alvim et al. 2001; Valente et al. 2009). However, we also detected down-regulation of two isoforms of the carbonic anhydrase (CA) in the C9 genotype (Fig. 8). CA is involved in photosynthesis and is usually repressed under drought stress in plants (Ahmad et al. 2016), having a great effect on photosynthesis and water use efficiency. However, by confronting the contrast WTxC9 under drought (at − 1.0 MPa), the relative abundance of the other CA isoform and ferrodoxin-NADP reductase was higher in the tolerant genotype C9 (Fig. 9). We also observed a greater abundance of the ROS-related enzymes superoxide dismutase and ascorbate peroxidase in the WT genotype. These results indicate that, under dehydration conditions, the BiP-overexpressing plants are capable of maintaining cellular homeostasis, by preventing endogenous oxidative stress, which is consistent with the previous observation that the content of malonilaldehyde, a product of lipid peroxidation associated with senescence, was lower in the genotype C9 compared to WT (Carvalho et al. 2014). In addition, both irrigated and non-irrigated C9 leaves displayed a higher abundance of photosynthesis-related proteins as compared to WT leaves. Accordingly, during drought, BiP-overexpressing soybean leaves have been shown to maintain a higher CO2 assimilation and stomatal conductance than wild type leaves (Valente et al. 2009; Carvalho et al. 2014).
The abundance of glycolysis-related and respiration-related enzymes was increased by water deficit conditions in WT leaves but not in C9 leaves (Figs. 7, 8). The induction of the glycolysis-related enzymes fructose-bisphosphate aldolase and triosephosphate isomerase by drought conditions have been previously reported and may reflect the changes in carbon metabolism in response to reduced photosynthesis and increased osmotic adjustment in leaves (Umeda et al. 1994). Thus, while the CO2 assimilation is maintained higher in C9 than in WT plants, their growth is inhibited to the same extent by drought (Alvim et al. 2001). Studies also report the highest relative abundance of respiration-related enzymes to compensate the ATP low production rates in chloroplasts under moderate stress (Flexas et al. 2005; Ribas-Carbo et al. 2005). Thus, our data support that BiP overexpression alters the amino acid metabolism during water stress, which constitutes an additional molecular strategy for drought tolerance in soybean. This finding corroborates with studies that compared drought sensitive and tolerant varieties of grasses (Oliver et al. 2011; Aayudh et al. 2017).
Concluding remarks
Integrative analysis of soybean leaves revealed a dynamic alteration in the protein and metabolome profiles in response to drought stress. BiP-overexpressing plants keeps, under low conditions of irrigation, showed a higher abundance of some photosynthesis-related proteins, which supports the hypothesis that these transgenic plants are predisposed genetically and physiologically to withstand periods of drought. We also showed that under a slow soil-drying regime, BiP overexpression delays leaf dehydration and maintains leaf turgor for a longer period. This osmotic adjustment was probably due to a higher content of amino acids altered by cascades modulated by BiP but not by ABA. This protective mechanism may explain the better performance of photosynthesis and other physiological activities in the BiP-overexpressing line under drought conditions.
Electronic supplementary material
Below is the link to the electronic supplementary material.
Acknowledgements
The authors would like to thank to NuBioMol (Center of Analyses of Biomolecules-UFV, Brazil) for the infrastructure and technical assistance. This study was supported by the National Institute of Science and Technology in Plant-Pest Interaction (INCT-IPP), The Brazilian Soybean Genome Consortium (GENOSOJA), the Fundação de Amparo à Pesquisa de Minas Gerais (FAPEMIG), Coordenação de Aperfeiçoamento de Pessoal de Nível Superior (CAPES) and Conselho Nacional de Desenvolvimento Científico e Tecnológico (CNPq).
Footnotes
Publisher’s Note
Springer Nature remains neutral with regard to jurisdictional claims in published maps and institutional affiliations.
References
- Aayudh D, Rushton PJ, Rohila JS. Metabolomic profiling of soybeans (Glycine max L.) reveals the importance of sugar and nitrogen metabolism under drought and heat stress. Plants. 2017;6(2):21. doi: 10.3390/plants6020021. [DOI] [PMC free article] [PubMed] [Google Scholar]
- Ahmad P, Rasool S, Gul A, Akram NA, Ashraf M, Gucel S. Jasmonates: multifunctional roles in stress tolerance. Front Plant Sci. 2016;7:813. doi: 10.3389/fpls.2016.00813. [DOI] [PMC free article] [PubMed] [Google Scholar]
- Alia MP, Matysik J. Effect of proline on the production of singlet oxygen. Amino Acids. 2001;21:195–200. doi: 10.1007/s007260170026. [DOI] [PubMed] [Google Scholar]
- Alvim FC, Carolino SMB, Cascardo JCM, Nunes CC, Martinez CA, Otoni WC, Fontes EPB. Enhanced accumulation of BiP in transgenic plants confers tolerance to water stress. Plant Physiol. 2001;126:1042–1054. doi: 10.1104/pp.126.3.1042. [DOI] [PMC free article] [PubMed] [Google Scholar]
- Ashraf M, Foolad MR. Roles of glycine betaine and proline in improving plant abiotic stress resistance. Environ Exp Bot. 2007;59:206–216. doi: 10.1016/j.envexpbot.2005.12.006. [DOI] [Google Scholar]
- Azooz MM, Youssef MM. Evaluation of heat shock and salycilic acid treatments as inducers of drought stress tolerance in hassawi wheat. Am J Plant Physiol. 2010;5:56–70. doi: 10.3923/ajpp.2010.56.70. [DOI] [Google Scholar]
- Bao Y, Howell SH. The unfolded protein response supports plant development and defense as well as responses to abiotic stress. Front Plant Sci. 2017 doi: 10.3389/fpls.2017.00344. [DOI] [PMC free article] [PubMed] [Google Scholar]
- Bartels D, Sunkar R. Drought and salt tolerance in plants. Crit Rev Plant Sci. 2005;24:23–58. doi: 10.1080/07352680590910410. [DOI] [Google Scholar]
- Bradford MM. A rapid and sensitive method for the quantitation of microgram quantities of protein utilizing the principle of protein-dye binding. Anal Biochem. 1976;72:248–254. doi: 10.1016/0003-2697(76)90527-3. [DOI] [PubMed] [Google Scholar]
- Carvalho HH, Brustolini OJB, Pimenta RP, Mendes GC, Gouveia BC, Silva PA, Silva JCF, Mota CS, Ramos JRLS, Fontes EPB. The molecular chaperone binding protein BiP prevents leaf dehydration-induced cellular homeostasis disruption. PLoS ONE. 2014;9:86661. doi: 10.1371/journal.pone.0086661. [DOI] [PMC free article] [PubMed] [Google Scholar]
- Cascardo JCM, Buzeli RAA, Almeida RS, Otoni WC, Fontes EPB. Differential expression of the soybean BiP gene family. Plant Sci. 2001;160:273–281. doi: 10.1016/S0168-9452(00)00384-8. [DOI] [PubMed] [Google Scholar]
- CONAB-National Supply Company (2014) Follow-up of the harvest 2013/2014. http://www.conb.gov.br/conteudos.php?a=1253&t=2. Accessed 10 Apr 2014
- Costa MDL, Reis PAB, Valente MAS, Irsigler AST, Carvalho CM, Loureiro ME, Aragão FJL, Boston RS, Fietto LG, Fontes EPB. A new branch of endoplasmic reticulum stress signaling and the osmotic signal converge on plant–specific asparagine–rich proteins to promote cell death. J Biol Chem. 2008;283:20209–20219. doi: 10.1074/jbc.M802654200. [DOI] [PubMed] [Google Scholar]
- Cuadros-Inostroza Á, Caldana C, Redestig H, Kusano M, Lisec J, Peña-Cortés H, Willmitzer L, Hannah MA. TargetSearch - a Bioconductor package for the efficient preprocessing of GC-MS metabolite profiling data. BMC Bioinformatics. 2009;10(1):428. doi: 10.1186/1471-2105-10-428. [DOI] [PMC free article] [PubMed] [Google Scholar]
- Dai A. Increasing drought under global warming in observations and models. Nat Clim Change. 2013;3:52–58. doi: 10.1038/nclimate1633. [DOI] [Google Scholar]
- Das A, Eldakak M, Paudel B, Kim WD, Hemmati H, Basu C, Rohila JS. Leaf proteome analysis reveals prospective drought and heat stress response mechanisms in soybean. Biomed Res. 2016;2016:6021047. doi: 10.1155/2016/6021047. [DOI] [PMC free article] [PubMed] [Google Scholar]
- De Ronde JA, Van Der Mescht A, Steyn HSF. Proline accumulation in response to drought and heat stress in cotton. Afr Crop Sci J. 2000;8:85–92. doi: 10.4314/acsj.v8i1.27718. [DOI] [Google Scholar]
- Dias MC, Brüggemann W. Limitations of photosynthesis in Phaseolus vulgaris under drought stress: gas exchange, chlorophyll fluorescence and Calvin cycle enzymes. Photosynthetica. 2010;48(1):96–102. doi: 10.1007/s11099-010-0013-8. [DOI] [Google Scholar]
- Djilianov D, Georgieva T, Moyankova D, Atanassov A, Shinozaki K, Smeeken SCM, Verma PDS, Murata N. Improved abiotic stress tolerance in plants by accumulation of osmoprotectants. Gene Transf Approach Biotechnol Biotechnol Equip. 2005;19:63–71. doi: 10.1080/13102818.2005.10817287. [DOI] [Google Scholar]
- Fernie AR, Carrari F, Sweetlove LJ. Respiratory metabolism: glycolysis, the TCA cycle and mitochondrial electron transport. Curr Opin Plant Biol. 2004;7:254–261. doi: 10.1016/j.pbi.2004.03.007. [DOI] [PubMed] [Google Scholar]
- Flexas J, Galmes J, Ribas-Carbo M, Medrano H. The effects of water stress on plant respiration. Plant respiration: from cell to ecosystem. Dordrecht: Springer; 2005. pp. 85–94. [Google Scholar]
- Foyer CH, Lam HM, Nguyen HT, Siddique KHM, Varshney R, Colmer TD, Cowling W, Bramley H, Mori TA, Hodgson JM, Cooper JW, Miller AJ, Kunert K, Vorster J, Cullis C, Ozga JA, Wahlqvist ML, Liang Y, Shou H, Shi K, Yu J, Fodor N, Kaiser BN, Wong FL, Valliyodan B, Considine MJ. Neglecting legumes has compromised global food and nutritional security. Nat Plants. 2016;2:1–10. doi: 10.1038/nplants.2016.112. [DOI] [PubMed] [Google Scholar]
- Gupta AS, Heinen JL, Holaday AS, Burke JJ, Allen RD. Increased resistance to oxidative stress in transgenic plants that overexpress chloroplastic Cu/Zn superoxide-dismutase. Proc Natl Acad Sci USA. 1993;90:1629–1633. doi: 10.1073/pnas.90.4.1629. [DOI] [PMC free article] [PubMed] [Google Scholar]
- Haigh NG, Johnson AE. A new role for BiP: closing the aqueous translocon pore during protein integration into the ER membrane. J Cell Biol. 2002;156:261–270. doi: 10.1083/jcb.200110074. [DOI] [PMC free article] [PubMed] [Google Scholar]
- Hamman BD, Hendershot LM, Johnson AE. BiP maintains the permeability barrier of the ER membrane by sealing the lumenal end of the translocon pore before and early in translocation. Cell. 1998;92:747–758. doi: 10.1016/S0092-8674(00)81403-8. [DOI] [PubMed] [Google Scholar]
- Häusler RE, Ludewig F, Krueger S. Amino acids—a life between metabolism and signaling. Plant Sci. 2014;229:225–237. doi: 10.1016/j.plantsci.2014.09.011. [DOI] [PubMed] [Google Scholar]
- Hildebrandt TM, Nesi AN, Araújo WL, Braun HP. Amino acid catabolism in plants. Mol Plant. 2015;8(11):1563–1579. doi: 10.1016/j.molp.2015.09.005. [DOI] [PubMed] [Google Scholar]
- Hirakuri MH, Lazzarotto JJ (2014) Soybean agribusiness in the world and Brazilian contexts. Embrapa Soy, Londrina. http://ainfo.cnptia.embrapa.br/digital/bitstream/item/104753/1/O-agronegocio-da-soja-nos-contextos-mundial-e-brasileiro.pdf. Accessed 24 Mar 2018
- Hong Z, Jin H, Tzfira T, Li J. Multiple mechanism–mediated retention of a defective brassinosteroid receptor in the endoplasmic reticulum of Arabidopsis. P. Cell. 2008;20:3418–3429. doi: 10.1105/tpc.108.061879. [DOI] [PMC free article] [PubMed] [Google Scholar]
- Huang B, Gao H. Growth and carbohydrate metabolism of creeping bentgrass cultivars in response to increasing temperatures. Crop Sci. 2000;40:1115–1120. doi: 10.2135/cropsci2000.4041115x. [DOI] [Google Scholar]
- Huang T, Jander G. Abscisic acid-regulated protein degradation causes osmotic stress induced accumulation of branched-chain amino acids in Arabidopsis thaliana. Planta. 2017;246:737–747. doi: 10.1007/s00425-017-2727-3. [DOI] [PubMed] [Google Scholar]
- Khan MS, Ahmad D, AdilKhan M. Utilization of genes encoding osmoprotectants in transgenic plants for enhanced abiotic stress tolerance. Electron J Biotech. 2015;8:257–266. doi: 10.1016/j.ejbt.2015.04.002. [DOI] [Google Scholar]
- Ku YS, Au-Yeung WK, Yung YL, Li MW, Wen CQ, Liu X, Lam HM. Drought stress and tolerance in soybean. In: Board JE, editor. A comprehensive survey of international soybean research—genetics, physiology, agronomy and nitrogen relationships. New York: InTech; 2013. pp. 209–237. [Google Scholar]
- Kurepa J, Wang S, Li Y, Smalle J. Proteasome regulation, plant growth and stress tolerance. Plant Signal Behav. 2009;4(10):924–927. doi: 10.4161/psb.4.10.9469. [DOI] [PMC free article] [PubMed] [Google Scholar]
- Leborgne-Castel N, Jelitto-Van Dooren EPWM, Crofts AJ, Denecke J. Overexpression of BiP in tobacco alleviates endoplasmic reticulum stress. Plant Cell. 1999;11:459–470. doi: 10.1105/tpc.11.3.459. [DOI] [PMC free article] [PubMed] [Google Scholar]
- Less H, Galili G. Principal transcriptional programs regulating plant amino acid metabolism in response to abiotic stresses. Plant Physiol. 2008;147:316–330. doi: 10.1104/pp.108.115733. [DOI] [PMC free article] [PubMed] [Google Scholar]
- Lisec J, Schauer N, Kopka J, Willmitzer L, Fernie AR. Gas chromatography mass spectrometry-based metabolite profiling in plants. Nat Protoc. 2006;1:387–396. doi: 10.1038/nprot.2006.59. [DOI] [PubMed] [Google Scholar]
- Lisec J, Peña-Cortés H, Willmitzer L, Hannah MA. TargetSearch—a bioconductor package for the efficient preprocessing of GC-MS metabolite profiling data. BMC Bioinform. 2009;10:428. doi: 10.1186/1471-2105-10-428. [DOI] [PMC free article] [PubMed] [Google Scholar]
- Meyer RF, Boyer JS. Osmoregulation, solute distribution, and growth in soybean seedlings having low water potentials. Planta. 1981;151:482–489. doi: 10.1007/BF00386543. [DOI] [PubMed] [Google Scholar]
- Müller M, Munné-Bosch S. Rapid and sensitive hormonal profiling of complex plant samples by liquid chromatography coupled to electrospray ionization tandem mass spectrometry. Plant Methods. 2011;7:37. doi: 10.1186/1746-4811-7-37. [DOI] [PMC free article] [PubMed] [Google Scholar]
- Nambara E, Kawaide H, Kamiya Y, Naito S. Characterization of an Arabidopsis thaliana mutant that has a defect in ABA accumulation: ABA dependent and ABA-independent accumulation of free amino acids during dehydration. Plant Cell Physiol. 1998;39:853–858. doi: 10.1093/oxfordjournals.pcp.a029444. [DOI] [PubMed] [Google Scholar]
- Oliveira GLT. The geopolitics of Brazilian soybeans. J Peasant Stud. 2016;43(2):348–372. doi: 10.1080/03066150.2014.992337. [DOI] [Google Scholar]
- Oliver MJ, Guo L, Alexander DC, Ryals JA, Wone BWM, Cushman JC. A sister group contrast using untargeted global metabolomic analysis delineates the biochemical regulation underlying desiccation tolerance in sporobolusstapfianus. Plant Cell. 2011;23:1231–1248. doi: 10.1105/tpc.110.082800. [DOI] [PMC free article] [PubMed] [Google Scholar]
- Parry MAJ, Andralojc PJ, Khan S, Lea PJ, Keys AJ. Rubisco activity: effects of drought stress. Ann Bot. 2002;89:833–839. doi: 10.1093/aob/mcf103. [DOI] [PMC free article] [PubMed] [Google Scholar]
- Pincus D, Chevalier MW, Aragon T, Van Anken E, Vidal SE, El-Samad H. BiP Binding to the ER-stress sensor ire1 tunes the homeostatic behavior of the unfolded protein response. PLoS Biol. 2010;1:1. doi: 10.1371/journal.pbio.1000415. [DOI] [PMC free article] [PubMed] [Google Scholar]
- Reddya AR, Chaitanyaa KV, Vivekanandanb M. Drought-induced responses of photosynthesis and antioxidant metabolism in higher plants. J Plant Physiol. 2004;161:1189–1202. doi: 10.1016/j.jplph.2004.01.013. [DOI] [PubMed] [Google Scholar]
- Reis PAB, Fontes EPB. N-rica proteína (NRP) mediada sinalização morte celular: um novo ramo da resposta ao estresse ER com implicações para a biotecnologia vegetal. Plant Signal Behav. 2012;7:628–632. doi: 10.4161/psb.20111. [DOI] [PMC free article] [PubMed] [Google Scholar]
- Reis PAB, Rosado GL, Silva LA, Oliveira LC, Oliveira LB, Costa MD, Alvim FC, Fontes EPB. The binding protein BiP attenuates stress-induced cell death in soybean via modulation of the N-rich protein-mediated signaling pathway. Plant Physiol. 2011;157:1853–1865. doi: 10.1104/pp.111.179697. [DOI] [PMC free article] [PubMed] [Google Scholar]
- Reis PAB, Carpinetti PA, Freitas PPJ, Santos EGD, Camargos LF, OliveiraI HT, Silva JCF, Carvalho HH, Dal-Bianco M, Ramos JLRS, Fontes EPB. Functional and regulatory conservation of the soybean ER stress-induced DCD/NRP-mediated cell death signaling in plants. BMC PlantBiol. 2016;16:156. doi: 10.1186/s12870-016-0843-z. [DOI] [PMC free article] [PubMed] [Google Scholar]
- Ribas-Carbo M, Taylor LN, Giles L, Busquets S, Finnegan PM, Day DA, Lambers H, Medrano H, Berry JA, Flexas J. Effects of water stress on respiration in soybean leaves. Plant Physiol. 2005;139:466–473. doi: 10.1104/pp.105.065565. [DOI] [PMC free article] [PubMed] [Google Scholar]
- Rodrigues SM, Andrade MO, Gomes APS, DaMatta FM, Baracat-Pereira MC, Fontes EPB. Arabidopsis and tobacco plants ectopically expressing the soybean antiquitin-like ALDH7 gene display enhanced tolerance to drought, salinity, and oxidative stress. J Biol Chem. 2006;57:1909–1918. doi: 10.1093/jxb/erj132. [DOI] [PubMed] [Google Scholar]
- Ruberti C, Kim SJ, Stefano G, Brandizzi F. Unfolded protein response in plants: one master, many questions. Curr Opin Plant Biol. 2015;27:59–66. doi: 10.1016/j.pbi.2015.05.016. [DOI] [PMC free article] [PubMed] [Google Scholar]
- Scholander PE, Hammel HT, Bradstreet ED, Hemmingsen EA. Sap pressure in vascular plants. Science. 1965;148:339–346. doi: 10.1126/science.148.3668.339. [DOI] [PubMed] [Google Scholar]
- Shevchenko A, Tomas H, HavlĭsOlsen JV, Mann M. In-gel digestion for mass spectrometric characterization of proteins and proteomes. Nat Protoc. 2007;1:2856–2860. doi: 10.1038/nprot.2006.468. [DOI] [PubMed] [Google Scholar]
- Shinozaki K, Yamaguchi-Shinozaki K, Seki M. Regulatory network of gene expression in the drought and cold stress responses. Curr Opin Plant Biol. 2003;6:410–417. doi: 10.1016/S1369-5266(03)00092-X. [DOI] [PubMed] [Google Scholar]
- Shulaev V, Cortes D, Miller G, Mittler R. Metabolomics for plant stress response. Physiol Plant. 2008;132:199–208. doi: 10.1111/j.1399-3054.2007.01025.x. [DOI] [PubMed] [Google Scholar]
- Silva MA, Jifon JL, Silva JAG, Sharma V. Use of physiological parameters as fast tools to screen for drought tolerance in sugarcane. Braz J Plant Physiol. 2007;19:193–201. doi: 10.1590/S1677-04202007000300003. [DOI] [Google Scholar]
- Silva PA, Silva JCF, Caetano HDN, Machado JPB, Mendes GC, Reis PAB, Brustolini OJB, Dal-Bianco M, Fontes EPB. Comprehensive analysis of the endoplasmic reticulum stress response in the soybean genome: conserved and plant-specific features. BMC Genom. 2015;16:783. doi: 10.1186/s12864-015-1952-z. [DOI] [PMC free article] [PubMed] [Google Scholar]
- Silvente S, Sobolev AP, Lara M. Metabolite adjustments in drought tolerant and sensitive soybean genotypes in response to water stress. PLoS ONE. 2012;7:e38554. doi: 10.1371/journal.pone.0038554. [DOI] [PMC free article] [PubMed] [Google Scholar]
- Stewart GR, Larher F. Accumulation of amino acids and related compounds in relation to environmental stress. Biochem Plants. 1980;5:609–635. [Google Scholar]
- Tripathi P, Rabara RC, Reese RN, Miller MA, Rohila JS, Subramanian S, Shen QJ, Morandi D, Bücking H, Shulaev V, Rushton PJ. A toolbox of genes, proteins, metabolites and promoters for improving drought tolerance in soybean includes the metabolite coumestrol and stomatal development genes. BMC Genom. 2016;17:1–22. doi: 10.1186/s12864-016-2420-0. [DOI] [PMC free article] [PubMed] [Google Scholar]
- Umeda M, Hara C, Matsubayashi Y, Li HH, Liu Q, Tadokoro F, Aotsuka S, Uchimiya H. Expressed sequence tags from cultured cells of rice 106 (Oryza sativa L.) under stressed conditions: analysis of genes engaged in ATP generating pathways. Plant Mol Biol. 1994;25:469–478. doi: 10.1007/BF00043875. [DOI] [PubMed] [Google Scholar]
- Valente MAS, Faria JQA, Ramos JRLS, Reis PAB, Pinheiro GL, Piovesan ND, Morais AT, Menezes CC, Cano MAO, Fietto LG, Loureiro ME, Aragao FJL, Fontes EBP. The ER luminal binding protein (BiP) mediates an increase in drought tolerance in soybean and delays drought-induced leaf senescence in soybean and tobacco. J Exp Bot. 2009;60:533–546. doi: 10.1093/jxb/ern296. [DOI] [PMC free article] [PubMed] [Google Scholar]
- Wang D, Weaver ND, Kesarwani M, Dong X. Induction of protein secretory pathway is required for systemic acquired resistance. Science. 2005;308:1036–1040. doi: 10.1126/science.1108791. [DOI] [PubMed] [Google Scholar]
- Wehmeyer N, Vierling E. The expression of small heat shock proteins in seeds responds to discrete developmental signals and suggests a general protective role in desiccation tolerance. Plant Physiol. 2000;122:1099–1108. doi: 10.1104/pp.122.4.1099. [DOI] [PMC free article] [PubMed] [Google Scholar]
- You J, Chan Z. ROS regulation during abiotic stress responses in crop plants. Front Plant Sci. 2015 doi: 10.3389/fpls.2015.01092. [DOI] [PMC free article] [PubMed] [Google Scholar]
- Zhu JK. Abiotic stress signaling and responses in plants. Cell. 2016;167(2):313–324. doi: 10.1016/j.cell.2016.08.029. [DOI] [PMC free article] [PubMed] [Google Scholar]
- Zhu T, Budworth P, Han B, Brown D, Chang HS, Zou G, Wang X. Toward elucidating the global expression patterns of developing Arabidopsis: parallel analysis of 8300 genes by a high-density oligonucleotide probe array. Plant Physiol Biochem. 2001;39:221–242. doi: 10.1016/S0981-9428(00)01234-1. [DOI] [Google Scholar]
Associated Data
This section collects any data citations, data availability statements, or supplementary materials included in this article.