

Summary
Brassica oleracea is an important agricultural species encompassing many vegetable crops including cabbage, cauliflower, broccoli and kale; however, it can be susceptible to a variety of fungal diseases such as clubroot, blackleg, leaf spot and downy mildew. Resistance to these diseases is meditated by specific disease resistance genes analogs (RGAs) which are differently distributed across B. oleracea lines. The sequenced reference cultivar does not contain all B. oleracea genes due to gene presence/absence variation between individuals, which makes it necessary to search for RGA candidates in the B. oleracea pangenome. Here we present a comparative analysis of RGA candidates in the pangenome of B. oleracea. We show that the presence of RGA candidates differs between lines and suggests that in B. oleracea, SNPs and presence/absence variation drive RGA diversity using separate mechanisms. We identified 59 RGA candidates linked to Sclerotinia, clubroot, and Fusarium wilt resistance QTL, and these findings have implications for crop breeding in B. oleracea, which may also be applicable in other crops species.
Keywords: Brassica oleracea, resistance genes, RGAs, pangenomics, PAV, Brassicaceae
Introduction
Brassica oleracea is a member of the large and agronomically important Brassicaceae family, which consists of more than 372 genera and 4060 species (The Plant List, 2010). B. oleracea species encompass many popular and nutritious vegetable crops including cabbages, cauliflower, broccoli, brussels sprout, kohlrabi and kale. These species are susceptible to a range of diseases including blackleg, clubroot, sclerotinia stem rot, downy mildew and powdery mildew (Channon, 1981; Neik et al., 2017; Punithalingham and Holliday, 1972; Voorrips, 1995).
Pathogens use a diverse array of strategies to enter, survive and successfully infect their host. In response to this attack, plants use a two‐branched innate immune system (Jones and Dangl, 2006). Molecules common to many classes of microbes, including non‐pathogens, called pathogen‐ or microbial‐associated molecular patterns (PAMPS or MAMPS) are recognized by the first branch of the immune system, resulting in PAMP‐triggered immunity (PTI), and further colonization can be stopped (Jones and Dangl, 2006). However, pathogens have evolved the capacity to deliver effector molecules or virulence factors to suppress PTI, and such interference can result in effector‐triggered susceptibility (ETS) (Jones and Dangl, 2006; Hammond‐Kosack and Jones, 1996). Specific recognition of effector molecules in planta is determined by resistance gene (R‐gene) products, and consequently a gene for gene interaction ensues. When both the pathogens’ avirulence (Avr) gene and the corresponding plant's R‐gene products are present, disease resistance occurs (incompatible interaction). A plant is susceptible if the corresponding R‐gene is absent or inactive (compatible interaction; Dangl & Jones, 2001).
There are several classes of R‐genes. These classes are defined by their structural motifs (Kruijt et al., 2005). The largest class of proteins encoded by R‐genes in plant genomes belongs to the nucleotide‐binding site and leucine‐rich repeat (NBS‐LRR) domain‐containing class of proteins (Baumgarten et al., 2003). NBS‐LRR proteins have a variable N‐terminus, which commonly contains a domain with similarity to the Drosophila Toll and mammalian interleukin‐1 receptor (TIR) or a coiled coil (CC) sequence. NBS‐LRR domains share a high degree of sequence identity and have a number of conserved motifs, which can be used to identify NBS‐LRR genes (Meyers et al., 1999; Neik et al., 2017; Wan et al., 2012).
R‐genes are grouped into resistance gene analogs (RGAs) with pattern‐recognition receptors (PRRs; Sekhwal et al., 2015). PRRs are classified into two groups: surface‐localized receptor‐like protein kinases (RLKs; Walker, 1994) and membrane associated receptor‐like proteins (RLPs). RLKs and RLPs are a large group of proteins that are necessary for regular plant development (Morris and Walker, 2003) but are also necessary in plant disease resistance (Kruijt et al., 2005). RLKs carry a cytoplasmic‐kinase domain while RLPs carry a short cytoplasmic tail. In tomato, it has been shown that RLKs and RLPs interact: RLKs act as receptors which mediate downstream signalling by way of binding RLPs (Liebrand et al., 2013).
The increasing availability of plant genomes allows for the in silico analysis of gene families, such as NBS‐LRRs and PRRs. Genome‐wide analysis of NBS‐LRRs has been performed in numerous plant species (Ameline‐Torregrosa et al., 2008; Gu et al., 2015; Jupe et al., 2012; Kang et al., 2012; Lozano et al., 2012, 2015; Meyers et al., 2003; Seo et al., 2016; Singh et al., 2015; Wei et al., 2013; Zheng et al., 2016; Zhou et al., 2004). Recently, there has been analysis of NBS‐LRRs in several Brassica species, including B. rapa, B. napus and B. oleracea (Alamery et al., 2018; Chalhoub et al., 2014; Golicz et al., 2016; Lv et al., 2015; Mun et al., 2009; Sarris et al., 2016; Shao et al., 2016; Wu et al., 2014; Yu et al., 2014; Zhang et al., 2016a,b). RLKs and RLPs have been comprehensively mined in wild strawberry (Li et al., 2017) and characterized in tomato (Kawchuk et al., 2001), Arabidopsis thaliana (Wang et al., 2008), rice (Fritz‐Laylin et al., 2005) and poplar (Petre et al., 2014). This analysis has demonstrated that different genomes contain different RGAs and that there is a variation in RGA content between different lines.
It has been shown in several plant species that groups of R‐genes and PRRs cluster closely together within the genome. For example in B. napus several Leptosphaeria maculans‐specific R‐genes cluster closely together (Delourme et al., 2004), as do clubroot resistance genes in B. rapa (Kato et al., 2013). This close linkage is important in generating novel resistance by recombination (Hulbert et al., 2001), where intragenic crossover events lead to new motif combinations.
A second mechanism that introduces diversity is transposable element (TE)‐mediated rearrangement, diversification and duplication. A TE may also change gene expression by inserting itself into genes or by recruiting repressive methylation and therefore changing expression in nearby genes (Masson et al., 1987; McClintock, 1956), and R‐gene clusters have been shown to be associated with TEs in rice (Song et al., 1997) and barley (Wei et al., 2002).
Analysis of the B. oleracea pangenome has identified abundant structural variation [presence absence variants (PAV) and copy number variants (CNV)]. Golicz et al. (2016) showed that 18.7% of the 61 380 B. oleracea genes in the pangenome were not present in all lines. In addition, many of these dispensable genes are related to agronomic and other important traits, including disease resistance, suggesting that PAVs may be important for the breeding of improved Brassica crops. The gene‐for‐gene interaction in disease resistance drives a molecular arms race between pathogen and host, and natural selection drives pathogens to either dispense of or diversify its array of effectors, while host plants are required to combat this through R‐gene duplication and diversification (Jones and Dangl, 2006; Dangl and Jones, 2001). In order to better understand this process, we have identified candidate RGAs in the pangenome of B. oleracea. We investigate which are core or dispensable and determine whether those in clusters are more likely to be lost or conserved. We then link the PAV status of RGAs with the presence or absence of TEs showing that TEs are strongly associated with variability in RGAs.
Results and discussion
Genome‐wide distribution of RGA candidates
A total of 1989 RGA candidates were identified in the B. oleracea pangenome (Figure 1, Table S1). The largest class of resistance gene candidates was RLKs (901), followed by NBS‐LRR genes (556; Table 1). TX (TIR domain with unknown domain) and TNLs (TIR domain, NB‐ARC domain and Leucine‐rich‐repeat domain) were the largest subclass within the NBS‐LRR genes (129 and 123). The RGA candidate density per pseudomolecule was roughly similar to all pseudomolecules (average: 3.7 RGA candidates per Mbp ranging from 2.8 on pseudomolecule C5 to 4.3 on C9), though the additional contigs which are not contained within the reference assembly harboured more NBS‐LRR and RLK than RLP candidate genes (121, 79, and 54 respectively).
Figure 1.
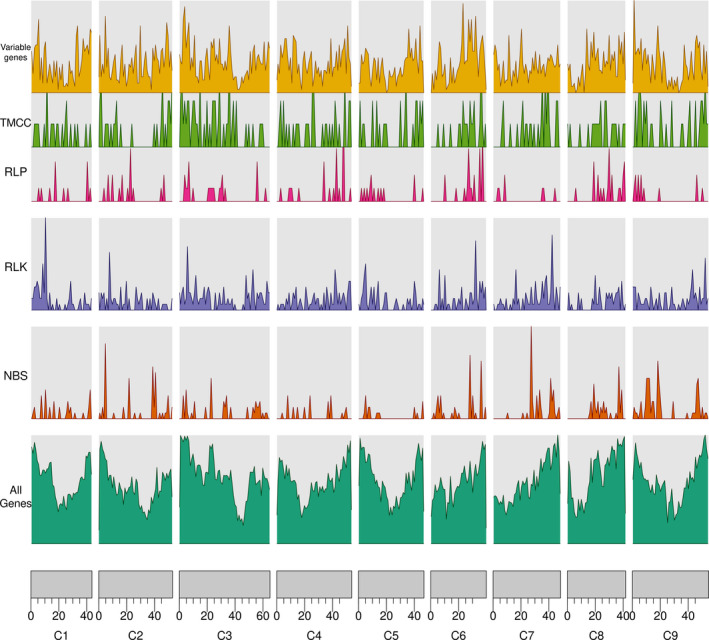
Density of genes compared with the density of NBS, RLK, RLP as well as variable genes.
Table 1.
Count of resistance gene classes in the Brassica oleracea pangenome
| Class | C1 | C2 | C3 | C4 | C5 | C6 | C7 | C8 | C9 | Unplaced scaffolds | Total in reference genome | Additional contigs in pangenome | Total |
|---|---|---|---|---|---|---|---|---|---|---|---|---|---|
| CN | 2 | 2 | 0 | 1 | 1 | 2 | 3 | 3 | 0 | 2 | 16 | 11 | 27 |
| CNL | 5 | 3 | 6 | 6 | 3 | 5 | 4 | 6 | 5 | 4 | 47 | 9 | 56 |
| NBS | 2 | 5 | 4 | 2 | 2 | 5 | 3 | 4 | 5 | 8 | 40 | 25 | 65 |
| NL | 7 | 7 | 8 | 2 | 3 | 5 | 7 | 10 | 24 | 4 | 77 | 42 | 119 |
| TN | 1 | 5 | 2 | 2 | 1 | 12 | 2 | 3 | 4 | 1 | 33 | 4 | 37 |
| TNL | 8 | 25 | 18 | 6 | 4 | 7 | 15 | 9 | 24 | 5 | 121 | 8 | 129 |
| TX | 9 | 8 | 13 | 6 | 3 | 7 | 15 | 5 | 21 | 18 | 105 | 18 | 123 |
| Total NBS‐LRR | 34 | 55 | 51 | 25 | 17 | 43 | 49 | 40 | 83 | 42 | 439 | 117 | 556 |
| RLK LRR | 32 | 31 | 65 | 27 | 32 | 32 | 41 | 17 | 32 | 12 | 321 | 13 | 334 |
| RLK Other | 51 | 44 | 74 | 65 | 38 | 43 | 57 | 42 | 68 | 19 | 501 | 66 | 567 |
| Total RLK | 83 | 75 | 139 | 92 | 70 | 75 | 98 | 59 | 100 | 31 | 822 | 79 | 901 |
| RLP LRR | 12 | 16 | 22 | 23 | 12 | 22 | 7 | 20 | 12 | 10 | 156 | 54 | 210 |
| RLP Other | 0 | 1 | 0 | 0 | 1 | 0 | 0 | 1 | 0 | 0 | 3 | 0 | 3 |
| Total RLP | 12 | 17 | 22 | 23 | 13 | 22 | 7 | 21 | 12 | 10 | 159 | 54 | 213 |
| Other | 1 | 2 | 1 | 1 | 1 | 2 | 4 | 2 | 0 | 0 | 14 | 4 | 18 |
| Total | 152 | 179 | 268 | 177 | 129 | 165 | 189 | 146 | 235 | 89 | 1729 | 260 | 1989 |
| Total per Mbp | 3.47 | 3.38 | 4.12 | 3.29 | 2.75 | 4.14 | 3.91 | 3.50 | 4.30 | 2.13 | 3.87 | 2.64 | 3.65 |
NBS‐LRR genes have been previously mined in B. oleracea where 239 NBS‐LRR were identified (Yu et al., 2014), around half the number identified in this study. We used a newer annotation and assembly as it has been shown that older B. oleracea annotations contain incomplete or misannotated R‐genes (Lv et al., 2014). Such analyses of R‐gene identification can be influenced by the quality of the genome assembly. Errors in the genome assembly or gene prediction can lead to wrongly predicted numbers of R‐genes. Other methods exist to gain insight into the number of R‐genes which do not rely on reference genomes, such as ReNSeq for NBS‐LRR identification (Jupe et al., 2013). We also used an improved RGA candidate prediction pipeline which compared RGA candidates with a larger set of known R‐genes, while the previous study discarded R‐gene candidates that did not align with a B. oleracea specific NBS profile.
We found that the largest class of RGA candidates was RLKs, which is consistent with observations in other plants such as wild strawberry and cotton (Chen et al., 2015; Li et al., 2017). The larger number of RLK than RLP and NBS‐LRR genes could be due to a greater diversity of roles of these genes. In the Brassicaceae, RLK genes have been implicated in a variety of regular developmental mechanisms such as self‐incompatibility (Takayama and Isogai, 2003) so they are not necessarily involved in resistance. There is no such functional diversity in other RGA classes such as NBS‐LRR genes (McHale et al., 2006).
We found that resistance genes were unevenly distributed along the pseudomolecules (Table 1) which fits prior observations including in B. oleracea (Golicz et al., 2016), B. napus (Chalhoub et al., 2014), and other plant species such as rice (Rice Chromosomes 11 and 12 Sequencing Consortia, 2005). This uneven distribution is likely due to recent tandem gene amplifications and segmental duplications (Rice Chromosomes 11 and 12 Sequencing Consortia, 2005).
We compared the counts of RGA candidates within the different lines based on presence/absence results. The wild type relative B. macrocarpa contains the highest number of RGA candidates (1495), 45 more than the average total of the domesticated B. oleracea lines and 93 more than the reference cultivar TO1000 (Table 2). Six RGA candidates appear only in TO1000 (two TX, two TN and two NL), no other RGA candidates appear in only one line. TO1000 carried the lowest number of RGA candidates in all categories except TN, TNL and TX. Of the RGA candidate genes, 1231 were present in all lines (core) and 167 (12%) were variable (lost in at least one line). RLKs and CNLs showed the lowest percentage of variable genes (4.5% and 8.5% respectively), while NL and NBS showed the highest number of variance (31.2% and 32.4%). The high percentage of variable genes that are incomplete (NL, CN, TN) could mean that these are pseudogenes that the genome can afford to lose without consequences in the form of lost resistance.
Table 2.
Count of RGA candidates per line and RGA class
| Name | Line | CN | CNL | NBS | NL | RLK | RLP | TN | TNL | TX | Total |
|---|---|---|---|---|---|---|---|---|---|---|---|
| Early Big | Broccoli | 19 | 48 | 46 | 90 | 834 | 169 | 31 | 108 | 105 | 1450 |
| AC498 (Gower DH line) | Brussels Sprouts | 17 | 53 | 43 | 86 | 850 | 181 | 30 | 115 | 96 | 1471 |
| Badger Inbred 16 | Cabbage1 | 15 | 52 | 40 | 85 | 844 | 173 | 30 | 117 | 97 | 1453 |
| HRIGRU009617 DH3 | Cabbage2 | 20 | 50 | 39 | 90 | 846 | 174 | 29 | 113 | 100 | 1461 |
| BOL909 | Cauliflower1 | 19 | 48 | 37 | 88 | 841 | 171 | 30 | 117 | 97 | 1448 |
| CA25 (Nedcha DH line) | Cauliflower2 | 18 | 52 | 41 | 84 | 847 | 172 | 30 | 110 | 93 | 1447 |
| ARS_18 (Arsis DH) | Kale | 18 | 53 | 38 | 86 | 846 | 178 | 29 | 115 | 99 | 1462 |
| HRIGRU011183 DH1 | Kohlrabi | 17 | 51 | 39 | 87 | 842 | 174 | 28 | 113 | 99 | 1450 |
| B. macrocarpa | B. macrocarpa | 21 | 52 | 41 | 97 | 862 | 186 | 30 | 110 | 96 | 1495 |
| TO1000 DH3 | TO1000 | 14 | 47 | 34 | 79 | 821 | 157 | 32 | 119 | 99 | 1402 |
Interestingly, there were more NBS‐LRR than RLK and RLP genes in the additional pangenome non‐reference contigs, indicating that NBS‐LRR genes show a greater variability than RLK and RLP genes. Based on PAV data, these RGA candidates are differently distributed between the nine individuals on which the pangenome was based. As expected, the wild relative B. macrocarpa carried the greatest number of RGA candidates and these may have been lost in domesticated lines during domestication. B. macrocarpa shows partial leaf and moderate stem resistance to Sclerotinia sclerotiorum infection (Taylor et al., 2018) to which all Brassica plants are susceptible, and this may be linked with the additional RGA candidates. The kale‐like reference cultivar TO1000 showed the lowest number of RGA candidates indicating that in searching for RGAs it is best to not focus on the reference genome alone.
Physical cluster distribution
We allocated RGA candidates to physical RGA‐gene‐rich clusters where R‐genes are within 10 genes of each other, and found 744 out of 1729 (43%) of RGA candidates reside within physical clusters. The percentage of physically clustered genes varied between RGA classes. For NBS‐LRR genes, 310 out of 453 (68%) genes were located in physical clusters, while 339 out of 822 (41%) RLK genes and 53 out of 159 (33%) RLP were located in physical clusters. In most plants it has been shown that RGA candidates locate within RGA‐gene‐rich clusters. In Arabidopsis, 113 out of 159 (71%) NBS‐LRR genes are located within RGA‐gene‐rich clusters (Guo et al., 2011), and in rice, 76% of NBS‐LRR genes are located within RGA‐gene‐rich clusters (Zhou et al., 2004). More recently, three Yr genes conferring resistance to wheat yellow rust where found in wheat, all of which are located within the same cluster (Marchal et al., 2018).
The RGA candidate density was compared with available PAV data. There were more variable NBS‐LRR genes within physical clusters than outside of clusters (87, 18) and more core NBS‐LRR genes within physical clusters than outside of clusters (219, 111). A chi‐square test was used to test for independence of these two classes and they were not equally distributed (χ2 = 9.6, P < 0.05). This indicates that the PAV status of NBS‐LRR genes and the physical cluster status is strongly linked, suggesting that the presence of a gene within a cluster may protect it from being lost. NBS‐LRR genes are often located in physical clusters containing many perfect copies (Michelmore and Meyers, 1998). However, membership in such a cluster does not always protect from loss, as deletions within R‐gene clusters have been described in the melon genome, where a 146 kb deletion was affecting a 23 R‐gene cluster with two more structural variants affecting R‐genes (Sanseverino et al., 2015).
Sequence‐based clustering of RGA candidates
The RGA candidates were clustered based on the sequence identity to find the number of allelic variants describing the true extent of RGA diversity in the 10 lines. At a minimum identity of 70%, we found 280 clusters with 716 members in total, ranging from 2 to 7 members. Of the clustered RGA candidate classes, 188 were RLKs, 133 were NBS‐LRR, 26 were RLPs and 972 RGA candidates remained as unclustered singletons. Most of the largest clusters contained only RLKs as almost perfect copies from different locations in the genome (cluster 0: 7 RLKs, cluster 1: 6 RLKs, cluster 2: 2 NBS, 2 TNLs, 1 NL, 1 TX, cluster 3: 1 NBS, 1 TNL, 1 CNL, 2 OTHER, 1 TX, cluster 4: 6 RLKs; Figure S1).
Most genes within clusters were present in all lines (563 core, 153 variable). The 10 largest clusters containing only RLKs consisted of mostly core genes (median 100% core, average: 96% core). The clusters were classified based on whether they contained only RLK, only RLP, only NBS‐LRR genes, or a mixture of these three. All the clusters contained on average and median 79% core genes, independent of type.
The average sequence identity of all clusters was 80.4% indicating relatively high divergence between R‐gene paralogs. In Arabidopsis, there are very few R‐gene paralogs which show high sequence identity, which we also observe, with the majority of R‐genes showing no perfect identity (Bergelson et al., 2001). This is likely due to the positive selection acting on these R‐genes.
RGA candidates and transposable elements
We tested the hypothesis whether resistance genes and variable genes overlap more often than expected when compared with all other genes. To this end, we tested for physical overlap and physical distance‐based association between resistance gene classes and variable genes. NBS‐LRR genes showed the greatest variability of all classes of RGAs based on the strongest, statistically significant overlap association with a Z‐score of 11 (P < 0.005; Figure 2, Table S2). RLK genes, on the other hand, showed significantly less variability than expected (P < 0.05, Table S2, Figure S2).
Figure 2.
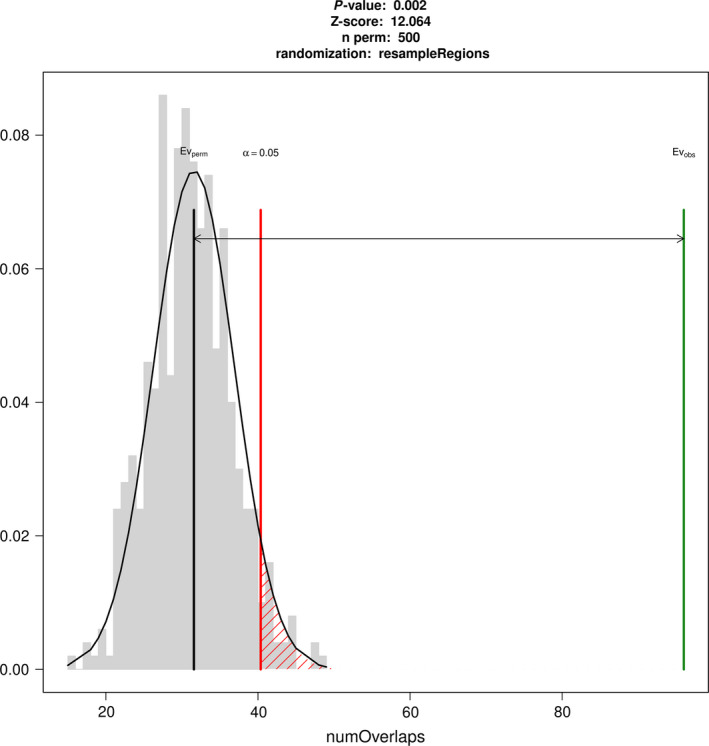
Expected (Evperm) and observed (Evobs) overlaps between NBS genes and PAV genes showing that the number of overlaps is higher than expected.
We searched for RGA candidates which are lost or retained in pairs, as a proxy for selection pressure. R‐gene pairs that are lost together but are in close proximity may have been lost due to chance, while R‐gene pairs that are distant from each other but have been lost together may hint at a selection pressure impacting gene conservation, as has been observed with homeologous gene pairs where copies subfunctionalize (Adams et al., 2003).
Of the 168 variable RGA candidates, 59 pairs [118 (70%) RGA candidates] were present or absent in the same individuals. Of these, 35 RGA candidates were located on the same pseudomolecule, and a further 11 pairs were located within 10 Kbp of each other. These 11 pairs may have been lost due to chance alone. Another 24 pairs were located on different pseudomolecules. These pairs were mostly evenly distributed along the pseudomolecules with a maximum of three pairs between RGA candidates on C8 and C9. In B. oleracea, specific R‐genes were previously associated with hybrid lethality (HL; Xiao et al., 2017), where two interacting loci cause hybrid failure, eventually leading to speciation (Orr, 1996). While none of the RGA candidates lost in tandem were linked to HL before in B. oleracea (Xiao et al., 2017), it may explain some of the genes lost in tandem here.
We investigated whether the RGA candidate and PAV association is dependent on the position in the genome, or whether the association is class‐dependent alone. The association between NBS‐LRR candidate genes and PAV, and the association between TEs and PAV genes are highly context and position dependent since the association measured by the Z‐score falls after shifting positions for more than 3 Kbp (Figure S3).
We searched for elements, such as TEs and simple repeats, in surrounding regions and checked for the distance association between PAVs and TEs. In our data, there was no association between PAVs and simple repeats; however, the average distance between TEs and PAVgenes is lower than expected (P < 0.05, Figures S4 and S5). This association also holds up for the mean distance between TE and NBS‐LRR genes, but not for RLK genes, which fits with the previous observation that NBS‐LRR genes are the most variable class of all the RGAs. TE activity has previously been linked with R‐genes (Hulbert et al., 2001). In rice, it has been shown that an inactive rice blast resistance gene has undergone refunctionalization due to the recruitment of a retrotransposon (Hayashi and Yoshida, 2009). In A. thaliana, a complex regulatory system involving TEs has been described, where a transposon insertion in an intron of RPP7 (resistance to downy mildew) controlled by EDM2 results in two different RPP7 isoforms which are both important in the plant's pathogen resistance (Tsuchiya and Eulgem, 2013). Therefore, TEs seem to have an important role in generating novel disease resistance in plants. TEs also play a role in presence/absence variation (PAV). During TE transposition in maize, unrelated genes located nearby can be captured and relocated (Lai et al., 2005) causing PAV.
SNP analysis
To examine the association between SNPs and RGAs, we compared the 4 815 081 SNPs called by (Golicz et al., 2016) with our RGA candidates. Predicted functional changes were analysed within the RGA candidates. Of the SNPs positioned within RGA candidate coding sequences, 434 were predicted to be high impact, 17 109 moderate impact and 16 515 low impact. Of the high impact SNPs, 267 introduced premature stop codons, 33 led to the loss of stop codons, 23 lead to lost start codons, and finally 53 splice acceptor variants and 58 splice donor variants were introduced. There were more high impact SNPs in RGA candidate genes than in non‐RGA candidate genes, with 434 high impact SNPs for 1729 RGA candidate genes (ratio: 0.26), and only 9860 high impact SNPs for 59 651 non‐RGA genes (ratio: 0.16). In Arabidopsis, R‐genes are known to amass unusually large numbers of non‐synonymous SNPs, producing new allelic variants of R‐genes (Bakker et al., 2006) which corresponds with our observations.
Resistance genes analogs located on the extra pangenome contigs contained fewer SNPs than RGAs located on pseudomolecules. Out of 1729 RGAs on pseudomolecules, 23 contained no SNPs (1%), while out of 261 RGAs on the extra pangenome contigs, 97 contained no SNPs (37%). RLK genes in particular showed more low impact variants than the other RGA classes (Figure 3), with similar patterns in upstream and downstream variants (Figure S6).
Figure 3.
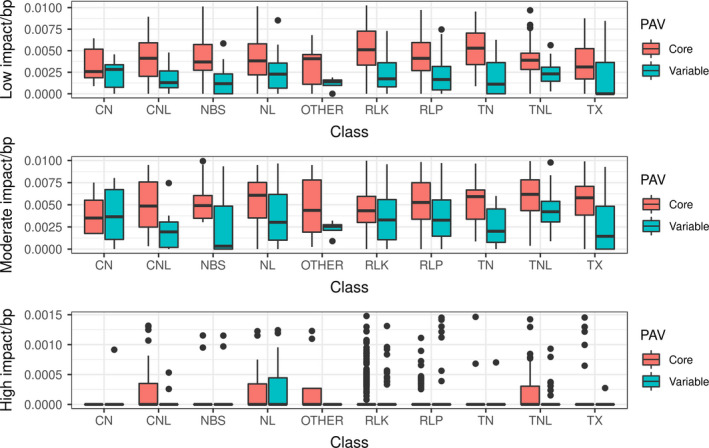
High impact, moderate impact and low impact SNPs per base pair compared with RGA class and presence/absence status.
We expect to see a lower SNP density in the non‐reference contigs since these contigs exist in only a few individuals. On average, core genes had more low and moderate impact SNPs than variable genes (average: 12 in core, four in variable genes). Core genes and variable genes had almost identical numbers of high impact SNPs (average 0.25 in both cases). This comparison is confounded by the lower SNP density in variable genes (35 187 SNPs in core, 3665 in variable genes). In Arabidopsis populations, the nucleotide diversity in R‐genes showing presence/absence variation is much lower than in core R‐genes (Shen et al., 2006), indicating two different mechanisms of selection. This may be the case in B. oleracea as well.
Linking SNPs and PAV
The interplay between variation generated by SNPs and variation generated by PAVs was assessed. In 303 RGA candidates, of which 132 were NBS‐LRRs, 131 were RLKs, and 40 RLPs, likely loss of function causing SNPs were identified. Interestingly, even though there were more RLKs found in the pangenome, the percentage of NBS‐LRR genes with loss of function SNPs was higher than in RLKs, again indicating that NBS‐LRRs mutate faster as observed with higher PAV in NBS‐LRRs (Figure S6). This discrepancy could also be due to different roles in RLKs past disease resistance.
Of the RGA candidates carrying at least one loss of function SNP, 66 genes were variable and 237 were present in all lines, which fits with the previous observation that variation generated by SNPs is mostly distinct from variation generated by PAV.
Resistance genes‐analog class and PAV was linked significantly with the number of moderate and low impact SNPs (Chi‐squared test, P < 0.05). High impact SNPs were only statistically significantly linked with RGA class and not with PAV status. This indicates that PAV and SNP based variability act separately from each other in B. oleracea RGA candidates, as has been observed in Arabidopsis (Tan et al., 2012). There seem to be two different paths to increase RGA gene diversity, which seem to work mostly exclusive from each other—either a gene collects a loss of function mutation, or it is lost entirely. Why these two mechanisms do not significantly overlap remains to be determined.
Linking known QTL and R‐genes
The RGA candidate positions were compared with known quantitative trait loci (QTL) for Sclerotinia, clubroot and Fusarium wilt resistance to assess possible biological functions. Pseudomolecule positions were predicted for 32 out of 49 QTL markers, leading to 12 out of 18 reported QTL with positions in the v2.1 assembly. These QTL covered between 0.2 and 34.6 Mbp (average: 9.8 Mbp) on five pseudomolecules with a total of 10 863 genes, out of which 297 genes (2.7%) were RGA candidates (Table 3). Ignoring the four QTL larger than 10 Mbp resulted in 2528 genes underlying the QTL, out of which 59 (2.3%) were RGA candidates.
Table 3.
Reported QTL for Sclerotinia and black rot resistance, their position in the Brassica oleracea v2.1 assembly and RGA candidates contained therein
| QTL name | Resistance | Publication | Pseudomolecule | Start (Mbp) | End (Mbp) | Length (Mbp) | RGA candidate classes | Core genes percentage |
|---|---|---|---|---|---|---|---|---|
| BRQTL‐C1_2 (BoRSdcaps1‐13 ‐ BoEdcaps4) | Black rot | Lee et al. (2015) | C1 | 18.2 | 37.1 | 18.9 | CN 2, CNL 6, NL 6, TNL 2, TX 4, RLK 30, RLP 4 | 54 core (100% core) |
| BRQTL‐C1_2 (BoRSdcaps1‐14 ‐ BoEdcaps4) | Black rot | Lee et al. (2015) | C1 | 19.6 | 37.1 | 17.5 | CN 1, CNL 3, NL 3, TNL 1, TX 2, RLK 15, RLP 2 | 27 core (100% core) |
| BRQTL‐C1_2 (BoESSR089 ‐ BoEdcaps4) | Black rot | Lee et al. (2015) | C1 | 32.1 | 37.1 | 5 | RLK 3 | 3 core (100% core) |
| QTL‐1 (BoCL3135s ‐ BoCL5545s) | Black rot | Kifuji et al. (2013) | C2 | 1.9 | 6.3 | 4.4 | CNL 1, NL 1, TNL 13, RLK 9, RLP 2 | 7 variable, 19 core (73% core) |
| qLR10‐3 (SWUC177 ‐ BoGMS1032) | Sclerotinia sclerotiorum | Mei et al. (2013) | C7 | 12.1 | 46.7 | 34.6 | CN 3, CNL 4, NBS 3, NL 7, OTHER 4, TN 2, TNL 13, TX 14, RLK 85, RLP 3 | 16 variable, 122 core (88.5% core) |
| qLR10‐6 (Ol10D08 ‐ SWUC731) | Sclerotinia sclerotiorum | Mei et al. (2013) | C9 | 3.8 | 4.2 | 0.5 | RLK 1, RLP 2 | 2 variable, 1 core (33% core) |
| qLR09‐6 (SWUC731 ‐ SWUC700) | Sclerotinia sclerotiorum | Mei et al. (2013) | C9 | 3.8 | 4.4 | 0.7 | RLK 3, RLP 2 | 2 variable, 3 core (60% core) |
| qSR10‐4 (SWUC711 ‐ SWUC700) | Sclerotinia sclerotiorum | Mei et al. (2013) | C9 | 4.2 | 4.4 | 0.2 | RLK 2 | 2 core (100% core) |
| qLR09‐5 (SWUC658 ‐ SWUC635) | Sclerotinia sclerotiorum | Mei et al. (2013) | C9 | 6.3 | 7.3 | 1 | CNL 1, NL 1, RLP 1 | 3 core (100% core) |
| qLR10‐5 (SWUC679 ‐ SWUC635) | Sclerotinia sclerotiorum | Mei et al. (2013) | C9 | 6.8 | 7.3 | 0.5 | N/A | N/A |
| CRQTL‐GN_1 (comp7993 ‐ BoRSdcaps2‐10) | Clubroot | Lee et al. (2016) | C2 | 13.5 | 43.5 | 30 | CN 2, NBS 3, NL 2, OTHER 1, TN 5, TNL 10, TX 7, RLK 37, RLP 9 | 7 variable, 69 core (91% core) |
| CRQTL‐GN_2 (BoRSdcaps3‐2 ‐ BoRSdcaps3‐4) | Clubroot | Lee et al. (2016) | C3 | 0.8 | 5.5 | 4.7 | TN 1, TNL 6, TX 2, RLK 10, RLP 3 | 7 variable, 15 core (68% core) |
The majority of the 59 RGA candidates in smaller QTL linked with Sclerotinia, black rot, and clubroot are present in all lines (43 core, 16 variable) indicating that these resistances show stable inheritance, which make them valuable targets for plant breeders. The RGA classes showed different levels of variability—27 of the 28 RLKs were core with only one RLK being variable, while 10 TNLs were variable with nine TNLs being present in all lines, indicating that RLKs are more stable than TNLs. A waterfall plot of the Sclerotinia resistance‐linked QTL qLR10‐3 (SWUC177 ‐ BoGMS1032) was produced to show the mutational load of RGA candidates located within the QTL candidate region in all 10 individuals (Figure 4). As expected, B. macrocarpa showed the highest mutational load. Two genes (Bo7g107710 and Bo7g073830) showed mis‐sense variants in almost all individuals. Very few low impact variants such as synonymous variants were observed in this QTL with the majority of variants being mis‐sense. Variants resulting in lost stop codons were always shared in at least two individuals indicating that this mutation is not random. The large number of mis‐sense variants indicates that this QTL region is under positive selection pressure.
Figure 4.
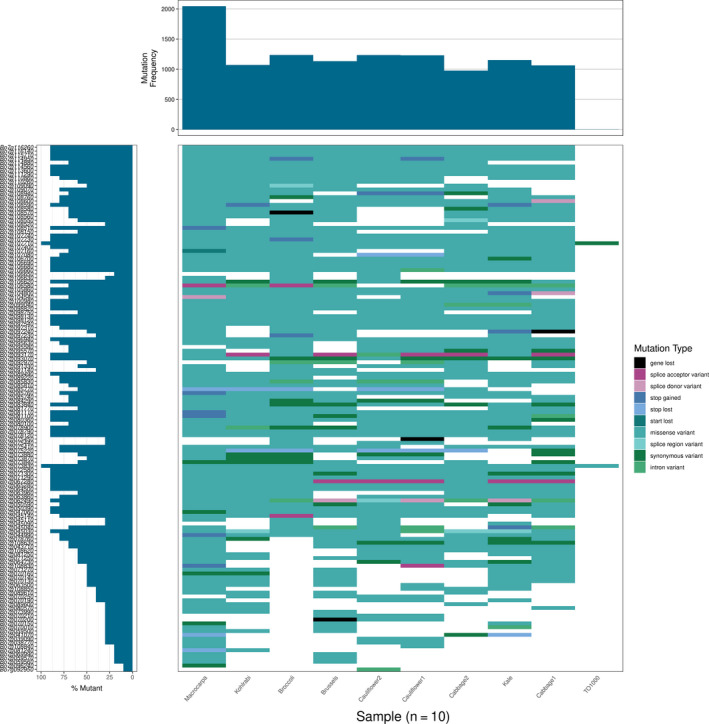
Waterfall plot of the Sclerotinia resistance‐linked QTL qLR10‐3 (SWUC177 ‐ BoGMS1032). Gene order is determined by position in the reference assembly.
We have shown that there is a large amount of SNP and PAV variability within this QTL region, with some genes being completely lost in a few individuals. Pinpointing the actual cause of resistance will require looking at all aspects of variability in this region in several diverse individuals.
Linking known R‐genes
Lv et al. (2014) reported the TNL Fusarium wilt resistance gene FOC1 to be Bol037156 on pseudomolecule C7 (38.8 Mbp) in B. oleracea in the first B. oleracea annotation (Liu et al., 2014). The short LRR‐domain carrying Bol037156 was re‐annotated into a longer version named ‘re‐Bol037156’ carrying TIR‐NBS‐LRR domains, which segregated as expected in a resistant and susceptible population. We used blastp to search for Bol037156 in the current v2.1 B. oleracea assembly and found the best hit in Bo7g104800 on pseudomolecule C7 (score: 325, e‐value 1e−102). In the new v2.1 results, this gene is a much longer TNL (2646 amino acids compared with the original 203 amino acids) indicating that in the Liu et al. (2014) assembly this gene annotated incorrectly. This fits with the longer, but possibly still too short 1.3 kaa reassembly of re‐ Bol037156 presented in (Lv et al., 2014) and indicates that the gene was assembled correctly in v2.1.
Of the 17 FOC1 linked markers, 13 map to C7 from 40.0 to 42.9 Mbp, which supports the notion of Bo7g104800 being FOC1, since Bo7g104800 is located at 40.3 Mbp on C7. Bo7g104800 is present in all 10 lines, however SNPs introduced premature stop codons in ARS_18 (Kale) and Badger Inbred 16 (Cabbage1) which suggests loss of function and subsequent Fusarium wilt susceptibility.
The 34.6 Mbp QTL qLR10‐3 for Sclerotinia resistance also contains Bo7g104800. In the light of no published literature linking Sclerotinia resistance and Fusarium wilt resistance it is more likely that this overlap is accidental due to the large QTL region.
Conclusions
Here we have described different modes of selection in RGA candidates in B. oleracea. We showed different selection pressures acting on SNPs and PAV for different RGA classes in B. oleracea, especially for RLKs and TNs. We have also observed that genes within physical clusters are more likely to be variable, and that similar copies of the same RGAs are retained with a rate of around 80%. We show that there are two mechanisms operating separately from each other in B. oleracea that generate diversity in RGAs—one via SNPs and one via PAVs. We have identified 37 RGA candidates within QTL regions associated with Sclerotinia and black rot resistance, and these candidates may inform future breeding efforts in B. oleracea. We have identified RGA candidates in the pangenome which are not present in the single reference assembly, showing that a pangenome is required to describe the full extent of genes present in the species, as well as necessary for candidate gene identification for breeding of improved cultivars.
Experimental procedures
The RGAugury pipeline (version 2017‐10‐21; Li et al., 2016) was used to predict NBS, RLK, and RLP candidate genes in the B. oleracea TO1000 v2.1 annotation downloaded from Ensembl Genomes Release 37 (Kersey et al., 2017; Parkin et al., 2014) as well as in the B. oleracea pangenome downloaded from (http://brassicagenome.net) (Golicz et al., 2016). PAV, TE and SNP data for the B. oleracea genome and pangenome extra contigs were downloaded from http://brassicagenome.net.
NBS‐LRR were classified based on presence or absence of specific domains: Proteins carrying only an NB‐ARC domain were classified as NBS, proteins carrying TIR, NB‐ARC, and Leucine‐Rich‐Repeat domains were classified as TNLs, or TN if the Leucine‐Rich‐Repeat domain was missing. Proteins carrying Coils, NB‐ARC, and Leucine‐Rich‐Repeat domains were classified as CNLs, or CN if the Leucine‐Rich‐Repeat domain was missing, or NL if the Coils domain was missing. Proteins carrying a TIR domain with additionally unknown domains were classified as TX, while proteins carrying TIR and Coils but not NB‐ARC domains were classified as OTHER.
Resistance genes‐analog candidates were clustered into sequence‐based clusters using CD‐HIT v4.6.8‐2017‐1208 (minimum identity c: 0.7; Li and Godzik, 2006). Multiple sequence alignments of each cluster were drawn using MUSCLE v3.8.1551 (Edgar, 2004) and BOXSHADE v3.21 (https://embnet.vital-it.ch/software/BOX_form.html).
The R‐package regioneR v1.8 (Gel et al., 2016; R Core Team, 2016) was used to test resistance genes and genes exhibiting PAV and transposable elements for association using 500 permutations. For PAV association, the evaluation function numOverlaps was used to check whether the number of gene overlaps is higher than expected. For TE association, the evaluation function meanDistance was used since we do not expect TEs to overlap with RGA candidates due to repeats having been masked during the annotation process. The R‐package karyotypeR v1.2.2 (Gel and Serra, 2017) was used to plot gene densities.
Resistance genes‐analog‐gene‐rich‐physical clusters were mined from the genome by comparing all resistance gene candidates located on pseudomolecules. Resistance gene candidates were merged into RGA‐gene‐rich clusters if there was at least one other resistance gene within 10 upstream or 10 downstream genes using a Python 3 script (makeRGeneClusterAnalysis.py). Physical clusters and presence/absence status was compared using Pearson's Chi‐squared test with Yates’ continuity correction as implemented in R v3.4.2 (R Core Team, 2016).
The SNPs called by (Golicz et al., 2016; available at http://brassicagenome.net/databases.php) were compared with the RGAs using SnpEff v4.3T (Cingolani et al., 2012). Since there were more core than variable genes and since core genes were longer than variable genes (Golicz et al., 2016) the counts of low, moderate, and high impact SNPs were normalised by dividing by the total length of all exons per gene in order to account for very long and very short genes. Two‐way ANOVA as implemented in R v3.4.2 (R Core Team, 2016) was used to check whether the variation in low, moderate, high, and upstream and downstream variants could be explained by the presence/absence status or by the RGA class.
Known Sclerotinia, clubroot and black rot resistance‐linked QTLs were collected from (Kifuji et al., 2013; Lee et al., 2015, 2016; Mei et al., 2013) and 49 marker sequences were collected from (Iniguez‐Luy et al., 2009; Izzah et al., 2014; Lee et al., 2015; Li et al., 2015; Lowe et al., 2002, 2004; Mei et al., 2013; Piquemal et al., 2005; Qu et al., 2012; Sampath et al., 2013, 2014). BLAST blastn (Camacho et al., 2009; task: blastn‐short, e‐value: 0.05) was used to assign positions for the forward and reverse primer sequences in the v2.1 B. oleracea assembly. Forward and reverse pairs not mapping on the same pseudomolecule or mapping at more than 20 positions were removed. Gene and QTL region overlap was determined using bedtools v2.27.1 intersect (Quinlan and Hall, 2010). Markers linked with FOC1 were collected from (Lv et al., 2014). All marker sequences are available in Table S3. Waterfall plots were drawn using Variant Effect Predictor v88.13 (McLaren et al., 2016), GenVisR v1.11.3 (Skidmore et al., 2016), vcftools v0.1.15 (Danecek et al., 2011) and R 3.4.4 (R Core Team, 2016).
Alternative transcripts of Bo7g104800/FOC1 were produced by subsetting VCF files using bcftools v1.7 view (Li, 2011), creating alternative references using GATK 3.8‐1‐0 FastaAlternateReferenceMaker (McKenna et al., 2010), by predicting the amino acid sequences using genometools v1.5.9 (Gremme et al., 2013), and then manually removing sequence after the premature stop codon. The domains of the alternative transcripts were predicted using Interproscan v5.29‐68 (Jones et al., 2014) using Pfam 31.0 and COILS.
Conflict of interest
The authors have no conflicts of interest to declare.
Supporting information
Figure S1 Multiple sequence alignment (MUSCLE) showing all seven RLKs contained in the largest RGA candidate cluster 0.
Figure S2 Expected (Evperm) and observed (Evobs) overlaps between RLK genes and PAV genes showing that the observed overlap is smaller than expected.
Figure S3 Local Z‐score plot for NBS genes associated with PA based on random shuffling of positions.
Figure S4 Expected (Evperm) and observed (Evobs) average distance between PAV genes and TEs.
Figure S5 Z‐score of the association in the mean distance between PAV genes and TE genes after randomly shuffling gene positions.
Figure S6 High impact, moderate impact and low impact SNPs per base pair compared with RGA class and presence/absence status.
Table S1 List of R‐genes and their classes.
Table S2 P‐values and Z‐scores as reported by regioneR between R‐gene candidates, PAV genes and TEs.
Table S3 Markers linked with QTLs in the literature, their forward and reverse sequence and citation, and their position in the B. oleracea v2.1 TO1000DH assembly (Parkin et al., 2014).
Acknowledgements
We thank Dr. Bernat Gel for his helpful comments on the usage of regioneR and interpretation of Z‐scores, and Dr. Robert Syme for his help with genometools. This work was supported by resources provided by the Pawsey Supercomputing Centre with funding from the Australian Government and the Government of Western Australia. Dr. Philipp Bayer acknowledges the support of the Forrest Research Foundation.
Data availability
All data used in this study were previously published in (Golicz et al., 2016) and are available at http://brassicagenome.net/databases.php. Code produced for this study is available at http://github.com/appliedbioinformatics/B_oleracea_R_genes_supplementary
References
- Adams, K.L. , Cronn, R. , Percifield, R. and Wendel, J.F. (2003) Genes duplicated by polyploidy show unequal contributions to the transcriptome and organ‐specific reciprocal silencing. Proc. Natl. Acad. Sci. USA, 100, 4649–4654. [DOI] [PMC free article] [PubMed] [Google Scholar]
- Alamery, S. , Tirnaz, S. , Bayer, P. , Tollenaere, R. , Chaloub, B. , Edwards, D. and Batley, J. (2018) Genome‐wide identification and comparative analysis of NBS‐LRR resistance genes in Brassica napus . Crop Pasture Sci. 69, 72–93. [Google Scholar]
- Ameline‐Torregrosa, C. , Wang, B.‐B. , O'Bleness, M.S. , Deshpande, S. , Zhu, H. , Roe, B. , Young, N.D. et al. (2008) Identification and characterization of nucleotide‐binding site‐leucine‐rich repeat genes in the model plant Medicago truncatula . Plant Physiol. 146, 5–21. [DOI] [PMC free article] [PubMed] [Google Scholar]
- Bakker, E.G. , Toomajian, C. , Kreitman, M. and Bergelson, J. (2006) A genome‐wide survey of R gene polymorphisms in Arabidopsis . Plant Cell, 18, 1803–1818. [DOI] [PMC free article] [PubMed] [Google Scholar]
- Baumgarten, A. , Cannon, S. , Spangler, R. and May, G. (2003) Genome‐level evolution of resistance genes in Arabidopsis thaliana. Genetics 165, 309–319. [DOI] [PMC free article] [PubMed] [Google Scholar]
- Bergelson, J. , Kreitman, M. , Stahl, E.A. and Tian, D. (2001) Evolutionary dynamics of plant R‐genes. Science, 292, 2281–2285. [DOI] [PubMed] [Google Scholar]
- Camacho, C. , Coulouris, G. , Avagyan, V. , Ma, N. , Papadopoulos, J. , Bealer, K. and Madden, T.L. (2009) BLAST+: architecture and applications. BMC Bioinformatics, 10, 421. [DOI] [PMC free article] [PubMed] [Google Scholar]
- Chalhoub, B. , Denoeud, F. , Liu, S. , Parkin, I.A.P. , Tang, H. , Wang, X. , Chiquet, J. et al. (2014) Early allopolyploid evolution in the post‐Neolithic Brassica napus oilseed genome. Science, 345, 950–953. [DOI] [PubMed] [Google Scholar]
- Channon, A. (1981) Downy mildew of Brassicas . In The Downy Mildews ( Spencer, D.M. , ed.), pp. 321–339. London: Academic Press. [Google Scholar]
- Chen, J.Y. , Huang, J.Q. , Li, N.Y. , Ma, X.F. , Wang, J.L. , Liu, C. , Liu, Y.F. et al. (2015) Genome‐wide analysis of the gene families of resistance gene analogues in cotton and their response to Verticillium wilt. BMC Plant Biol. 15, 148. [DOI] [PMC free article] [PubMed] [Google Scholar]
- Cingolani, P. , Platts, A. , le Wang, L. , Coon, M. , Nguyen, T. , Wang, L. , Land, S.J. et al. (2012) A program for annotating and predicting the effects of single nucleotide polymorphisms, SnpEff: SNPs in the genome of Drosophila melanogaster strain w1118; iso‐2; iso‐3. Fly, 6, 80–92. [DOI] [PMC free article] [PubMed] [Google Scholar]
- Danecek, P. , Auton, A. , Abecasis, G. , Albers, C.A. , Banks, E. , DePristo, M.A. , Handsaker, R.E. et al. (2011) The variant call format and VCFtools. Bioinformatics, 27, 2156–2158. [DOI] [PMC free article] [PubMed] [Google Scholar]
- Dangl, J.L. and Jones, J.D. (2001) Plant pathogens and integrated defence responses to infection. Nature 411, 826–833. [DOI] [PubMed] [Google Scholar]
- Delourme, R. , Pilet‐Nayel, M.L. , Archipiano, M. , Horvais, R. , Tanguy, X. , Rouxel, T. , Brun, H. et al. (2004) A cluster of major specific resistance genes to Leptosphaeria maculans in Brassica napus . Phytopathology, 94, 578–583. [DOI] [PubMed] [Google Scholar]
- Edgar, R.C. (2004) MUSCLE: multiple sequence alignment with high accuracy and high throughput. Nucleic Acids Res. 32, 1792–1797. [DOI] [PMC free article] [PubMed] [Google Scholar]
- Fritz‐Laylin, L.K. , Krishnamurthy, N. , Tor, M. , Sjolander, K.V. and Jones, J.D. (2005) Phylogenomic analysis of the receptor‐like proteins of rice and Arabidopsis . Plant Physiol. 138, 611–623. [DOI] [PMC free article] [PubMed] [Google Scholar]
- Gel, B. and Serra, E. (2017) karyoploteR: an R/Bioconductor package to plot customizable genomes displaying arbitrary data. Bioinformatics, 33, 3088–3090. [DOI] [PMC free article] [PubMed] [Google Scholar]
- Gel, B. , Diez‐Villanueva, A. , Serra, E. , Buschbeck, M. , Peinado, M.A. and Malinverni, R. (2016) regioneR: an R/Bioconductor package for the association analysis of genomic regions based on permutation tests. Bioinformatics, 32, 289–291. [DOI] [PMC free article] [PubMed] [Google Scholar]
- Golicz, A.A. , Bayer, P.E. , Barker, G.C. , Edger, P.P. , Kim, H. , Martinez, P.A. , Chan, C.K.K. et al. (2016) The pangenome of an agronomically important crop plant Brassica oleracea . Nat. Commun. 7, 13390. [DOI] [PMC free article] [PubMed] [Google Scholar]
- Gremme, G. , Steinbiss, S. and Kurtz, S. (2013) GenomeTools: a comprehensive software library for efficient processing of structured genome annotations. IEEE/ACM Trans. Comput. Biol. Bioinf. 10, 645–656. [DOI] [PubMed] [Google Scholar]
- Gu, L. , Si, W. , Zhao, L. , Yang, S. and Zhang, X. (2015) Dynamic evolution of NBS–LRR genes in bread wheat and its progenitors. Mol. Genet. Genomics, 290, 727–738. [DOI] [PubMed] [Google Scholar]
- Guo, Y.L. , Fitz, J. , Schneeberger, K. , Ossowski, S. , Cao, J. and Weigel, D. (2011) Genome‐wide comparison of nucleotide‐binding site‐leucine‐rich repeat‐encoding genes in Arabidopsis . Plant Physiol. 157, 757–769. [DOI] [PMC free article] [PubMed] [Google Scholar]
- Hammond‐Kosack, K.E. and Jones, J.D. (1996) Resistance gene‐dependent plant defense responses. The Plant Cell 8, 1773–1791. [DOI] [PMC free article] [PubMed] [Google Scholar]
- Hayashi, K. and Yoshida, H. (2009) Refunctionalization of the ancient rice blast disease resistance gene Pit by the recruitment of a retrotransposon as a promoter. Plant J. 57, 413–425. [DOI] [PubMed] [Google Scholar]
- Hulbert, S.H. , Webb, C.A. , Smith, S.M. and Sun, Q. (2001) Resistance gene complexes: evolution and utilization. Annu. Rev. Phytopathol. 39, 285–312. [DOI] [PubMed] [Google Scholar]
- Iniguez‐Luy, F.L. , Lukens, L. , Farnham, M.W. , Amasino, R.M. and Osborn, T.C. (2009) Development of public immortal mapping populations, molecular markers and linkage maps for rapid cycling Brassica rapa and B. oleracea . Theor. Appl. Genet. 120, 31–43. [DOI] [PubMed] [Google Scholar]
- Izzah, N.K. , Lee, J. , Jayakodi, M. , Perumal, S. , Jin, M. , Park, B.S. , Ahn, K. et al. (2014) Transcriptome sequencing of two parental lines of cabbage (Brassica oleracea L. var. capitata L.) and construction of an EST‐based genetic map. BMC Genom. 15, 149. [DOI] [PMC free article] [PubMed] [Google Scholar]
- Jones, J.D. and Dangl, J.L. (2006) The plant immune system. Nature, 444, 323–329. [DOI] [PubMed] [Google Scholar]
- Jones, P. , Binns, D. , Chang, H.Y. , Fraser, M. , Li, W. , McAnulla, C. , McWilliam, H. et al. (2014) InterProScan 5: genome‐scale protein function classification. Bioinformatics, 30, 1236–1240. [DOI] [PMC free article] [PubMed] [Google Scholar]
- Jupe, F. , Pritchard, L. , Etherington, G.J. , MacKenzie, K. , Cock, P.J. , Wright, F. , Sharma, S.K. et al. (2012) Identification and localisation of the NB‐LRR gene family within the potato genome. BMC Genom. 13, 75. [DOI] [PMC free article] [PubMed] [Google Scholar]
- Jupe, F. , Witek, K. , Verweij, W. , Sliwka, J. , Pritchard, L. , Etherington, G.J. , Maclean, D. et al. (2013) Resistance gene enrichment sequencing (RenSeq) enables reannotation of the NB‐LRR gene family from sequenced plant genomes and rapid mapping of resistance loci in segregating populations. Plant J. 76, 530–544. [DOI] [PMC free article] [PubMed] [Google Scholar]
- Kang, Y.J. , Kim, K.H. , Shim, S. , Yoon, M.Y. , Sun, S. , Kim, M.Y. , Van, K. et al. (2012) Genome‐wide mapping of NBS‐LRR genes and their association with disease resistance in soybean. BMC Plant Biol. 12, 1–13. [DOI] [PMC free article] [PubMed] [Google Scholar]
- Kato, T. , Hatakeyama, K. , Fukino, N. and Matsumoto, S. (2013) Fine mapping of the clubroot resistance gene CRb and development of a useful selectable marker in Brassica rapa . Breed. Sci. 63, 116–124. [DOI] [PMC free article] [PubMed] [Google Scholar]
- Kawchuk, L.M. , Hachey, J. , Lynch, D.R. , Kulcsar, F. , van Rooijen, G. , Waterer, D.R. , Robertson, A. et al. (2001) Tomato Ve disease resistance genes encode cell surface‐like receptors. Proc. Natl. Acad. Sci. USA, 98, 6511–6515. [DOI] [PMC free article] [PubMed] [Google Scholar]
- Kersey, P.J. , Allen, J.E. , Allot, A. , Barba, M. , Boddu, S. , Bolt, B.J. , Carvalho‐Silva, D. et al. (2017) Ensembl Genomes 2018: an integrated omics infrastructure for non‐vertebrate species. Nucleic Acids Res. 46, D802–D808. [DOI] [PMC free article] [PubMed] [Google Scholar]
- Kifuji, Y. , Hanzawa, H. , Terasawa, Y. and Nishio, T. (2013) QTL analysis of black rot resistance in cabbage using newly developed EST‐SNP markers. Euphytica 190, 289–295. [Google Scholar]
- Kruijt, M. , De Kock, M.J. and de Wit, P.J. (2005) Receptor‐like proteins involved in plant disease resistance. Mol. Plant Pathol. 6, 85–97. [DOI] [PubMed] [Google Scholar]
- Lai, J. , Li, Y. , Messing, J. and Dooner, H.K. (2005) Gene movement by Helitron transposons contributes to the haplotype variability of maize. Proc. Natl. Acad. Sci. USA, 102, 9068–9073. [DOI] [PMC free article] [PubMed] [Google Scholar]
- Lee, J. , Izzah, N.K. , Jayakodi, M. , Perumal, S. , Joh, H.J. , Lee, H.J. , Lee, S.C. et al. (2015) Genome‐wide SNP identification and QTL mapping for black rot resistance in cabbage. BMC Plant Biol. 15, 32. [DOI] [PMC free article] [PubMed] [Google Scholar]
- Lee, J. , Izzah, N.K. , Choi, B.S. , Joh, H.J. , Lee, S.C. , Perumal, S. , Seo, J. et al. (2016) Genotyping‐by‐sequencing map permits identification of clubroot resistance QTLs and revision of the reference genome assembly in cabbage (Brassica oleracea L.). DNA Res. 23, 29–41. [DOI] [PMC free article] [PubMed] [Google Scholar]
- Li, H. (2011) A statistical framework for SNP calling, mutation discovery, association mapping and population genetical parameter estimation from sequencing data. Bioinformatics, 27, 2987–2993. [DOI] [PMC free article] [PubMed] [Google Scholar]
- Li, W. and Godzik, A. (2006) Cd‐hit: a fast program for clustering and comparing large sets of protein or nucleotide sequences. Bioinformatics, 22, 1658–1659. [DOI] [PubMed] [Google Scholar]
- Li, N. , Peng, W. , Shi, J. , Wang, X. , Liu, G. and Wang, H. (2015) The natural variation of seed weight is mainly controlled by maternal genotype in rapeseed (Brassica napus L.). PLoS ONE, 10, e0125360. [DOI] [PMC free article] [PubMed] [Google Scholar]
- Li, P. , Quan, X. , Jia, G. , Xiao, J. , Cloutier, S. and You, F.M. (2016) RGAugury: a pipeline for genome‐wide prediction of resistance gene analogs (RGAs) in plants. BMC Genom. 17, 852. [DOI] [PMC free article] [PubMed] [Google Scholar]
- Li, Y. , Wei, W. , Feng, J. , Luo, H. , Pi, M. , Liu, Z. and Kang, C. (2017) Genome re‐annotation of the wild strawberry Fragaria vesca using extensive Illumina‐and SMRT‐based RNA‐seq datasets. DNA Res. 25, 61–70. [DOI] [PMC free article] [PubMed] [Google Scholar]
- Liebrand, T.W. , van den Berg, G.C. , Zhang, Z. , Smit, P. , Cordewener, J.H. , America, A.H. , Sklenar, J. et al. (2013) Receptor‐like kinase SOBIR1/EVR interacts with receptor‐like proteins in plant immunity against fungal infection. Proc. Natl. Acad. Sci. USA, 110, 10010–10015. [DOI] [PMC free article] [PubMed] [Google Scholar]
- Liu, S. , Liu, Y. , Yang, X. , Tong, C. , Edwards, D. , Parkin, I.A. , Zhao, M. et al. (2014) The Brassica oleracea genome reveals the asymmetrical evolution of polyploid genomes. Nat. Commun. 5, 3930. [DOI] [PMC free article] [PubMed] [Google Scholar]
- Lowe, A.J. , Jones, A.E. , Raybould, A.F. , Trick, M. , Moule, C.L. and Edwards, K.J. (2002) Transferability and genome specificity of a new set of microsatellite primers among Brassica species of the U triangle. Mol. Ecol. Resour. 2, 7–11. [Google Scholar]
- Lowe, A.J. , Moule, C. , Trick, M. and Edwards, K.J. (2004) Efficient large‐scale development of microsatellites for marker and mapping applications in Brassica crop species. Theor. Appl. Genet. 108, 1103–1112. [DOI] [PubMed] [Google Scholar]
- Lozano, R. , Ponce, O. , Ramirez, M. , Mostajo, N. and Orjeda, G. (2012) Genome‐wide identification and mapping of NBS‐encoding resistance genes in Solanum tuberosum Group Phureja. PLoS ONE, 7, e34775. [DOI] [PMC free article] [PubMed] [Google Scholar]
- Lozano, R. , Hamblin, M.T. , Prochnik, S. and Jannink, J.‐L. (2015) Identification and distribution of the NBS‐LRR gene family in the Cassava genome. BMC Genom. 16, 360. [DOI] [PMC free article] [PubMed] [Google Scholar]
- Lv, H. , Fang, Z. , Yang, L. , Zhang, Y. , Wang, Q. , Liu, Y. , Zhuang, M. et al. (2014) Mapping and analysis of a novel candidate Fusarium wilt resistance gene FOC1 in Brassica oleracea . BMC Genom. 15, 1094. [DOI] [PMC free article] [PubMed] [Google Scholar]
- Lv, S. , Changwei, Z. , Tang, J. , Li, Y. , Wang, Z. , Jiang, D. and Hou, X. (2015) Genome‐wide analysis and identification of TIR‐NBS‐LRR genes in Chinese cabbage (Brassica rapa ssp. pekinensis) reveal expression patterns to TuMV infection. Physiol. Mol. Plant Pathol. 90, 89–97. [Google Scholar]
- Marchal, C. , Zhang, J. , Zhang, P. , Fenwick, P. , Steuernagel, B. , Adamski, N.M. , Boyd, L. et al. (2018) BED‐domain containing immune receptors confer diverse resistance spectra to yellow rust. bioRxiv, 299651. [DOI] [PubMed] [Google Scholar]
- Masson, P. , Surosky, R. , Kingsbury, J.A. and Fedoroff, N.V. (1987) Genetic and molecular analysis of the Spm‐dependent a‐m2 alleles of the maize a locus. Genetics, 117, 117–137. [DOI] [PMC free article] [PubMed] [Google Scholar]
- McClintock, B. (1956) Controlling elements and the gene. Cold Spring Harb. Symp. Quant. Biol. 21, 197–216. [DOI] [PubMed] [Google Scholar]
- McHale, L. , Tan, X. , Koehl, P. and Michelmore, R.W. (2006) Plant NBS‐LRR proteins: adaptable guards. Genome Biol. 7, 212. [DOI] [PMC free article] [PubMed] [Google Scholar]
- McKenna, A. , Hanna, M. , Banks, E. , Sivachenko, A. , Cibulskis, K. , Kernytsky, A. , Garimella, K. et al. (2010) The Genome Analysis Toolkit: a MapReduce framework for analyzing next‐generation DNA sequencing data. Genome Res. 20, 1297–1303. [DOI] [PMC free article] [PubMed] [Google Scholar]
- McLaren, W. , Gil, L. , Hunt, S.E. , Riat, H.S. , Ritchie, G.R. , Thormann, A. , Flicek, P. et al. (2016) The Ensembl variant effect predictor. Genome Biol. 17, 122. [DOI] [PMC free article] [PubMed] [Google Scholar]
- Mei, J. , Ding, Y. , Lu, K. , Wei, D. , Liu, Y. , Disi, J.O. , Li, J. et al. (2013) Identification of genomic regions involved in resistance against Sclerotinia sclerotiorum from wild Brassica oleracea . Theor. Appl. Genet. 126, 549–556. [DOI] [PubMed] [Google Scholar]
- Meyers, B. , Dickerman, A. , Michelmore, R. , Sivaramakrishnan, S. , Sobral, B. and Young, N. (1999) Plant disease resistance genes encode members of an ancient and diverse protein family within the nucleotide‐binding superfamily. Plant J. 20, 317–332. [DOI] [PubMed] [Google Scholar]
- Meyers, B.C. , Kozik, A. , Griego, A. , Kuang, H. and Michelmore, R.W. (2003) Genome‐wide analysis of NBS‐LRR–encoding genes in Arabidopsis . Plant Cell, 15, 809–834. [DOI] [PMC free article] [PubMed] [Google Scholar]
- Michelmore, R.W. and Meyers, B.C. (1998) Clusters of resistance genes in plants evolve by divergent selection and a birth‐and‐death process. Genome Res. 8, 1113–1130. [DOI] [PubMed] [Google Scholar]
- Morris, E.R. and Walker, J.C. (2003) Receptor‐like protein kinases: the keys to response. Curr. Opin. Plant Biol. 6, 339–342. [DOI] [PubMed] [Google Scholar]
- Mun, J.‐H. , Yu, H.‐J. , Park, S. and Park, B.‐S. (2009) Genome‐wide identification of NBS‐encoding resistance genes in Brassica rapa . Mol. Genet. Genomics, 282, 617–631. [DOI] [PMC free article] [PubMed] [Google Scholar]
- Neik, T.X. , Barbetti, M.J. and Batley, J. (2017) Current status and challenges in identifying disease resistance genes in Brassica napus . Front. Plant Sci. 8, 1788. [DOI] [PMC free article] [PubMed] [Google Scholar]
- Orr, H.A. (1996) Dobzhansky, Bateson, and the genetics of speciation. Genetics, 144, 1331–1335. [DOI] [PMC free article] [PubMed] [Google Scholar]
- Parkin, I.A. , Koh, C. , Tang, H. , Robinson, S.J. , Kagale, S. , Clarke, W.E. , Town, C.D. et al. (2014) Transcriptome and methylome profiling reveals relics of genome dominance in the mesopolyploid Brassica oleracea . Genome Biol. 15, R77. [DOI] [PMC free article] [PubMed] [Google Scholar]
- Petre, B. , Hacquard, S. , Duplessis, S. and Rouhier, N. (2014) Genome analysis of poplar LRR‐RLP gene clusters reveals RISP, a defense‐related gene coding a candidate endogenous peptide elicitor. Front. Plant Sci. 5, 111. [DOI] [PMC free article] [PubMed] [Google Scholar]
- Piquemal, J. , Cinquin, E. , Couton, F. , Rondeau, C. , Seignoret, E. , Doucet, I. , Perret, D. et al. (2005) Construction of an oilseed rape (Brassica napus L.) genetic map with SSR markers. Theor. Appl. Genet. 111, 1514–1523. [DOI] [PubMed] [Google Scholar]
- Punithalingham, E. and Holliday, P. (1972) Leptosphaeria maculans. CMI descriptions of pathogenic fungi and bacteria.
- Qu, C. , Hasan, M. , Lu, K. , Liu, L. , Liu, X. , Xie, J. , Wang, M. et al. (2012) Genetic diversity and relationship analysis of the Brassica napus germplasm using simple sequence repeat (SSR) markers. Afr. J. Biotech. 11, 6923–6933. [Google Scholar]
- Quinlan, A.R. and Hall, I.M. (2010) BEDTools: a flexible suite of utilities for comparing genomic features. Bioinformatics, 26, 841–842. [DOI] [PMC free article] [PubMed] [Google Scholar]
- R Core Team (2016) R: A Language and Environment for Statistical Computing. Vienna, Austria: R Foundation for Statistical Computing. [Google Scholar]
- Rice Chromosomes 11 and 12 Sequencing Consortia (2005) The sequence of rice chromosomes 11 and 12, rich in disease resistance genes and recent gene duplications. BMC Biol. 3, 20. [DOI] [PMC free article] [PubMed] [Google Scholar]
- Sampath, P. , Lee, S.C. , Lee, J. , Izzah, N.K. , Choi, B.S. , Jin, M. , Park, B.S. et al. (2013) Characterization of a new high copy Stowaway family MITE, BRAMI‐1 in Brassica genome. BMC Plant Biol. 13, 56. [DOI] [PMC free article] [PubMed] [Google Scholar]
- Sampath, P. , Murukarthick, J. , Izzah, N.K. , Lee, J. , Choi, H.I. , Shirasawa, K. , Choi, B.S. et al. (2014) Genome‐wide comparative analysis of 20 miniature inverted‐repeat transposable element families in Brassica rapa and B. oleracea . PLoS ONE, 9, e94499. [DOI] [PMC free article] [PubMed] [Google Scholar]
- Sanseverino, W. , Henaff, E. , Vives, C. , Pinosio, S. , Burgos‐Paz, W. , Morgante, M. , Ramos‐Onsins, S.E. et al. (2015) Transposon insertions, structural variations, and SNPs contribute to the evolution of the melon genome. Mol. Biol. Evol. 32, 2760–2774. [DOI] [PubMed] [Google Scholar]
- Sarris, P.F. , Cevik, V. , Dagdas, G. , Jones, J.D.G. and Krasileva, K.V. (2016) Comparative analysis of plant immune receptor architectures uncovers host proteins likely targeted by pathogens. BMC Biol. 14, 8. [DOI] [PMC free article] [PubMed] [Google Scholar]
- Sekhwal, M.K. , Li, P. , Lam, I. , Wang, X. , Cloutier, S. and You, F.M. (2015) Disease resistance gene analogs (RGAs) in plants. Int. J. Mol. Sci. 16, 19248–19290. [DOI] [PMC free article] [PubMed] [Google Scholar]
- Seo, E. , Kim, S. , Yeom, S.‐I. and Choi, D. (2016) Genome‐wide comparative analyses reveal the dynamic evolution of nucleotide‐binding leucine‐rich repeat gene family among Solanaceae plants. Front. Plant Sci. 7, 1205. [DOI] [PMC free article] [PubMed] [Google Scholar]
- Shao, Z.‐Q. , Xue, J.‐Y. , Wu, P. , Zhang, Y.‐M. , Wu, Y. , Hang, Y.‐Y. , Wang, B. et al. (2016) Large‐scale analyses of angiosperm nucleotide‐binding site‐leucine‐rich repeat genes reveal three anciently diverged classes with distinct evolutionary patterns. Plant Physiol. 170, 2095–2109. [DOI] [PMC free article] [PubMed] [Google Scholar]
- Shen, J. , Araki, H. , Chen, L. , Chen, J.Q. and Tian, D. (2006) Unique evolutionary mechanism in R‐genes under the presence/absence polymorphism in Arabidopsis thaliana . Genetics, 172, 1243–1250. [DOI] [PMC free article] [PubMed] [Google Scholar]
- Singh, S. , Chand, S. , Singh, N.K. and Sharma, T.R. (2015) Genome‐wide distribution, organisation and functional characterization of disease resistance and defence response genes across rice species. PLoS ONE, 10, e0125964. [DOI] [PMC free article] [PubMed] [Google Scholar]
- Skidmore, Z.L. , Wagner, A.H. , Lesurf, R. , Campbell, K.M. , Kunisaki, J. , Griffith, O.L. and Griffith, M. (2016) GenVisR: genomic visualizations in R. Bioinformatics, 32, 3012–3014. [DOI] [PMC free article] [PubMed] [Google Scholar]
- Song, W.Y. , Pi, L.Y. , Wang, G.L. , Gardner, J. , Holsten, T. and Ronald, P.C. (1997) Evolution of the rice Xa21 disease resistance gene family. Plant Cell, 9, 1279–1287. [DOI] [PMC free article] [PubMed] [Google Scholar]
- Takayama, S. and Isogai, A. (2003) Molecular mechanism of self‐recognition in Brassica self‐incompatibility. J. Exp. Bot. 54, 149–156. [DOI] [PubMed] [Google Scholar]
- Tan, S. , Zhong, Y. , Hou, H. , Yang, S. and Tian, D. (2012) Variation of presence/absence genes among Arabidopsis populations. BMC Evol. Biol. 12, 86. [DOI] [PMC free article] [PubMed] [Google Scholar]
- Taylor, A. , Rana, K. , Handy, C. and Clarkson, J. (2018) Resistance to Sclerotinia sclerotiorum in wild Brassica species and the importance of Sclerotinia subarctica as a Brassica pathogen. Plant. Pathol. 67, 433–444. [Google Scholar]
- The Plant List (2010) Version 1.1. Published on the Internet; http://www.theplantlist.org (accessed August 10, 2018).
- Tsuchiya, T. and Eulgem, T. (2013) An alternative polyadenylation mechanism coopted to the Arabidopsis RPP7 gene through intronic retrotransposon domestication. Proc. Natl. Acad. Sci. USA, 110, E3535–E3543. [DOI] [PMC free article] [PubMed] [Google Scholar]
- Voorrips, R.E. (1995) Plasmodiophora brassicae: aspects of pathogenesis and resistance in Brassica oleracea . Euphytica, 83, 139–146. [Google Scholar]
- Walker, J.C. (1994) Structure and function of the receptor‐like protein kinases of higher plants. Plant Mol. Biol. 26, 1599–1609. [DOI] [PubMed] [Google Scholar]
- Wan, H. , Yuan, W. , Ye, Q. , Wang, R. , Ruan, M. , Li, Z. , Zhou, G. et al. (2012) Analysis of TIR‐ and non‐TIR‐NBS‐LRR disease resistance gene analogous in pepper: characterization, genetic variation, functional divergence and expression patterns. BMC Genom. 13, 502. [DOI] [PMC free article] [PubMed] [Google Scholar]
- Wang, G. , Ellendorff, U. , Kemp, B. , Mansfield, J.W. , Forsyth, A. , Mitchell, K. , Bastas, K. et al. (2008) A genome‐wide functional investigation into the roles of receptor‐like proteins in Arabidopsis . Plant Physiol. 147, 503–517. [DOI] [PMC free article] [PubMed] [Google Scholar]
- Wei, F. , Wing, R.A. and Wise, R.P. (2002) Genome dynamics and evolution of the Mla (powdery mildew) resistance locus in barley. Plant Cell, 14, 1903–1917. [DOI] [PMC free article] [PubMed] [Google Scholar]
- Wei, H. , Li, W. , Sun, X. , Zhu, S. and Zhu, J. (2013) Systematic analysis and comparison of nucleotide‐binding site disease resistance genes in a diploid cotton Gossypium raimondii . PLoS ONE, 8, 1–13. [DOI] [PMC free article] [PubMed] [Google Scholar]
- Wu, P. , Shao, Z.‐Q. , Wu, X.‐Z. , Wang, Q. , Wang, B. , Chen, J.‐Q. , Hang, Y.‐Y. et al. (2014) Loss/retention and evolution of NBS‐encoding genes upon whole genome triplication of Brassica rapa . Gene, 540, 54–61. [DOI] [PubMed] [Google Scholar]
- Xiao, Z. , Hu, Y. , Zhang, X. , Xue, Y. , Fang, Z. , Yang, L. , Zhang, Y. et al. (2017) Fine mapping and transcriptome analysis reveal candidate genes associated with hybrid lethality in cabbage (Brassica oleracea). Genes, 8, 147. [DOI] [PMC free article] [PubMed] [Google Scholar]
- Yu, J. , Tehrim, S. , Zhang, F. , Tong, C. , Huang, J. , Cheng, X. , Dong, C. et al. (2014) Genome‐wide comparative analysis of NBS‐encoding genes between Brassica species and Arabidopsis thaliana . BMC Genom. 15, 3. [DOI] [PMC free article] [PubMed] [Google Scholar]
- Zhang, Y.‐M. , Shao, Z.‐Q. , Wang, Q. , Hang, Y.‐Y. , Xue, J.‐Y. , Wang, B. and Chen, J.‐Q. (2016a) Uncovering the dynamic evolution of nucleotide‐binding site‐leucine‐rich repeat (NBS‐LRR) genes in Brassicaceae. J. Integr. Plant Biol. 58, 165–177. [DOI] [PubMed] [Google Scholar]
- Zhang, Y. , Xia, R. , Kuang, H. and Meyers, B.C. (2016b) The diversification of plant NBS‐LRR defense genes directs the evolution of MicroRNAs that target them. Mol. Biol. Evol. 33, 2692–2705. [DOI] [PMC free article] [PubMed] [Google Scholar]
- Zheng, F. , Wu, H. , Zhang, R. , Li, S. , He, W. , Wong, F.‐L. , Li, G. et al. (2016) Molecular phylogeny and dynamic evolution of disease resistance genes in the legume family. BMC Genom. 17, 1–13. [DOI] [PMC free article] [PubMed] [Google Scholar]
- Zhou, T. , Wang, Y. , Chen, J.‐Q. , Araki, H. , Jing, Z. , Jiang, K. , Shen, J. et al. (2004) Genome‐wide identification of NBS genes in Japonica rice reveals significant expansion of divergent non‐TIR NBS‐LRR genes. Mol. Genet. Genomics, 271, 402–415. [DOI] [PubMed] [Google Scholar]
Associated Data
This section collects any data citations, data availability statements, or supplementary materials included in this article.
Supplementary Materials
Figure S1 Multiple sequence alignment (MUSCLE) showing all seven RLKs contained in the largest RGA candidate cluster 0.
Figure S2 Expected (Evperm) and observed (Evobs) overlaps between RLK genes and PAV genes showing that the observed overlap is smaller than expected.
Figure S3 Local Z‐score plot for NBS genes associated with PA based on random shuffling of positions.
Figure S4 Expected (Evperm) and observed (Evobs) average distance between PAV genes and TEs.
Figure S5 Z‐score of the association in the mean distance between PAV genes and TE genes after randomly shuffling gene positions.
Figure S6 High impact, moderate impact and low impact SNPs per base pair compared with RGA class and presence/absence status.
Table S1 List of R‐genes and their classes.
Table S2 P‐values and Z‐scores as reported by regioneR between R‐gene candidates, PAV genes and TEs.
Table S3 Markers linked with QTLs in the literature, their forward and reverse sequence and citation, and their position in the B. oleracea v2.1 TO1000DH assembly (Parkin et al., 2014).
Data Availability Statement
All data used in this study were previously published in (Golicz et al., 2016) and are available at http://brassicagenome.net/databases.php. Code produced for this study is available at http://github.com/appliedbioinformatics/B_oleracea_R_genes_supplementary