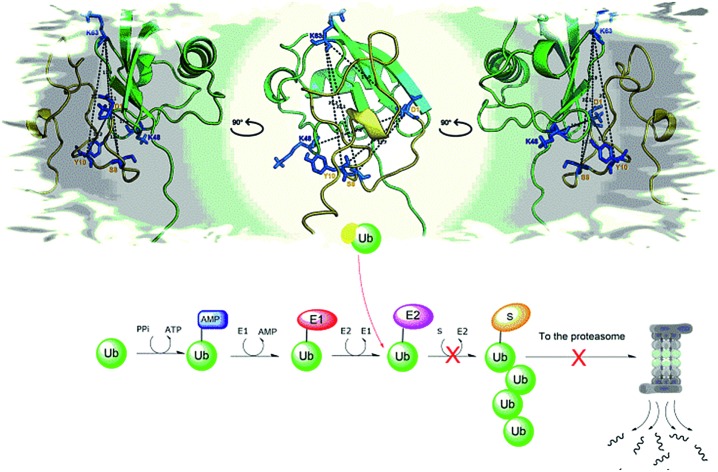
 Appetite for ubiquitin: a gushy travel companion in the intracellular journey of the amyloid β peptide.
Abstract
Several lines of evidence point to a compromised proteostasis associated with a reduction of the Ubiquitin Proteasome System (UPS) activity in patients affected by Alzheimer's Disease (AD) and suggest that the amyloid β peptide (Aβ) is an important player in the game. Inspired also by many reports, underlining the presence of ubiquitin (Ub) in the amyloid plaques of AD brains, here we set out to test whether Ub may bind the Aβ peptide and have any effect on its clearance pathways. By using an integrated array of MALDI-TOF/UPLC-HRMS, fluorescence, NMR, SPR, Microscale Thermophoresis (MST) and molecular dynamics studies, we consistently demonstrated that Aβ40 binds Ub with a 1 : 1 stoichiometry and Kd in the high micromolar range. In particular, we show that the N-terminal domain of the Aβ peptide (through residues D1, E3 and R5) interacts with the C-terminal tail of Ub (involving residues K63 and E64), inducing the central region of Aβ (14HQKLVFFAEDVGSNK28) to adopt a mixed α-helix/β-turn structure. ELISA assays, carried out in neuroblastoma cell lysates, suggest that Aβ competitively binds Ub also in the presence of the entire pool of cytosolic Ub binding proteins. Ub-bound Aβ has a lower tendency to aggregate into amyloid-like fibrils and is more slowly degraded by the Insulin Degrading Enzyme (IDE). Finally, we observe that the water soluble fragment Aβ1–16 significantly inhibits Ub chain growth reactions. These results evidence how the non-covalent interaction between Aβ peptides and Ub may have relevant effects on the regulation of the upstream events of the UPS and pave the way to future in vivo studies addressing the role played by Aβ peptide in the malfunction of proteome maintenance occurring in AD.
Introduction
Alzheimer's disease (AD), the most common form of dementia worldwide, is an age-related, fatal neurodegenerative disorder. A hallmark of AD is the presence of extracellular proteinaceous deposits (senile plaques) in the brain of affected people. The prevalent component of senile plaques is β-amyloid (Aβ).1 Although a firm relationship between the occurrence of different Aβ aggregates in the AD brain and the severity of the disease has not been established yet, Aβ misfolding and self-assembly are widely believed to be crucial pathogenic events in AD (amyloid hypothesis).2–4 Unfortunately, all clinical trials of amyloid-targeting drugs have failed so far5,6 suggesting that the amyloid hypothesis needs to be reconsidered. Intriguingly, several reports put in evidence that transgenic mice models of AD show an intracellular Aβ immunoreactivity7 which occurs before cognitive loss and massive amyloid plaques deposition and may be more closely associated with the disease progress.8 Therefore, studies focusing on the interplay between Aβ amyloid growth and protein clearance in the cell represent a promising arena for the design of more effective AD therapies.9
The removal of misfolded and potentially toxic cytosolic proteins is mostly regulated by the ubiquitin proteasome system (UPS).10 The first component of the UPS is ubiquitin (Ub), a small protein composed of 76 amino acids, with a compact globular structure characterized by a mixed parallel/anti-parallel β-sheet packing against an α-helix.11 Degradation of misfolded proteins by the UPS occurs first by labeling a lysine residue of the substrate with a (poly)ubiquitin tag (ubiquitinylation) which is specifically identified and degraded by the proteasome.12 When the UPS is not efficient, the removal of toxic protein assemblies gets slower and, in turn, the disease may progress more rapidly.
Consistent with this hypothesis, many reports suggest that the UPS malfunction plays a significant role in Aβ accumulation and, in turn, in AD progress.13 However, the effects of Aβ on proteasome function are still under debate. In particular, on one hand, the Aβ peptide has been observed to be a proteasome inhibitor on its own;14–21 on the other hand some studies have outlined how distinct Aβ peptide assemblies may inhibit or even activate different proteasome particles.22 The controversial role of Aβ in affecting proteasome function as well as the presence of Ub-positive proteinaceous aggregates in the senile plaques of AD patients23 suggests that UPS malfunction observed in AD could be then more likely linked to a failure of its upstream components (i.e., ubiquitinylation).24
Ubiquitinylation needs the coordinated activity of three distinct types of enzyme: (i) an ATP-consuming Ub-activating enzyme (E1); (ii) a Ub-conjugating enzyme (E2) and a Ub ligase (E3).25 Furthermore, the fact that these processes are largely governed by low-affinity interactions between Ub and the various Ub-writing enzymes (i.e., E1, E2 and E3)26 envisages the possibility that an excess of Aβ might inhibit, as a decoy effect, these processes through non covalent binding to Ub.
To test this hypothesis, here we use a battery of experimental (NMR, SPR, MST, cross-linking XL ESI-MS, MALDI-TOF MS) and in silico (MD) approaches to fully characterize the interactions of Ub with the Aβ amyloid peptide in terms of stoichiometry, affinity and binding sites. Next, we employ an ELISA assay to evaluate if the interaction of Aβ with Ub is detectable in cell lysates too, thus supporting the significance of this study in a biological context. These experiments are also paralleled by ESI-MS studies addressing Aβ hydrolysis by the Insulin Degrading Enzyme (IDE), a protease which is known to be involved in the physiological amyloid clearance.27 The effects of Ub on Aβ amyloid aggregation and Ub chain growth reactions are finally investigated.
Results and discussion
NMR analysis of Ub in complex with Aβ40
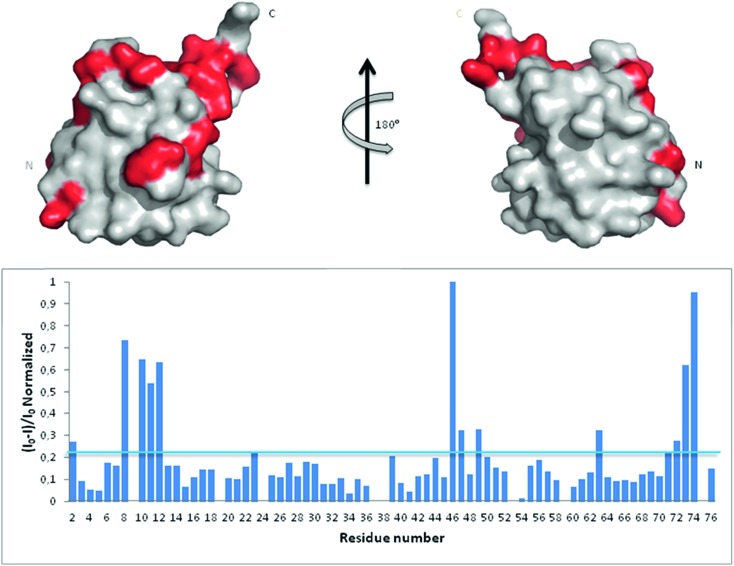
In an attempt to assess if Ub binds Aβ, we first analyzed Ub/Aβ interactions in solution by NMR spectroscopy. Free 15N–13C labeled Ub was characterized by means of a standard set of triple and double resonance experiments that constituted the reference spectra. There are two naturally occurring forms of the Aβ peptide: Aβ42 and Aβ40. Although Aβ42 is known to be more prone to form amyloid aggregates, Aβ40 is produced more abundantly in the cell (Aβ40 : Aβ42 molar ratio is 9 : 1) and thus may be more conveniently used to investigate interactions with Ub;28 furthermore, the tendency of Aβ42 to form aggregates makes it very problematic to carry out NMR experiments at very high concentrations. Unlabeled Aβ40 was then added as a single aliquot of a known amount to the sample and a new set of spectra was recorded. The translational diffusion coefficient, chemical shift and intensity variations of the different nuclei in the presence and absence of Aβ were evaluated. The translational diffusion coefficient measured for Ub in the absence of the peptide is 1.33 ± 0.12 × 10⁻¹⁰ m2 s–1, consistent with values reported in the literature.29 The same coefficient measured in the presence of Aβ40 is 1.28 ± 0.18 × 10⁻¹⁰ m2 s–1. These coefficients allow us to rule out protein–protein aggregation phenomena mediated by Aβ40 within the NMR spectroscopic concentration range investigated and are in agreement with the interaction between the two molecules. The analysis of Ub HSQC after sub-stoichiometric Aβ40 addition shows that the overall Ub fold is maintained, although a number of peaks are perturbed. As protein–ligand interactions correspond often to a redistribution of the protein internal dynamics,30–33 intensity changes of the amide cross-peaks in the 2D [1H,15N]-HSQC spectra represent sensitive probes of exchange and/or relaxation rate variations of each protein residue upon interaction (see Fig. S1 in the ESI†). Perturbation of signal intensities with respect to the reference spectra as a function of ligand addition thus provides useful dynamic and conformational information about the binding event. Mapping the differences in normalized signal intensities onto the Ub structure (PDB code: ; 1UBQ; Fig. 1 upper panel) outlines a region influenced by the interaction with Aβ40, which involves residues belonging to the C-terminal tail and the β sheet of the molecule, leading to a loss in intensity of their HSQC cross-peaks (Fig. 1 lower panel). The residues composing the helix appear not to be involved in the interaction as their cross-peaks are less influenced by the presence of the peptide in solution.
Fig. 1. Upper panel: mapping onto the Ub structure of the intensity variations of the 1H and 15N amide cross-peaks after the addition of Aβ40 defines a neat region of the peptide interaction. The residues whose peaks were reduced in intensity are represented in red. Lower panel: 1H and 15N amide cross-peaks intensity variations of the Ub HSQC spectrum after the addition of 30 μM Aβ40 reported as a function of protein residue numbers.
Molecular modeling of Ub/Aβ complexes
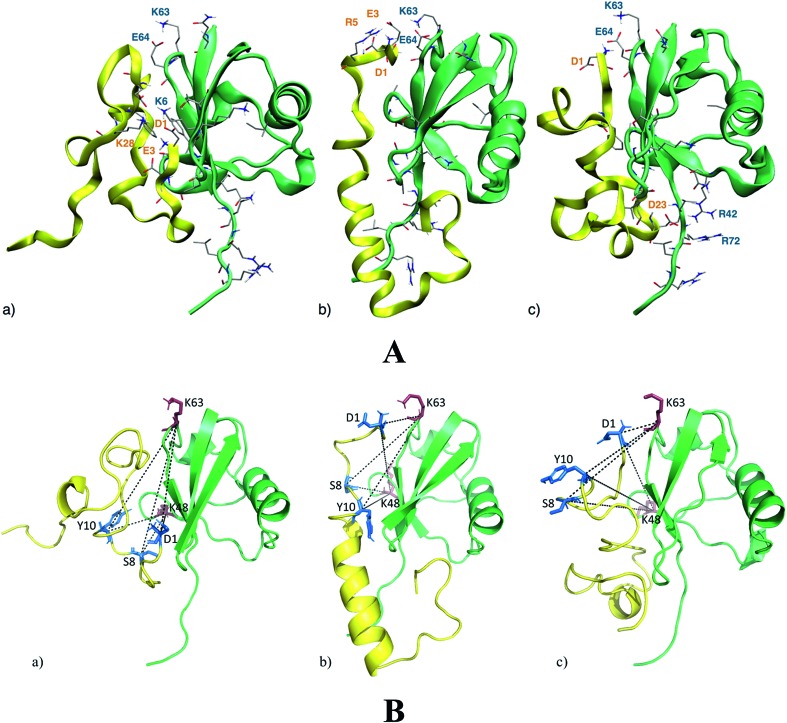
NMR analysis provides molecular details about the Ub residues directly involved in the interaction with Aβ. These data are used as a starting point to describe, at an atomistic level, the Ub-bound conformation of Aβ by molecular modeling. Upon Aβ40 interaction with Ub, three main binding poses may be disclosed (Fig. 2A). The first binding pose features a network of salt-bridges involving the N-terminal section of Aβ40, with residues D1, E3 and K28 facing the Ub K6 residue (Fig. 2A(a)). This interaction triggers hydrophobic contacts between the Ub central region and Aβ40, which mainly adopts turn conformations with a short 310 helix involving the 16KLV18 segment. At variance with the latter binding surface, in the second binding pose, the N-terminal domain of Aβ40 faces the Ub C-terminal region. Herein, Aβ40 residues D1, E3 and R5 contact Ub residues K63 and E64, perturbing the typical salt-bridge network featuring the free Ub structure (Fig. 2A(b)). The central region of Aβ40 is less prone to interact with Ub owing to the intramolecular interactions building an α-helix in the 14HQKLVFFAEDVGSNK28 segment. In the third binding pose, the Aβ40 charged N-terminal amine of D1 faces residue E64 of Ub (Fig. 2A(c)). Even in this binding pose, the salt-bridge between K63 and E64 is affected by the N-terminal amine group. Furthermore, D23 comes in contact with R42 which is close to R72, perturbing the typical network of the charged arginine residues of the Ub structure. The central region of Aβ40 is involved in a loop, forming a small β-turn, which involves the segments 16KL17 and 35MV.36 On the whole, the Aβ40 N-terminal domain interacts with both the N- and C-terminal regions of Ub triggering subtle variations in the Aβ central domain which folds in α-helical structures resembling those observed elsewhere for membrane-bound Aβ peptides.34 Notably, molecular modeling suggests that the Ub binding induces significant structural constraints along the region encompassing the hydrophobic Phe residues of Aβ.
Fig. 2. Panel A: the three lowest energy binding modes for the Aβ40/Ub complex. Aβ40 sections are shown by yellow ribbons, Ub sections are shown by green ribbons. The residues of Ub interacting with Aβ40 are shown by solid sticks and those involved in salt-bridge interactions are also labeled. The internal energies of the Aβ40/Ub complex in the three binding poses (a)–(c) are –4490 kcal mol–1, –4404 kcal mol–1 and –4271 kcal mol–1, respectively. Panel B: DSBU cross-links mapped onto the three lowest energy binding modes for the Aβ40/Ub complex. Aβ40 sections are shown in yellow, Ub sections are shown in green. The cross-linked residues of Aβ40 are shown by blue solid sticks and cross-linked residues of Ub are represented as red solid sticks. All the measured Cα–Cα Euclidean distances are shorter than 27 Å as required by the DSBU cross-linker.
Cross-linking experiments
Chemical cross-linking/mass spectrometry (XL-MS) is a well-established tool that allows gaining insights into protein conformations and protein–protein interactions.35–38 It relies on creating distance constraints between cross-linked amino acid side chains that can be further used to derive protein structures. Cross-linking can involve two residues belonging to a common protein or to different proteins of a supramolecular complex. In this study disuccinimidyl dibutyric urea (DSBU)39 has been used as homobifunctional cross-linker. Its succinimidyl ester (NHS-ester) head groups can react with the nucleophilic side chains of Lys, Ser, Thr, and Tyr, and with the N-terminus of proteins fixing their spatial arrangement. The cross-linked proteins and protein assemblies can be subsequently studied by mass spectrometry (MS) following a bottom-up approach. Such a process allows to unambiguously identify the cross-linked amino acids, proving their proximity in the native structure of the protein assembly.40 Cross-linking experiments of Ub in the presence of Aβ40 have been performed at pH 8 and DSBU has been employed as a reagent for covalently bridging Lys, N-termini, Ser, Thr, and Tyr, which lie within a Cα–Cα distance range of 27 Å. Cross-linked samples were subjected to a proteomic analysis following a bottom-up approach and data were scrutinized with MeroX software. Several intra- and inter-molecular crosslinks have been identified for the Ub/Aβ40 complex. Thirteen unique intramolecular Ub cross-links (Table S1 in ESI†) were mapped onto its X-ray structures (PDB code ; 1UBQ, 1.8 Å resolution).11 The relevant measured Euclidean Cα–Cα distances measured fall within the range of 6.2 to 20.2 Å with an average of 15.3 Å and are fully consistent with the known 3D arrangement of Ub. Intra-molecular Aβ40 cross-links were not considered for deriving structural information. In fact, it is not possible to distinguish between inter- and intra-molecular cross-links of Aβ40 as oligomeric Aβ40 aggregates may be present in solution during the cross-linking reaction. Four intermolecular cross-links were found between Ub and Aβ40. Interestingly, they exclusively involve the N-terminal region of Aβ40. In particular, Aβ40 D1 was found to be connected to K48 and K63 of Ub. The other two bridges were found between S8 or Y10 of Aβ40 and K48 and K63 of Ub. The targeted residues (S8 or Y10) of Aβ40 could not be assigned unambiguously. These cross-links were mapped onto the three 3D structure models of the Ub/Aβ40 complex disclosed by theoretical calculations (Fig. 2B). In all three binding poses the measured Euclidean Cα–Cα distances are <27 Å, in agreement with distances that DSBU can connect. Interestingly, the overall surface of Ub predicted to interact with Aβ40 is confirmed. However, the cross-links involving K63 partially tunnel the protein chains in pose “a” and can be explained only by a high Aβ40 flexibility. Conversely, all cross-links are fully consistent with the calculated binding poses “b” and “c” (Fig. 2A). These results mainly support the proposed binding poses “b” and “c” suggesting a structural organization of the Ub/Aβ40 complex where the N-terminal part of Aβ40 is in close proximity to the salt-bridge between K63 and E64 in Ub. The binding of Aβ42 with Ub disclosed through molecular simulations suggests fewer non-covalent interactions than those detected in the binding of Aβ40 with Ub. In particular, the salt-bridge network involving D1, E3 and K28 residues and the K6 residue of Ub is herein replaced by a salt-bridge interaction involving D11 or D7 with K6. Furthermore, the salt-bridge interaction between K63 and E64 of Ub remains unperturbed in the presence of Aβ42 and no charged residue of Aβ42 appears in contact with R42 or R72 of Ub (see Fig. S2 in the ESI†).
Measurement of dissociation constants (Kd) of the Aβ40/Ub complex
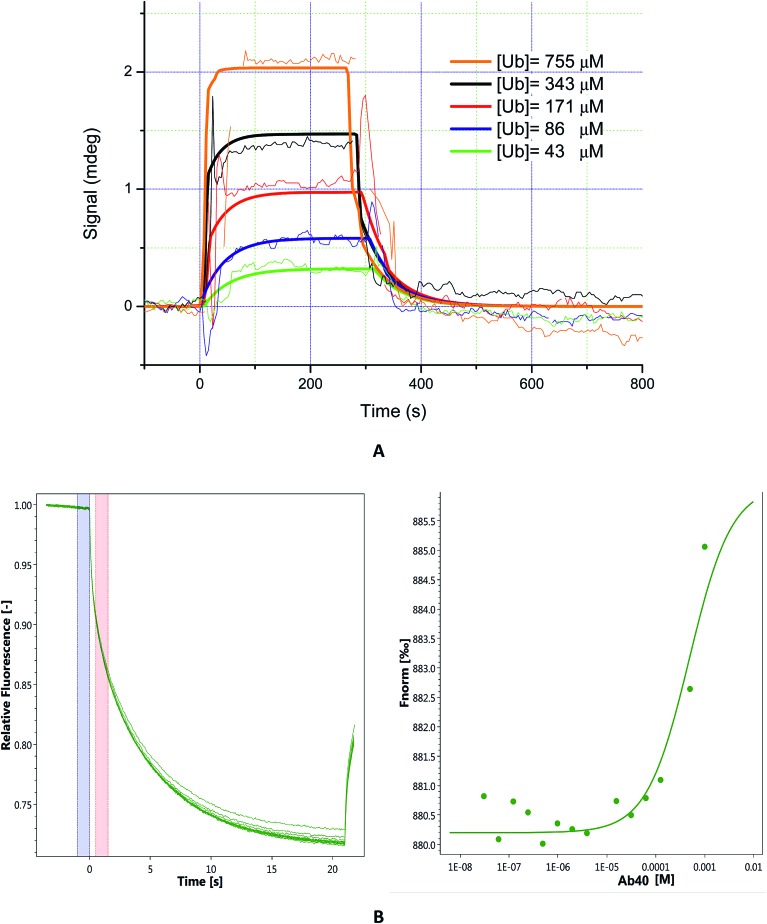
The majority of known Ub binding partners are characterized by affinities in the micro-molar range (2 μM < Kd <500 μM).41 Here, to evaluate the binding affinity of Aβ to Ub, we performed SPR analysis on immobilized Aβ40. Ub solutions were prepared by dissolving the protein in 10 mM PBS (pH 7.4)/Tween 20 (0.05%) and the injections were carried out in a serial configuration for 5 minutes at 20 μl min–1 and 30 μl min–1, respectively. Different concentration solutions of Ub (43 μM, 86 μM, 171 μM, 343 μM, and 755 μM) were prepared and after each injection a regeneration step was achieved using NaCl 2 M/NaOH 10 mM (30 μl min–1 for 3 minutes). The resulting sensograms, obtained after reference subtraction, were extracted with MP-SPR Navi Data viewer analyzed through the Trace Drawer™ software and kinetic parameters of the interaction between Ub and Aβ were calculated. Panel A of Fig. 3 represents the overlay between experimental curves and fitted ones, while in Fig. S3 in the ESI† the fitting residual value graph is shown. The fitting model adopted was “OneToOne”, which describes one monovalent ligand binding to one target. In this case, the following equation can be assumed to describe the biomolecular interactions:dY/dt = (ka × c – kd) × Ywhere Y is the recorded signal (Y(t = 0) = 0), c is the concentration of the ligand in the bulk liquid, t is the time in seconds, ka [M–1 s–1] is the association rate constant and kd (s–1) is the dissociation rate constant. Fitting parameters are reported in Table S4 in the ESI,† where Bmax represents the maximum signal, dependent on the number of receptors. All four fittings converge to the same kinetic parameters and reveal that Aβ binds Ub with a Kd = 3.56 × 10⁻⁴ M. In order to confirm that the Kd value obtained by SPR is not due to artifacts intrinsically linked to the SPR approach (immobilization of the Aβ40 on a solid substrate), it could be advantageous to evaluate the Ub/Aβ binding constants also by an independent technique. Microscale thermophoresis (MST) is a technology for the biophysical analysis of interactions between biomolecules. MST is based on the detection of a temperature-induced change in fluorescence of a target as a function of the concentration of a non-fluorescent ligand. Normalized fluorescence (Fnorm) is used to quantify binding via MST : Fnorm = F1/F0 where F0 refers to the initial fluorescence and F1 is the fluorescence measured several seconds after the IR-laser has been turned on, when the traces of unbound and bound states can be discriminated. Plotting these values against the ligand concentration results in a typical binding isotherm providing the affinity constant value of the interaction.
Fig. 3. Panel (A): sensograms (thin lines) and fitted curves (bold lines) of ubiquitin interacting with immobilized Aβ40. Five concentrations of ubiquitin were injected: 43 μM (green lines), 86 μM (blue lines), 171 μM (red lines), 343 μM (black lines), and 755 μM (orange lines). Panel (B): MST traces (left) of titrations of Aβ40 against ubiquitin; F0 (blue bar) and F1 (red bar) correspond to the fluorescence of unbound state and bound state, respectively. Plot of normalized fluorescence (right) obtained from Ub binding experiments versus Aβ40 at different concentrations (from 20 nM to 1 mM).
First, we carried out MST experiments to measure Kd for Ub binding to Aβ40 (see Fig. 3 panel B). Next, to rule out any possible bias due to amyloid aggregation, we also analysed Aβ1–16, a short soluble fragment that is thought to encompass the residues of the amyloid peptide involved in Ub interaction (see Fig. S4 in the ESI†). We found that Ub is able to bind both the molecules with a comparable Kd (Kd Aβ40 = 4.8 × 10⁻⁴ M and Kd Aβ1–16, = 3.4 × 10⁻⁴ M) in agreement with SPR data.
Aβ competitively binds Ub in whole cell extracts
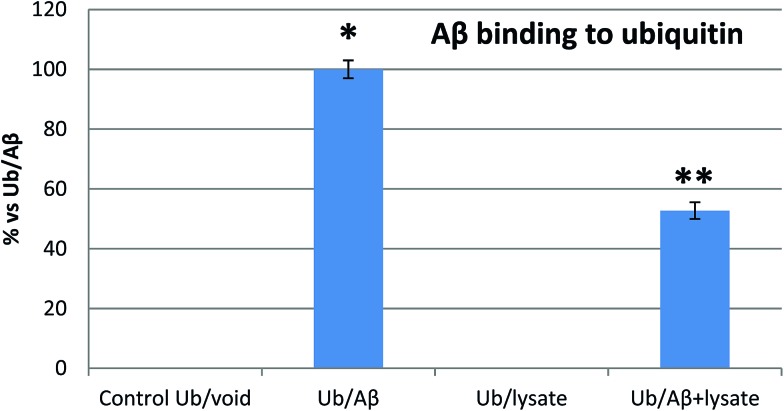
SPR and MST analysis have demonstrated that Aβ binds Ub with a binding affinity which is comparable with that observed for many other Ub binding proteins.40 Therefore, our next step was to confirm if Aβ may competitively bind Ub also in the presence of the complete pool of cellular Ub binding partners. To this aim, we investigated the interaction of Ub with the Aβ peptide in the presence of whole cell extracts from previously differentiated SHSY5Y neuroblastoma cells. Enzyme-linked immunosorbent assay (ELISA) is a convenient method widely employed to analyze protein–protein interactions in complex biological mixtures. Here, we employ an ELISA inhibition procedure, using alternatively Ub or Aβ40 as the solution binding partner to demonstrate that Aβ maintains its ability to bind Ub also in the presence of all natural cytosolic Ub binding partners (Fig. 4). The Aβ peptide binding to the Ub-coated well surface shows an overwhelming increase of the signal over the control. In this case, the presence of cell lysates reduced the Aβ40 binding to Ub by about 50%, thus demonstrating that Ub binds Aβ, albeit with a reduced signal intensity, and that this interaction is physiologically relevant, since it occurs also in the presence of the complete pool of cellular Ub binding partners. In a second control experiment, Ub binding to the Aβ40 peptide immobilized on the well surface of the ELISA plate shows a significantly increased signal too (Fig. S5 in the ESI†). As in the previous experiment, the binding is counteracted by the presence of cell lysates thus demonstrating that Aβ may competitively binds Ub also in the presence of all cytosolic components.
Fig. 4. Inhibition ELISA histograms for different Aβ solutions (Ub/void: buffer; Ub/Aβ: 10 μM Aβ in buffer solution; Ub/Lys: whole cell lysates; Aβ/Ub + Lys: 10 μM Aβ in cell lysates) added to Ub-coated microwells. Significant differences from control values were indicated by (p < 0.05) * (vs. control) ** (vs. lysate competition) (one-way ANOVA with Tukey's post hoc test). Normalized data are reported as percentages considering 100% as the signal referring to the Ub/Aβ solution.
The proteolytic activity of IDE versus Aβ40 is altered by Ub
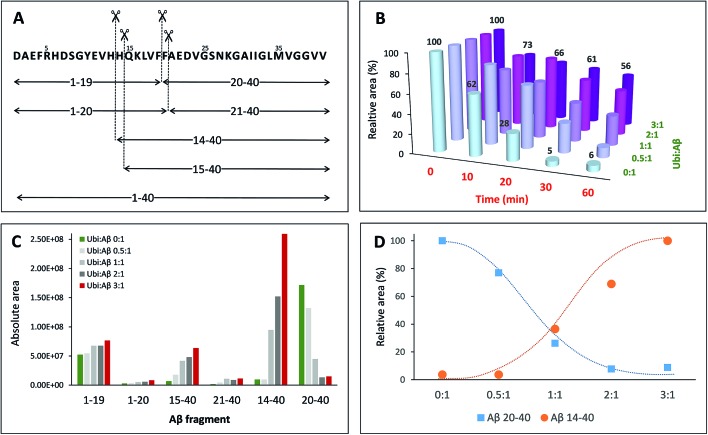
Once established that Aβ may bind Ub in the cytosol, it is important to evaluate how this interaction may interfere with the physiological peptide clearance. The cellular homeostasis of Aβ is regulated by several proteases and degrading systems42 among which IDE gives a particularly important contribution to the clearance of amyloidogenic peptides43 including Aβ, amylin and insulin.44–47 Thus, any substance that somehow interacts with Aβ under physiological conditions could reasonably affect its IDE-mediated hydrolysis. In this context, the dose-dependent effect of Ub on the IDE-catalyzed hydrolysis of Aβ has been evaluated through a proteomic approach based on Ultra Performance Liquid Chromatography (UPLC) coupled with High Resolution Mass Spectrometry (HRMS). The enzymatic degradation of the amyloid peptide produced nine peptide fragments within 60 min of reaction (Table S3 in the ESI†). As previously described,48 in the early stage of the IDE-mediated hydrolysis, the main targeted regions encompass the hydrophobic Phe residues, the vicinal His residues, and, to a lesser extent, Asn27 and Met35 (Fig. 5A). By means of the LC-MS analysis, all complementary peptide fragments adjacent to each cleavage site have been detected. The total amount of the full length substrate (i.e., Aβ40) clearly decreases over the reaction time (Fig. 5B) such that after 20 min of reaction the concentration of Aβ40 is 28% relative to the initial value and drops down to 5% after 30 min. Such a trend is maintained when Ub was added to the reaction mixture but it is noteworthy that the rate of signal decrease is affected by Ub in a dose-dependent manner (Fig. 5B). When the Ub : Aβ40 molar ratio is 0.5 : 1, the residual substrate is 32% after 30 minutes with respect to the starting condition. Finally, 56% of Aβ40 is still present after 60 min of reaction at the highest Ub : Aβ40 molar ratio tested (3 : 1). Although the documented interaction between IDE and Ub49 does not rule out the possibility that Ub itself might somewhat affect IDE proteolytic activity, data shown in Fig. 5 represent a clear evidence in favor of an inhibitory effect by the non-covalent interaction between Ub and Aβ40 on the IDE-mediated hydrolysis of Aβ40, in accordance with other experimental approaches adopted throughout this paper. In order to elucidate the regions of the Aβ sequence mainly involved in the interaction with Ub, the amount of all peptide fragments was reported as a function of the Ub : Aβ40 molar ratio (Fig. 5C). In the absence of Ub (green bars) and in samples collected after 60 min of reaction, the chromatographic peaks having the higher intensity are those related to the complementary peptides Aβ1–19 and Aβ20–40, whereas Aβ1–20, Aβ21–40, Aβ14–40 and Aβ15–40 are barely detectable. Increasing amounts of Ub had a very small effect on the concentration of Aβ1–20 and Aβ21–40; only a slight increase was observed for Aβ1–19, whilst the concentration of Aβ14–40, Aβ15–40 and Aβ20–40 was greatly affected by the presence of Ub in a dose-dependent manner. In particular, the formation of Aβ15–40 (and even more of Aβ14–40) is activated by the presence of Ub, whereas the formation of Aβ20–40 is greatly inhibited proportionally to the concentration of Ub. The opposite trend, relative to the amounts of these peptide fragments formed at the various peptide : Ub ratios, is evident in Fig. 5D.
Fig. 5. Dose-dependent effect of ubiquitin on the hydrolysis of Aβ40 catalysed by IDE. (A) Schematic of the IDE-induced hydrolytic pattern of Aβ40 at 37 °C after 1 h of reaction. (B) Relative amounts of Aβ40 (with respect to the initial one) as a function of the reaction time and of the Ub : Aβ40 molar ratio. Amounts of all the digested peptide fragments (C) or only Aβ14–40 and Aβ20–40 (D) as a function of the Ub : Aβ40 molar ratio.
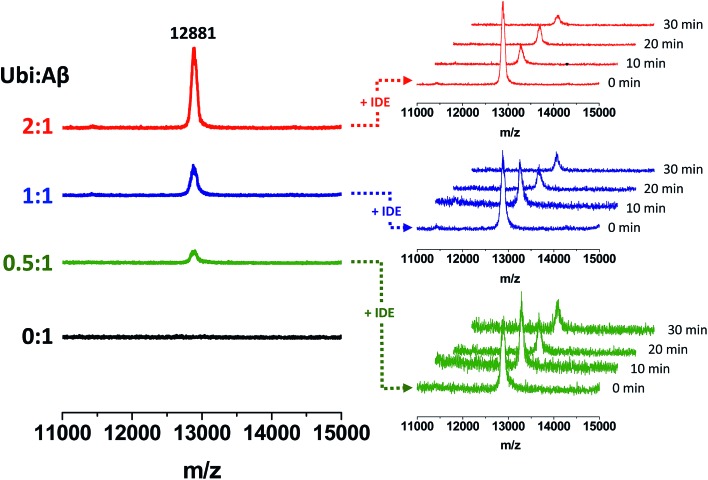
The non-covalent interaction between Aβ and Ub has a clear site-specific effect on the IDE-mediated hydrolysis of Aβ. The trend related to the formation of peptide fragments indeed suggests that Ub somehow inhibits the cleavage of the Phe19–Phe20 peptide bond. Such an effect of Ub on the degradation pathway of Aβ is in accordance with molecular models, described above (see Fig. 2), showing significant structural restraints, occurring upon Ub binding, in Aβ regions encompassing the central hydrophobic cluster (14–28 residues). The strong activation of the enzymatic hydrolysis at His13-His14 and His14-Gln15 might be considered a natural consequence of the inhibition involving the vicinal Phe residues. Indeed, Aβ14–40 and Aβ15–40 are also processed by IDE to form Aβ20–40; therefore, their own Ub-dependent accumulation is reasonably considered a consequence of the effect of Ub on the formation of Aβ20–40. It is noteworthy that the crossing point between the Ub-induced increase of Aβ14–40 and the concomitant decrease of Aβ20–40 is reached when the Ub : Aβ molar ratio is 1 : 1. This evidence indeed strongly supports the 1 : 1 stoichiometry of the Ub : Aβ complex evidenced by all other experiments (NMR, XL-MS, SPR, MST and modeling). The 1 : 1 Ub : Aβ adduct has also been observed by MALDI-TOF measurements (Fig. 6). The molecular weight of the 1 : 1 adduct was detected in all samples containing both the amyloid peptide and Ub (Fig. 6, left graph). Moreover, the higher the Ub : Aβ molar ratio, the higher the absolute intensity of the mono-charged peak detected in linear mode, as a direct consequence of the amount of the complex formed. As a further confirmation of the peak attribution, these peaks drop down in the presence of IDE and proportionally to the reaction time, regardless of the Ub : Aβ molar ratio (Fig. 6, right graphs). This trend can only be ascribed to a Ub-related inhibition of Aβ hydrolysis by IDE. These results coupled also with the finding that Aβ is a proteasome inhibitor (see Fig. S6 in the ESI†) support the hypothesis that excess Aβ may significantly affect protein clearance pathways.
Fig. 6. Formation of Ub–Aβ adducts as a function of the Ub : Aβ molar ratio (left graphs) revealed by MALDI-TOF measurements and time-dependent variation of their intensities in the presence of IDE (right graphs).
Ub interferes with Aβ amyloid growth
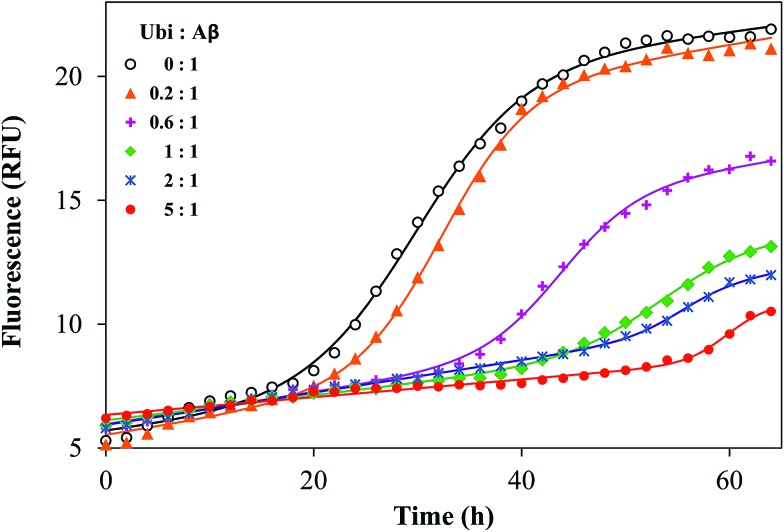
It is known that Aβ aggregation starts intracellularly,50 likely during abnormal interactions with lipid membranes.51–53 In order to investigate if the interaction between the amyloid peptide and ubiquitin modifies the well-known propensity of Aβ to aggregate into amyloid-like fibers, the amyloid aggregation of Aβ was monitored by using a switch-on fluorescent dye (ThT). The experimental data obtained by the kinetic measurements were properly fitted to the theoretical aggregation models (Fig. 7) in order to calculate the kinetic parameters of the aggregation process (Table S2 in the ESI†). The amyloid-like aggregation of Aβ follows a sigmoidal trend, as previously reported.54 The lag phase of the self-induced aggregation of Aβ lasts 19.2 h. Such a value significantly increases in the presence of Ub, even when the Ub : Aβ molar ratio is 0.2 : 1. The lengthening of the lag phase is proportional to the added amount of Ub and tlag becomes more than 60 h when the Ub : Aβ molar ratio is 3 : 1. The maximal fluorescence gain (Fmax – F0), proportional to the extent of fibril formation, has an opposite trend with respect to the concentration of Ub. The Fmax – F0 value is significantly affected by Ub when the Ub : Aβ molar ratio is equal or higher than 0.2 : 1. The Fmax – F0 value is 2.2 at the highest ratio tested (3 : 1). These data demonstrate that Ub delays the amyloid-type aggregation of Aβ in a dose-dependent manner and considerably reduces the extent of the fibril formation. Such an effect might be ascribed to a direct or indirect influence on the Aβ sequence covering the LVFF motif, which is involved in the mechanism of the amyloid aggregation and is a common target of many inhibitors of the Aβ aggregation.55 This hypothesis is congruent with the results of the IDE-mediated hydrolysis of Aβ in the presence of Ub.
Fig. 7. Representative kinetic profiles of the aggregation of Aβ40 in the presence of ubiquitin, with the Ub : Aβ ratio ranging from 0 : 1 to 3 : 1. Solid lines represent the fitted curves for each kinetic profile, whose related parameters are reported in Table S2.† .
Aβ1–16 inhibits Ub chain growth reactions in tube tests
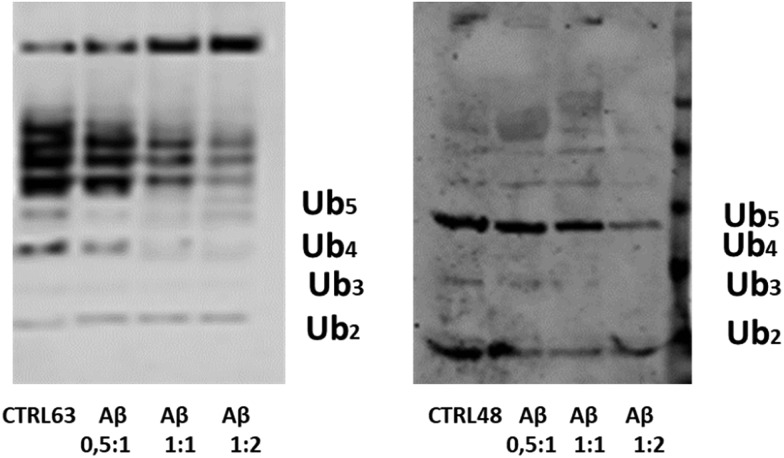
In the cell, Ub chain growth is initiated by the Ub-activating enzyme E1, which adenylates the C-terminus of ubiquitin in an ATP-dependent fashion to form a high energy thioester bond by a cysteine residue. Then, E1 hands the activated Ub over to a conjugating enzyme (E2), forming an E2–Ub complex in proximity of the target protein. The final ubiquitinylation of the substrate occurs through the action of specific E3 ubiquitin ligases. Unanchored (or free) Ub chains (i.e., Ub chains that are not linked to any substrate) are normally considered very useful tools to study ubiquitinylation processes. A number of protocols have been developed to produce K48 and K63-linked free Ub chains in tube tests,56 which may be thus considered as a helpful method to single out the capacity of adverse factors in affecting the Ub-conjugation machinery.56 Due to its significant affinity for Ub, it is plausible that Aβ may interfere with the complex cascade of events leading to poly-ubiquitinylation. To address this issue, we have carried out poly-ubiquitinylation reactions in the presence of increasing concentration of Aβ. First, we tried to use the full length Aβ40 peptide, but the simultaneous formation of high molecular weight oligomeric species during the ubiquitinylation reactions masked any possible effect. Then we used a soluble Aβ1–16 peptide, a fragment that contains all peptide residues that previous experiments consistently identified as Ub binding sites. The Aβ1–16 peptide has been added with a ratio 1 : 0.5, 1 : 1 and 1 : 2 with respect to Ub to both reaction mixtures (Fig. 8). Western Blot (WB) analysis has shown the dose-dependent inhibitory effect of the Aβ1–16 peptide on both Lys48- and Lys-63-linked ubiquitin chain elongation, being already evident at a ratio 1 : 1 of Ub/Aβ1–16. These data have further demonstrated that the interaction of Ub and Aβ hinders the regions close to the lysine 63 and 48.
Fig. 8. The WB analysis of Ub reactions in the presence of the Aβ1-16 peptide, with ratios of 0.5 : 1, 1 : 1 and 1 : 2 with respect to the Ub concentration.
Conclusions
Although accumulation of extracellular amyloid plaques in the brain is widely considered a hallmark of AD, a direct relationship between amyloid load and cognitive decline has never been unequivocally demonstrated. On the other hand, it is becoming increasingly evident that an abnormal rise of intracellular Aβ levels may be better correlated with neuronal loss and disease progression. Unfortunately, our knowledge of the intracellular chemistry of Aβ is largely incomplete and there is an urgent need for a more detailed description of the role played by Aβ in the pathological failure of cytosolic protein clearance supervisors like UPS and IDE.
Here, we show that Aβ has a relatively significant affinity for Ub. It forms 1 : 1 protein–protein complexes mostly involving the C-terminal tail and the β1/β2 loop of Ub. Next, consistent with many reports showing that Ub is often recognized by binding proteins through the hydrophobic surface encompassing residues Leu8, Ile44, His 68 and Val 70,57 non-covalent interactions involving the central hydrophobic cluster of Aβ40 and the Ub Ile44 were also observed. The residue D1 of the peptide was found to be linked to the K48 and K63 residues of Ub. These two Ub residues were also found to be in contact with residues S8 and Y10 of Aβ40. The N-terminal segment of Aβ40 (residues D1 E3 and R5) interacts with the Ub C-terminal domain and in particular with residues Lys63 and Glu64. Consistent with the observation that Lys48 and Lys63 residues are buried upon interaction with the N-terminal domain of Aβ, we have also observed that the water soluble fragment Aβ1–16 significantly inhibits Ub chain growth in tube tests. It is noteworthy that the Aβ/Ub interaction resembles non covalent contacts between Ub and Ub binding domains (UBDs) which are important players in Ub chain growth and signaling. For example, most of the known UBDs are predominantly α-helical and bind the Ile44 hydrophobic patch of Ub.58 Moreover, most of the UBDs exhibit binding affinities (Kd) in the range between 2 and 500 μM.41 Next, Aβ40 may assume an α-helical structure in its central hydrophobic cluster (residues 14–20) upon interaction with Ub. Besides these hydrophobic contacts, salt bridges connecting the D1 residue of Aβ40 with K63 and K48 of Ub are also evident. This coupled electrostatic/hydrophobic interaction likely explains the evident binding affinity of Aβ for Ub and may explain why the peptide is a competitive Ub binding protein. Furthermore, while on one side Aβ binding to Ub compromises its ability to recognize physiological binding partners, on the other side it significantly influences peptide secondary structure and ability to self-assemble into amyloid-like aggregates and to be degraded by IDE. The reduced propensity of Aβ40 to aggregate into amyloid fibrils is ascribable to the increased α-helical content observed in the Ub-bound peptide. This ability of Ub to mold poorly structured peptides has been already observed in previous reports.30 Remarkably, Ub/Aβ interactions also have a site-specific effect on the IDE-mediated degradation process of the amyloid peptide with possible consequences on the toxicity of the hydrolyzed Aβ fragments.59 Conclusively, these results evidence how the non-covalent interaction between Aβ40 and Ub may have important consequences in the regulation of the upstream events of the UPS and in IDE-mediated clearance pathways. These results may hopefully pave the way to future studies addressing the multifaceted role played by the altered Aβ homeostasis occurring in AD.
Author contribution
F. B. performed IDE-mediated hydrolysis studies; V. L. and S. G. V. performed polyubiquitination reactions; I. M. M. A. performed MALDI-TOF studies; A. P. performed molecular simulations; C. I. performed cross-linking studies; G. M., G. D. A and R. F. performed NMR studies; V. G. N. performed ELISA assays; D. S. and G. R. T. contributed to cell studies; M. C. wrote the paper; D. C. performed SPR experiments; L. P. and E. P. performed MST experiments; G. G. analyzed SPR data and designed the research; D. M. designed the research and wrote the paper.
Conflicts of interest
There are non conflicts of interest to declare.
Supplementary Material
Acknowledgments
This work was financially supported by the Italian MiUR (PRIN 20157WZM8A). C. I. is grateful to Prof. Andrea Sinz for continuous support.
Footnotes
†Electronic supplementary information (ESI) available. See DOI: 10.1039/c8sc03394c
References
- Selkoe D. J. Neuron. 1991;6:487–498. doi: 10.1016/0896-6273(91)90052-2. [DOI] [PubMed] [Google Scholar]
- Terzi E., Hölzemann G., Seelig J. Biochemistry. 1997;36:14845–14852. doi: 10.1021/bi971843e. [DOI] [PubMed] [Google Scholar]
- Yankner B. A., Duffy L. K., Kirschner D. A. Science. 1990;250:279–282. doi: 10.1126/science.2218531. [DOI] [PubMed] [Google Scholar]
- Hardy J. A., Higgins G. A. Science. 1992;256:184. doi: 10.1126/science.1566067. [DOI] [PubMed] [Google Scholar]
- Benilova I., Karran E., De Strooper B. Nat. Neurosci. 2012;15:349. doi: 10.1038/nn.3028. [DOI] [PubMed] [Google Scholar]
- Kepp K. P. Prog. Neurobiol. 2016;143:36–60. doi: 10.1016/j.pneurobio.2016.06.004. [DOI] [PubMed] [Google Scholar]
- Wirths O., Bayer T. A. Life Sci. 2012;91:1148–1152. doi: 10.1016/j.lfs.2012.02.001. [DOI] [PubMed] [Google Scholar]
- Schmitz C., Rutten B. P., Pielen A., Schäfer S., Wirths O., Tremp G., Czech C., Blanchard V., Multhaup G., Rezaie P. Am. J. Pathol. 2004;164:1495–1502. doi: 10.1016/S0002-9440(10)63235-X. [DOI] [PMC free article] [PubMed] [Google Scholar]
- Grasso G., Santoro A. M., Lanza V., Sbardella D., Tundo G. R., Ciaccio C., Marini S., Coletta M., Milardi D. Coord. Chem. Rev. 2017;347:1–22. [Google Scholar]
- Ciechanover A., Kwon Y. T. Exp. Mol. Med. 2015;47:e147. doi: 10.1038/emm.2014.117. [DOI] [PMC free article] [PubMed] [Google Scholar]
- Vijay-Kumar S., Bugg C. E., Cook W. J. J. Mol. Biol. 1987;194:531–544. doi: 10.1016/0022-2836(87)90679-6. [DOI] [PubMed] [Google Scholar]
- Pickart C. M., Fushman D. Curr. Opin. Chem. Biol. 2004;8:610–616. doi: 10.1016/j.cbpa.2004.09.009. [DOI] [PubMed] [Google Scholar]
- Nijholt D. A., de Graaf T. R., van Haastert E. S., Oliveira A. O., Berkers C. R., Zwart R., Ovaa H., Baas F., Hoozemans J. J., Scheper W. Cell Death Differ. 2011;18:1071. doi: 10.1038/cdd.2010.176. [DOI] [PMC free article] [PubMed] [Google Scholar]
- Gregori L., Fuchs C., Figueiredo-Pereira M. E., Van Nostrand W. E., Goldgaber D. J. Biol. Chem. 1995;270:19702–19708. doi: 10.1074/jbc.270.34.19702. [DOI] [PubMed] [Google Scholar]
- Gregori L., Hainfeld J. F., Simon M. N., Goldgaber D. J. Biol. Chem. 1997;272:58–62. doi: 10.1074/jbc.272.1.58. [DOI] [PubMed] [Google Scholar]
- Salon M. L., Pasquini L., Moreno M. B., Pasquini J. M., Soto E. Exp. Neurol. 2003;180:131–143. doi: 10.1016/s0014-4886(02)00060-2. [DOI] [PubMed] [Google Scholar]
- Song S., Kim S.-Y., Hong Y.-M., Jo D.-G., Lee J.-Y., Shim S. M., Chung C.-W., Seo S. J., Yoo Y. J., Koh J.-Y. Mol. Cell. 2003;12:553–563. doi: 10.1016/j.molcel.2003.08.005. [DOI] [PubMed] [Google Scholar]
- Oh S., Hong H. S., Hwang E., Sim H. J., Lee W., Shin S. J., Mook-Jung I. Mech. Ageing Dev. 2005;126:1292–1299. doi: 10.1016/j.mad.2005.07.006. [DOI] [PubMed] [Google Scholar]
- Almeida C. G., Takahashi R. H., Gouras G. K. J. Neurosci. 2006;26:4277–4288. doi: 10.1523/JNEUROSCI.5078-05.2006. [DOI] [PMC free article] [PubMed] [Google Scholar]
- Tseng B. P., Green K. N., Chan J. L., Blurton-Jones M., LaFerla F. M. Neurobiol. Aging. 2008;29:1607–1618. doi: 10.1016/j.neurobiolaging.2007.04.014. [DOI] [PMC free article] [PubMed] [Google Scholar]
- Zhao X., Yang J. ACS Chem. Neurosci. 2010;1:655–660. doi: 10.1021/cn100067e. [DOI] [PMC free article] [PubMed] [Google Scholar]
- Morozov A. V., Kulikova A. A., Astakhova T. M., Mitkevich V. A., Burnysheva K. M., Adzhubei A. A., Erokhov P. A., Evgen'ev M. B., Sharova N. P., Karpov V. L. J. Alzheimer's Dis. 2016;54:763–776. doi: 10.3233/JAD-160491. [DOI] [PubMed] [Google Scholar]
- Lowe J., Blanchard A., Morrell K., Lennox G., Reynolds L., Billett M., Landon M., Mayer R. J. J. Pathol. 1988;155:9–15. doi: 10.1002/path.1711550105. [DOI] [PubMed] [Google Scholar]
- Ciechanover A., Brundin P. Neuron. 2003;40:427–446. doi: 10.1016/s0896-6273(03)00606-8. [DOI] [PubMed] [Google Scholar]
- Hershko A., Ciechanover A. Annu. Rev. Biochem. 1998;67:425–479. doi: 10.1146/annurev.biochem.67.1.425. [DOI] [PubMed] [Google Scholar]
- Wright J. D., Mace P. D., Day C. L. Trends Biochem. Sci. 2016;41:924–937. doi: 10.1016/j.tibs.2016.08.003. [DOI] [PubMed] [Google Scholar]
- Tundo G. R., Sbardella D., Ciaccio C., Grasso G., Gioia M., Coletta A., Polticelli F., Di Pierro D., Milardi D., Van Endert P. Crit. Rev. Biochem. Mol. Biol. 2017;52:554–582. doi: 10.1080/10409238.2017.1337707. [DOI] [PubMed] [Google Scholar]
- Sciacca M. F., Romanucci V., Zarrelli A., Monaco I., Lolicato F., Spinella N., Galati C., Grasso G., D'Urso L., Romeo M. ACS Chem. Neurosci. 2017;8:1767–1778. doi: 10.1021/acschemneuro.7b00110. [DOI] [PubMed] [Google Scholar]
- Arena G., Fattorusso R., Grasso G., Grasso G. I., Isernia C., Malgieri G., Milardi D., Rizzarelli E. Chem.–Eur. J. 2011;17:11596–11603. doi: 10.1002/chem.201101364. [DOI] [PubMed] [Google Scholar]
- Lanza V., Travaglia A., Malgieri G., Fattorusso R., Grasso G., Di Natale G., Zito V., Arena G., Milardi D., Rizzarelli E. Chem.–Eur. J. 2016;22:17767–17775. doi: 10.1002/chem.201603650. [DOI] [PubMed] [Google Scholar]
- Ebendal T. J. Neurosci. Res. 1992;32:461–470. doi: 10.1002/jnr.490320402. [DOI] [PubMed] [Google Scholar]
- Elam J. S., Thomas S. T., Holloway S. P., Taylor A. B., Hart P. J. Adv. Protein Chem. 2002;60:151–219. doi: 10.1016/s0065-3233(02)60054-3. [DOI] [PubMed] [Google Scholar]
- Aloe L., Bracci-Laudiero L., Bonini S., Manni L., Aloe L. Allergy. 1997;52:883–994. doi: 10.1111/j.1398-9995.1997.tb01247.x. [DOI] [PubMed] [Google Scholar]
- Vivekanandan S., Brender J. R., Lee S. Y., Ramamoorthy A. Biochem. Biophys. Res. Commun. 2011;411:312–316. doi: 10.1016/j.bbrc.2011.06.133. [DOI] [PMC free article] [PubMed] [Google Scholar]
- Sinz A. Mass Spectrom. Rev. 2006;25:663–682. doi: 10.1002/mas.20082. [DOI] [PubMed] [Google Scholar]
- Rappsilber J. J. Struct. Biol. 2011;173:530–540. doi: 10.1016/j.jsb.2010.10.014. [DOI] [PMC free article] [PubMed] [Google Scholar]
- Leitner A., Walzthoeni T., Kahraman A., Herzog F., Rinner O., Beck M. and Aebersold R., Molecular & Cellular Proteomics, 2010. [DOI] [PMC free article] [PubMed] [Google Scholar]
- Iacobucci C., Reale S., De Angelis F. ChemBioChem. 2013;14:181–183. doi: 10.1002/cbic.201200742. [DOI] [PubMed] [Google Scholar]
- Müller M. Q., Dreiocker F., Ihling C. H., Schäfer M., Sinz A. Anal. Chem. 2010;82:6958–6968. doi: 10.1021/ac101241t. [DOI] [PubMed] [Google Scholar]
- Iacobucci C., Götze M., Ihling C. H., Piotrowski C., Arlt C., Schäfer M., Hage C., Schmidt R., Sinz A. Nat. Protoc. 2018;13:2864–2889. doi: 10.1038/s41596-018-0068-8. [DOI] [PubMed] [Google Scholar]
- Sokratous K., Roach L. V., Channing D., Strachan J., Long J., Searle M. S., Layfield R., Oldham N. J. J. Am. Chem. Soc. 2012;134:6416–6424. doi: 10.1021/ja300749d. [DOI] [PubMed] [Google Scholar]
- J Baranello R., L Bharani K., Padmaraju V., Chopra N., Lahiri D. K., Greig N. H., Pappolla M. A., Sambamurti K. Curr. Alzheimer Res. 2015;12:32–46. doi: 10.2174/1567205012666141218140953. [DOI] [PMC free article] [PubMed] [Google Scholar]
- McCord L. A., Liang W. G., Dowdell E., Kalas V., Hoey R. J., Koide A., Koide S., Tang W.-J. Proc. Natl. Acad. Sci. U. S. A. 2013;110:13827–13832. doi: 10.1073/pnas.1304575110. [DOI] [PMC free article] [PubMed] [Google Scholar]
- Bellia F., Grasso G. J. Mass Spectrom. 2014;49:274–279. doi: 10.1002/jms.3338. [DOI] [PubMed] [Google Scholar]
- Bellia F., Pietropaolo A., Grasso G. J. Mass Spectrom. 2013;48:135–140. doi: 10.1002/jms.3060. [DOI] [PubMed] [Google Scholar]
- Tundo G. R., Di Muzio E., Ciaccio C., Sbardella D., Di Pierro D., Polticelli F., Coletta M., Marini S. The FEBS J. 2016;283:3755–3770. doi: 10.1111/febs.13841. [DOI] [PubMed] [Google Scholar]
- Tundo G., Ciaccio C., Sbardella D., Boraso M., Viviani B., Coletta M., Marini S. PloS One. 2012;7:e34376. doi: 10.1371/journal.pone.0034376. [DOI] [PMC free article] [PubMed] [Google Scholar]
- Lanza V., Bellia F., Rizzarelli E. Coord. Chem. Rev. 2018;369:1–14. [Google Scholar]
- Grasso G., Rizzarelli E., Spoto G. Biochim. Biophys. Acta, Proteins Proteomics. 2008;1784:1122–1126. doi: 10.1016/j.bbapap.2008.04.011. [DOI] [PubMed] [Google Scholar]
- Oddo S., Caccamo A., Tran L., Lambert M. P., Glabe C. G., Klein W. L., LaFerla F. M. J. Biol. Chem. 2006;281:1599–1604. doi: 10.1074/jbc.M507892200. [DOI] [PubMed] [Google Scholar]
- Kotler S. A., Walsh P., Brender J. R., Ramamoorthy A. Chem. Soc. Rev. 2014;43:6692–6700. doi: 10.1039/c3cs60431d. [DOI] [PMC free article] [PubMed] [Google Scholar]
- Sciacca M. F. M., Tempra C., Scollo F., Milardi D., La Rosa C. Biochim. Biophys. Acta, Biomembr. 2018;1860:1625–1638. doi: 10.1016/j.bbamem.2018.02.022. [DOI] [PubMed] [Google Scholar]
- Scollo F., Tempra C., Lolicato F., Sciacca M. F., Raudino A., Milardi D., La Rosa C. J. Phys. Chem. Lett. 2018;9:5125–5129. doi: 10.1021/acs.jpclett.8b02241. [DOI] [PubMed] [Google Scholar]
- Grasso G. I., Arena G., Bellia F., Rizzarelli E., Vecchio G. J. Inorg. Biochem. 2014;131:56–63. doi: 10.1016/j.jinorgbio.2013.10.020. [DOI] [PubMed] [Google Scholar]
- Oliveri V., Zimbone S., Giuffrida M. L., Bellia F., Tomasello M. F., Vecchio G. Chem.–Eur. J. 2018;24:6349–6353. doi: 10.1002/chem.201800807. [DOI] [PubMed] [Google Scholar]
- Pickart C. M. and Raasi S., in Methods in Enzymology, Academic Press, 2005, vol. 399, pp. 21–36. [DOI] [PubMed] [Google Scholar]
- Komander D., Rape M. Annu. Rev. Biochem. 2012;81:203–229. doi: 10.1146/annurev-biochem-060310-170328. [DOI] [PubMed] [Google Scholar]
- Hurley J. H., Lee S., Prag G. Biochem. J. 2006;399:361–372. doi: 10.1042/BJ20061138. [DOI] [PMC free article] [PubMed] [Google Scholar]
- Zhang A., Qi W., Good T. A., Fernandez E. J. Biophys. J. 2009;96:1091–1104. doi: 10.1016/j.bpj.2008.10.022. [DOI] [PMC free article] [PubMed] [Google Scholar]
Associated Data
This section collects any data citations, data availability statements, or supplementary materials included in this article.


